Introduction
Typical challenges in bioinformatics in an academic environment include “ad hoc” programming. No maintenance is really possible as scientists such as PhD students and post-doctoral scholars leave after their thesis is completed or after their post-doc contract. These scientists may also have no formal computer science training, and often there is no structured programming1 and solutions might not be compatible with each other. Furthermore, in an academic environment there are a number of inherent pressures to develop pragmatic and fast (“quick and dirty”) software solutions2.
In addition, there are some new and “modern” challenges, which become more and more pressing simply as the technology progresses: big data3, the wave of “omics” data to process, and the problem of interoperability of software tools4. Well-known recent solutions for this challenge are Taverna5 and Galaxy6,7. The latter in particular is well suited to dealing with large quantities of data such as new large-scale sequencing data.
Another issue is that the data should be accessible, with uniform syntax and rich semantics for integration. Furthermore, data schemes are prone for change due to rapid advances in the field, so a schema-free representation of data is increasingly important (for scientific data). The UniProt Consortium8 for instance has recently shifted from the use of relational databases to the semantic web for flexible data management.
To counter these older and general as well as new challenges, we have now developed a solution of iterative and intertwined development cycles (Butterfly model), which improves the typical aspects of long-term sustainability and maintenance. Furthermore, it features detailed user-requirement analysis, good graphical and simple user interfaces (optimized human-computer interface, HCI) and intuitive software use that also exploits natural language processing. Our model tackles current challenges: first, the interoperability of the software takes into account middleware solutions, so that both database and user interfaces can be used flexibly. Second, the Butterfly approach improves the meticulous database engineering required to build large-scale and “omics” databases.
The Butterfly development cycle is different from previous approaches9–12. It requires some additional time investment at the start for design and implementation, but this pays off later. The Butterfly model worked well in our hands regarding the above challenges (section: Real time examples using Butterfly). In the following we confirm this by describing concrete software development.
The basic concept is really simple: plan ahead, back-check the critical development steps by a separate sub-cycle and talk with the user. It is important to spend more time on requirement analysis, as well as to invest well in interoperability and maintenance. We do not claim that these problems have not been recognized before nor that no alternative solutions for this are available2,6–8, but we are confident that with our approach it will be possible to obtain particularly well optimized and high quality bioinformatics software solutions in an academic environment. The initial time investment in the Butterfly paradigm helps to save time later due to the interoperability and easy maintenance of the software solutions achieved.
This paper is organized as follows: this section sets the stage for our agenda (section 1); Current Software Engineering and Development (section 2) highlights the modular phases of software development processes and compares several typical software strategies highlighting the novelty of our approach; next, the Butterfly work flow is explained (section 3), and software examples using the Butterfly approach (section 4) validate the Butterfly design principle by providing concrete examples of software projects from own work. Moreover we discuss some bioinformatics tools based on their type, methodology and usage.
Current Software Engineering and Development
Software Engineering (SE)9 is one of the most recognized fields in computer science as it matures and expedites the processes of software development. In particular, it allows a focus on the life cycle of software and sustainable development as an improvement to pragmatic short-lived implementations. SE has introduced many process improvement models and techniques10–12, and Software Development Life Cycle (SDLC) models13, with some variabilities14 and commonalties15–19. In general, depending upon the observed commonalties, we state
“Software Engineering is an integrated, cyclic and product line combination of following independent modular approaches: requirements engineering20–22, design modelling23–25,27–35 programming, testing and deployment”.
The five modular SE approaches remain the same when it comes to the software engineering of the scientific software solution development (Figure 1). However, in contrast to a pragmatic and maybe traditional software application development in an academic setting (Figure 2), a major change is the inconsistency in all phases of the SDLC. In the requirement engineering phase (Figure 2; traditional software solution development), all requirements should be provided before the start of design. This is not the case when dealing with most of the scientific software applications, and the requirements continuously change with the passage of time (we have proposed an updated SSE SDLC Model, Figure 1; scientific software solution development). Ultimately, this complicates the process of analysis and filters out functionals. Programming structures become complex (Figure 1), as the possibilities of error proneness (both logical and syntax errors) increase due to the continuous increment of variabilities in the pre-processed source code15–19.
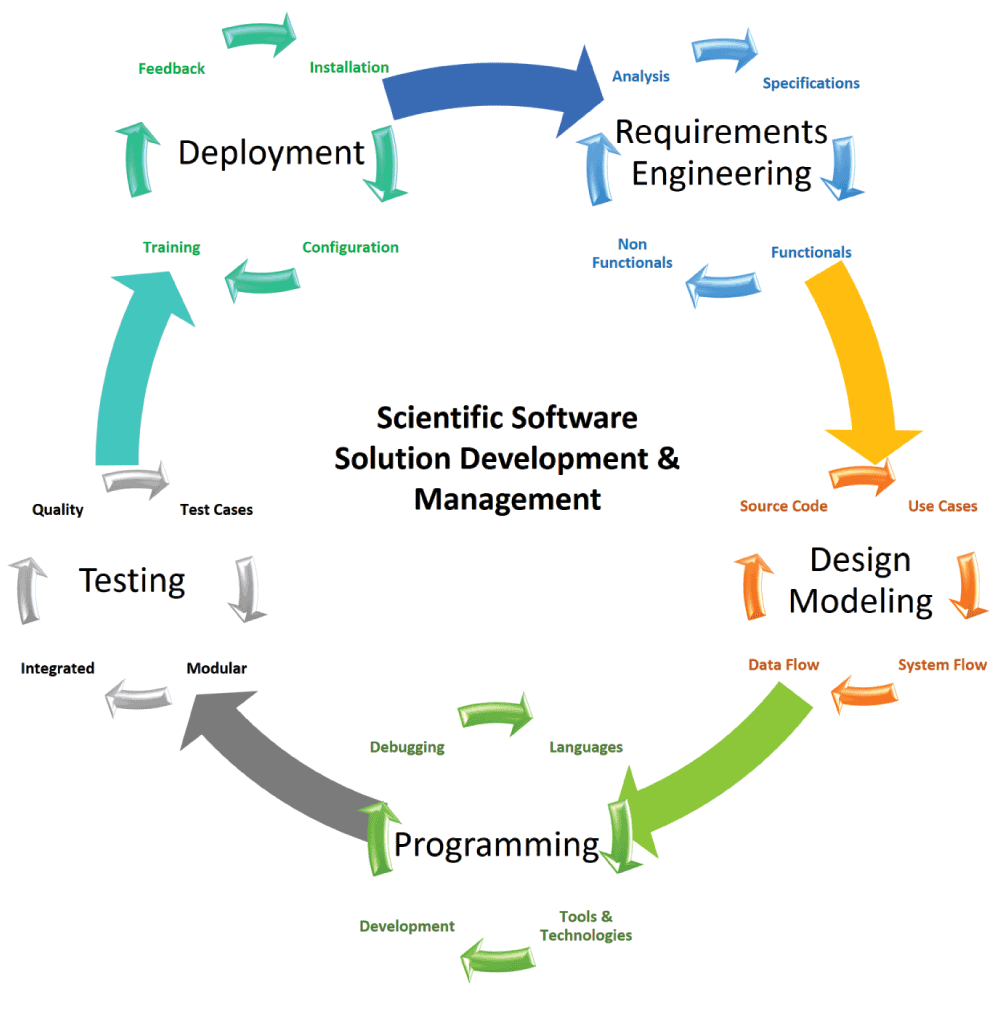
Figure 1. Scientific Software Engineering (SSE).
SSE integrates and combines in a development cycle the following independent main modular approaches: requirements engineering, design modeling, programming, testing and deployment. Each approach consists of its own sub-modular, integrated and cyclic combination of internal phases: requirement engineering consists of specification, functionals, non-functionals, and analysis; design modeling consists of use cases, system flows, data flow and source code; programming consists of languages, tools and technologies, development, and debugging; testing consists of test cases, modular, integrated and quality; finally, deployment consists of installation, configuration, training, feedback. Iterative cycles lead to continuous improvement. Achievements translate the goals in good software.
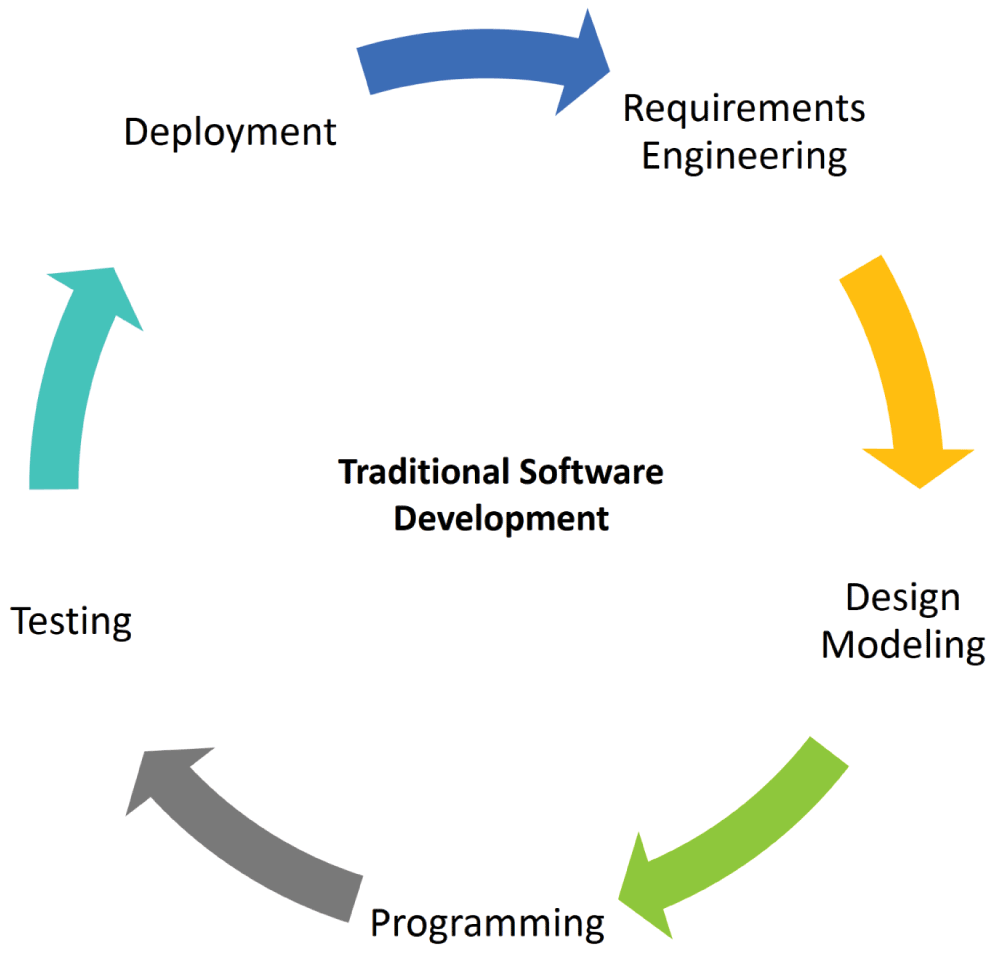
Figure 2. Traditional Software Development consisting of integrated and cyclic combination of the following independent modular approaches: requirements engineering, design modeling, programming, testing and deployment.
Testing of integrated and individual modules becomes time consuming (Figure 1), as new test cases have to be continuously rewritten and their application often leads to ‘ripple effects’29: these are unidentified logical or syntax errors in the system which arise while fixing the errors36,37. Depending upon the nature of the system, many approaches have been proposed to improve software quality control processes38–50 which improve standard software development and are important in scientific software quality assurance and improvement. Furthermore if the system keeps changing and is inconsistent, then the deployment procedures can also be complex and time consuming, especially for large applications with multiple interfaces and controls providing numerous individual and integrated functionalities.
To further help (SSE, non-computer scientist bioinformaticians etc.) in expediting the processes of adopting the concepts of SDLC, we provide a tabular comparison between different SDLCs, based on their commonalities and variabilities (Table 1). This comparison is based on following twenty four defined comparative SDLC (authors’ initiated) measures: Software Engineering Approach9, Initial, Developmental Plan, Software Requirements Engineering, In Depth Requirements Analysis51, Requirement Validation, Functionals, Risk Analysis, Software Design, Software Architecture Design, In Depth Software Design Modelling, Reusable Designing, Developmental Plan, Tools and Technology Selection and Analysis, Graphical User Interface Design, Preprocessed Source Code Writing15–18, Integrated Programming, Software Testing, In Depth Software Testing, Customer’s Evaluation, Deployment Procedures, Maintenance, Software Re-Engineering52, Cyclic or Repetitive, Easy to learn and Use, and User Training.
Table 1. Comparative feature based analysis between different software development life cycle models: Waterfall Model, V-Model, Spiral Model, Iterative and Incremental Model, Rapid Prototype Model, Extreme Programming Model, Evolutionary Model, Agile Development Model, Code and Fix Model.
| Features/SDLCs | Waterfall | V | Spiral | Extreme
Prog. | Iterative | Rapid
Prototype | Evolutionary | Agile
Dev. | Code
& Fix |
|---|
Software
Engineering
Approach
| Yes | Yes | Yes | Yes | Yes | Yes | Yes | Yes | Yes |
Initial,
Developmental Plan
| No | No | No | No | Yes | No | No | Yes | No |
Software
Requirements
Engineering
| Yes | Yes | Yes | Yes | Yes | Yes | Yes | Yes | No |
In Depth
Requirements
Analysis
| Yes | Yes | Yes | No | No | No | No | No | No |
Requirement
Validation,
Functionals
| No | No | Yes | No | No | No | No | No | No |
|
Risk Analysis
| No | No | Yes | No | No | No | No | No | No |
|
Software Design
| Yes | Yes | Yes | No | Yes | Yes | Yes | Yes | No |
Software
Architecture Design
| Yes | Yes | Yes | No | No | No | No | No | No |
In Depth Software
Design modeling
| Yes | Yes | No | No | No | No | No | No | No |
|
Reusable Designing
| No | No | Yes | Yes | Yes | No | Yes | No | No |
|
Developmental Plan
| No | No | Yes | No | No | No | No | No | No |
Tools and
Technology
Selection and
Analysis
| No | No | No | No | No | No | No | No | No |
Graphical User
Interface Design
| No | No | No | No | No | No | No | No | No |
Preprocessed
Source Code Writing
| Yes | Yes | Yes | Yes | Yes | Yes | Yes | Yes | Yes |
Integrated
Programming
| No | Yes | No | No | No | No | No | Yes | No |
|
Software Testing
| Yes | Yes | Yes | Yes | Yes | No | Yes | Yes | Yes |
In Depth Software
Testing
| No | Yes | Yes | No | No | No | No | No | No |
Customer’s
Evaluation
| No | No | No | No | No | Yes | No | No | Yes |
Deployment
Procedures
| No | No | No | No | Yes | No | Yes | Yes | No |
|
Maintenance
| Yes | No | No | No | No | No | No | No | Yes |
Software
Re-Engineering
| Yes | No | Yes | Yes | Yes | No | Yes | No | No |
|
Cyclic or Repetitive
| No | No | Yes | Yes | Yes | No | Yes | No | Yes |
Easy to learn and
Use
| Yes | Yes | No | No | Yes | No | Yes | Yes | Yes |
|
User Training
| No | No | No | No | No | No | No | Yes | No |
We applied these measures to nine different software development life cycle models: Waterfall Model53, V-Model54, Spiral Model55, Iterative and Incremental Model56, Rapid Prototype Model57, Agile Development Model58, Extreme Programming Model58, Evolutionary Model59, Code and Fix Model60. From this comparative analysis we conclude that there is no such one specific SDLC which can be helpful in all required phases of scientific software solution development, but some which might be more useful: Spiral, Waterfall and V-Model. Moreover the SDLCs famous for the quick development (Rapid Prototype Model, Agile Development Model, Extreme Programming Model, Evolutionary Model, Code and Fix Model), lack in quality software production.
As this is a general and open comparison, depending on the nature of the scientific software application, one can further analyze and pick that which suits best. Furthermore, we considered only the typical effort and strengths for each of these software development paradigms. A meticulous developer can of course take special care and spend more time on any of the features not typically covered by the software paradigm he follows, and turn the “no” for this feature into a “yes” simply by this additional effort during SDLC (for instance, regarding agile programming – for that matter, extreme programming can also be considered as a type of agile development). The goal for our “Butterfly” paradigm is a SDLC paradigm that fulfils all of the features regarding life cycle management of the resulting software.
Butterfly in scientific academia
If we search for “bioinformatics tools” over the web, thousands of entries can be found at one hit. But how many of those are fully designed, developed and tested solutions, used and maintained for a number of years and still in functional use?
At the beginning of a software project in academia, scientific solution development seems very interesting, fascinating and exciting. But with the passage of time, when the levels of complexities increase (due not only to the lack of developmental skills but also to the unavailability of proper designs), the work starts becoming tedious and unfruitful. This causes a lack of interest in software solution development and leads to a preference for wrapping up the work with a working script or small application, which can be published later on.
Here we propose a new science-oriented model (Figure 3), which can help the scientific software solution developers as well as the scientists/end users by generalizing the use of major developmental aspects correlating to the important scientific needs of the target system. The name of our new model is “Butterfly”.
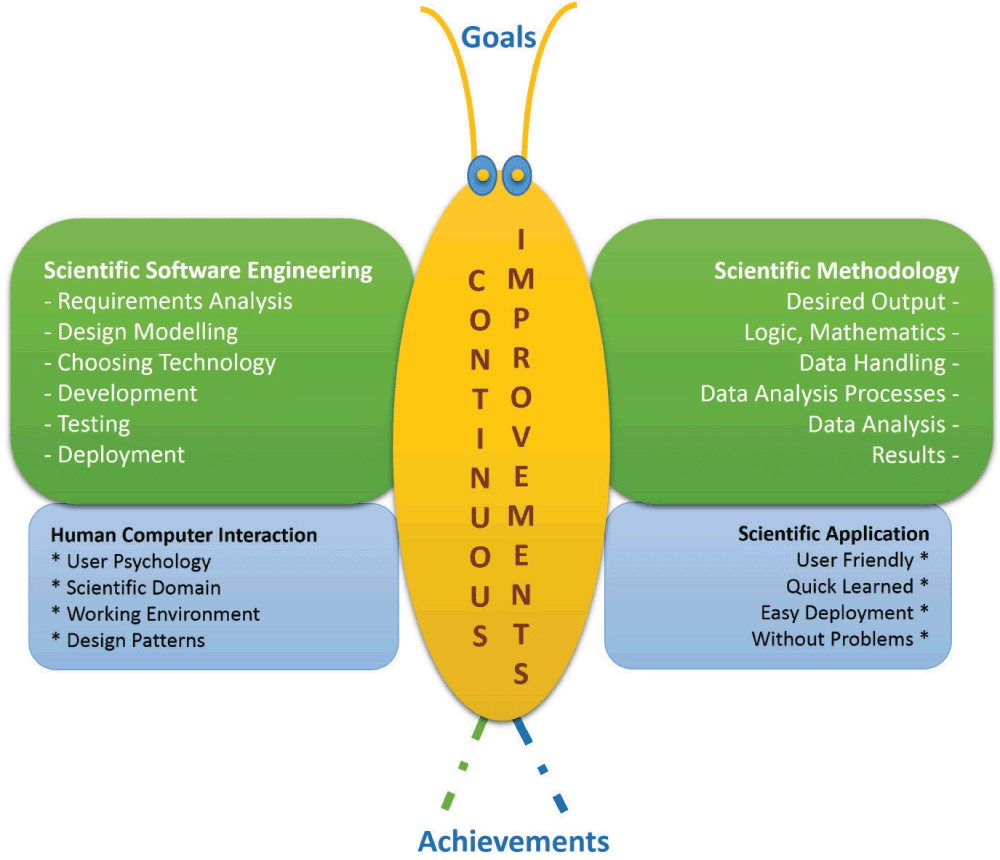
Figure 3. Butterfly model.
It consists of four wings: Scientific Software Engineering (upper left), Human Computer Interaction (lower left), Scientific Methodology (upper right) and Scientific Application (lower right). Moreover it leads to continuous improvement (in yellow). The achievements translate the goals into software.
In accordance with the name of the model, the ‘Butterfly’ represents sustainable and continuous improvements from goals to achievement as the central backbone of development. For larger projects this is further improved by using middleware between user interfaces and accessing the various data and databases involved. This also has the advantage that natural language processing needs to be implemented only once in the middleware and all the other modules have access to it. Finally, the backbone arrangement with a powerful middleware as well as all development elsewhere in the “Butterfly” stresses the interoperability of the software. It is developed by using well-defined and compatible output formats. Furthermore, below the middleware, well adapted, interoperable data schemes boost sustainable development of database structures, including efforts for scheme-less databases and other semantic web developments. The four continuously moving wings (Figure 3) represent the change in the requirements. The upper left wing of the model represents the scientific software engineering principles, and the lower left wing represents the HCI. The upper right wing represents the implementation of the specific methodology (focused on lowering the risk of development ripples) and the lower right wing represents the target scientific application producing the required results.
Scientific Software Engineering and Scientific Methodology
SSE is the most important phase of the Butterfly model, which promotes the usage of any earlier mentioned SDLC involving requirements analysis, design modeling, programming and testing of the scientific software solution. It correlates with the phase Scientific Methodology; the finalized functional requirements are based on the desired system output, and the system should be modeled according to the defined logics and mathematics (individual as well as the sequence of algorithms if there are more than one). The most suitable, advanced, recent, economically affordable, transferable, flexible and reliable developmental technologies should be chosen considering the use and availability of the data (large, small, complex, shared via intranet or internet).
Meanwhile, programming and processing of the complex and large data should be undertaken in order to have efficient data analysis, management and visualization. During the testing procedure of the developed system, all modules should be properly tested by the developer, by testing experts - if available -, and by the appropriate users. While testing the newly developed scientific system, the system should not be considered ready or functioning straight away. No real experiments should be performed prior to through testing to avoid any loss of data or waste of any scientific research/biological material or living beings (especially in case of behavioral research and analysis). Only after successful deployment the real time results should be evaluated.
For instance, if the target scientific software solution is a database manipulation and management system, then it will require to properly model the database schema (entity relationship model), by reducing the levels of data redundancy and dependency, via data normalization. There are five data normalization forms: 1NF, 2NF, 3NF, 4NF and 5NF, which include conceptual procedures for comprehensive database designing61. These data normalizations help in shaping the data types (1NF), developing the relationships between non-key and key fields (2NF, 3NF)62,63, and dealing with multi-valued facts which correspond to many relationships (4NF and 5NF)64,65.
Human computer interaction and scientific applications
The lower left wing of the Butterfly (Figure 3) is the HCI, known as Human Machine Interaction (HMI)66–68. This interacts with the lower right wing i.e. Scientific Application. HCI defines the implementation of the mechanisms that establish the efficient communication protocols between human and machines. These protocols are based on the textual, visual, sensory, video, audio and event based information, provided by both the user and the machine (computer). The backbone of the Butterfly allows by its middleware to rapidly exchange GUI applications and accessed databases if there is a need for it, considering the rapid developments in bioinformatics or if a user wishes to use GUIs or databases from comprehensive software environments, for instance regarding large-scale sequencing from Taverna5 or Galaxy6,7.
Unfortunately HCI is the most ignored and unattended phase of scientific software solution development. Often developers do not give priorities to the GUI design and implementation. The reasons for this negligence could be the pressure due to time limits for development, rapid functionality addition during development, excessive iterations, less field knowledge, lack of awareness about the importance of HCI, competitive general purpose software and human behavior analysis etc.66. In principle and practice, with respect to the user’s point of view, HCI is one of the most important parts of the software development. If the HCI is bad and the software is not easy to use, why use the software at all? Below we will present a particularly well-engineered solution in this respect, the ant database, focusing on a really easy user database access by smart phone.
During the scientific solution deployment and usage, the end user is probably a scientist without strong informatics background. To run and execute a script, first the compiler and the editor need to be installed, then depending upon the needed external libraries, the necessary libraries will need to be identified and used. This might be a very hectic task, especially for a person with no informatics background. In most of the cases, the result-producing applications cannot be used because of difficulties in deployment and execution procedures. Moreover, most of the time, many scientific software applications are not well documented, which also increases the level of complexities at the user end.
If the application is configured and is executed successfully, then the next task is to use it. If the application has been developed with an unfriendly GUI or a command line interface, it might be a problem for the user scientist, as to how to use it. If the application is not easily deployable and useable, then in most of the cases it can only lead to the loss of developer’s efforts.
To avoid such problems, the following aspects should be considered: user psychology, scientific domain, working environment and HCI design patterns. It is very important to understand the common psychology of the users of the applications e.g. if they are the laboratory scientists, they will be happy to have user friendly graphical interface and easy deployment procedure (e.g. small setup which runs and automatically configures all the required settings in the user’s system), so that they do not have to spend additional time on the configuration.
Scientific domain and working environments are two more important aspects to be considered while designing the graphical interface. These are particularly important especially when developing real time systems e.g. embedded, robotic, mobile applications. Moreover, it is important to consider that the use of HCI patterns and principles have a reliable HCI communication protocol implementation.
Without a doubt, designing a HCI interface meeting end user requirements is a very challenging and complex task. To reduce the level of complexities, HCI promotes the concept of a structured approach i.e. task decomposition. It helps developers make abstract designs with the use of specific processes and design artifacts, by keeping note of user requirements, usage scenarios and essential use cases. One of the best strategies to design an interface is first planning, then drawing sequential work-flow and finally writing down the levels of details.
After designing an interface, one of the important tasks is to evaluate its effectiveness and potential. One general and effective way is to engage the users and consider their feedback at every step. The technical approach is to use the HCI design principles: Experimentation, Contextualization, Iteration and Empirical Measurement67. Another beneficial method is to adopt and use the HCI design patterns: Window Per Task, Direct Manipulation, Conversational Text, Selection, Form, Limited Selection Size, Ephemeral Feedback, Disabled Irrelevant Things, Supplementary Window and Step-by-Step Instructions67.
Butterfly workflow designs
The Butterfly model implementation mechanism has a three-layered architecture: Gray, Yellow and Green (Figure 4).
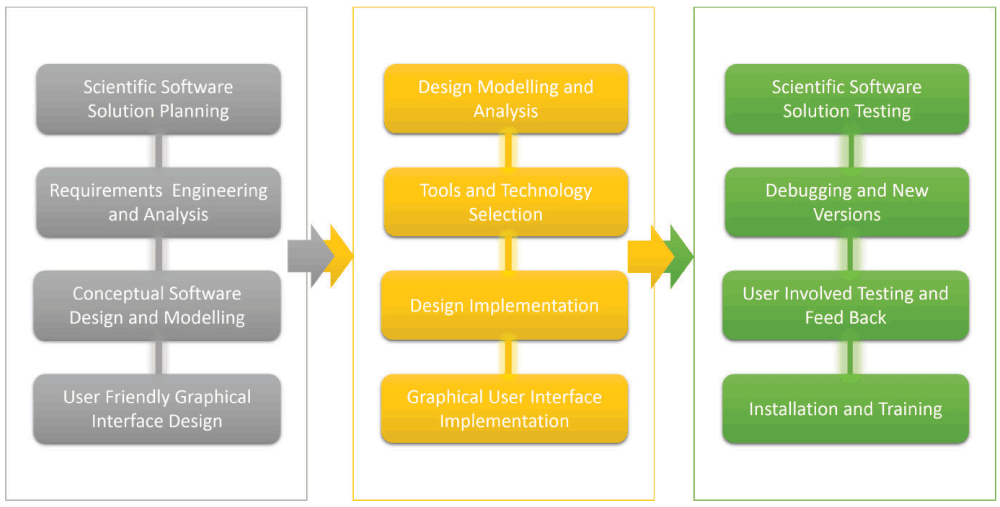
Figure 4. Butterfly three layer model.
Shown in gray is the abstract layer, in yellow is the basis for design and development, and in green the implementation and testing by the user. The software is released including installation and training.
Gray layer
The gray layer represents the most important phase of scientific software solution development, which involves software designers, developers, testers, graphical interface designers and, most importantly, the users. It consists of four phases: scientific software solution planning, requirements engineering and analysis, conceptual software design and modeling, and user friendly graphical interface. The layer has been named ‘Gray’ because at the beginning of a new scientific software solution development, most of the information seems uncertain.
Scientific software solution planning (Figure 5) is the first step towards a new scientific application development, which requires the introduction to the field itself (e.g. biochemistry, neurobiology, genetics, metabolomics, proteomics etc.) and project related information (e.g. what could be the end product, input to the system, expected output from the system, methodology, ideas, opinions etc.). It is important to know about the user’s information IT background and existing already available (old and recently developed) scientific solutions to the problem. The next important phase is to perform requirements engineering and analysis (Figure 6). During this phase, the most important tasks are to gather the requirements from users (e.g. interviews, brainstorming, documents, publications, running related systems based information etc.) and classify the information in functional and non-functional categories. Here, function requirements are those which can be implemented (based on existing resources, time, budget, labor, tools, technologies and methodologies), and non-functional requirements are those which cannot be implemented. It is very important to clarify with the users what will be the expected end-product because it is possible that the user may not like the output of the system after development. In this case, all the efforts will have been in vain.
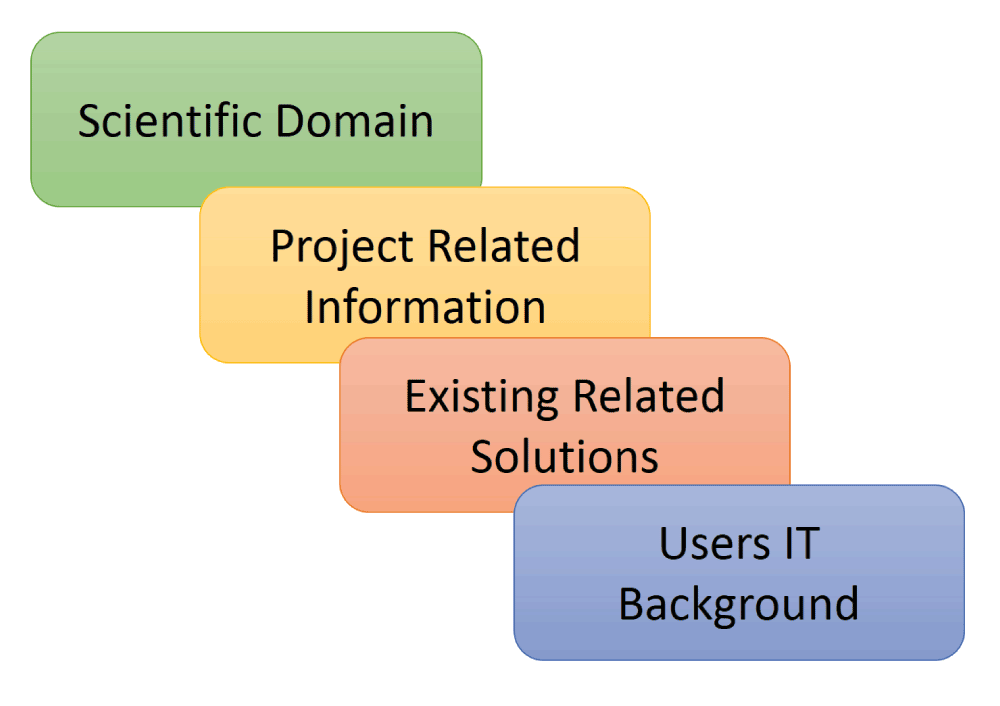
Figure 5. Scientific software solution planning.
Abstract planning is the first step of the top, abstract layer (gray, Figure 4) of the Butterfly design, key steps are indicated.
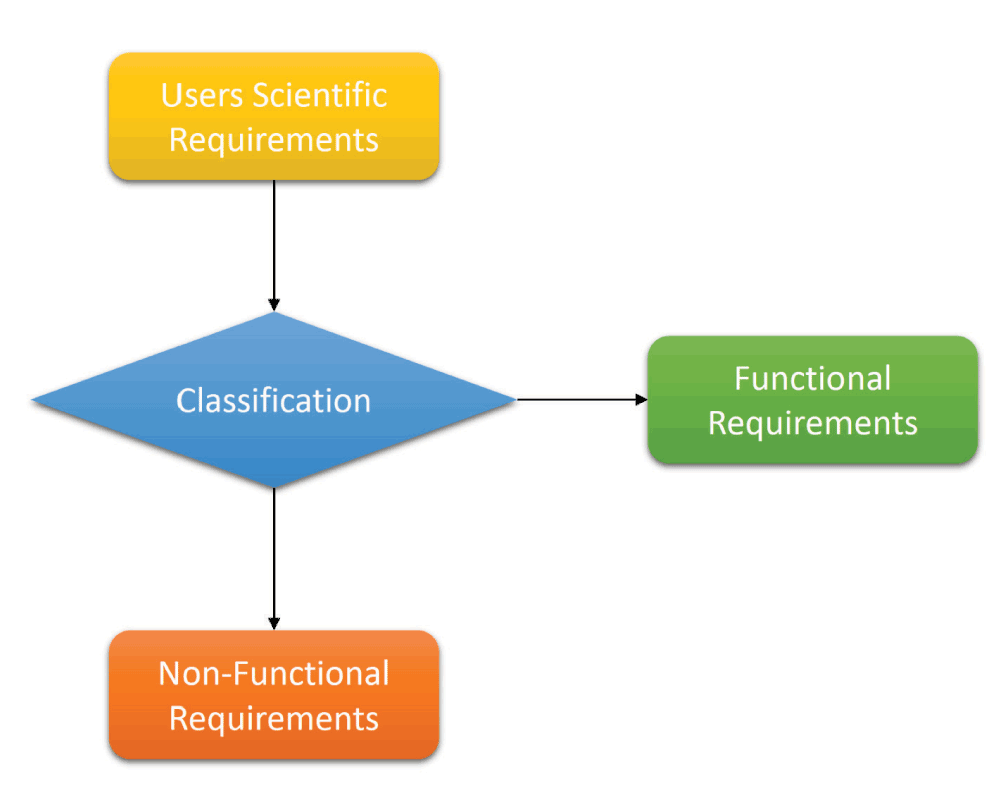
Figure 6. Requirements engineering and analysis.
This is the 2nd step of the top layer (gray layer) of the three layer model in the Butterfly design. Key tasks are indicated.
The third phase is the conceptual software design and modeling (Figure 7). This is particularly important when there is a team of software developers. Before moving ahead, one should go for some abstract designs based on functional requirements and discuss these with the team. It is crucial to estimate the expected workflow, data sources and data flow in the system. If possible, the abstract design should be discussed with the users as well.
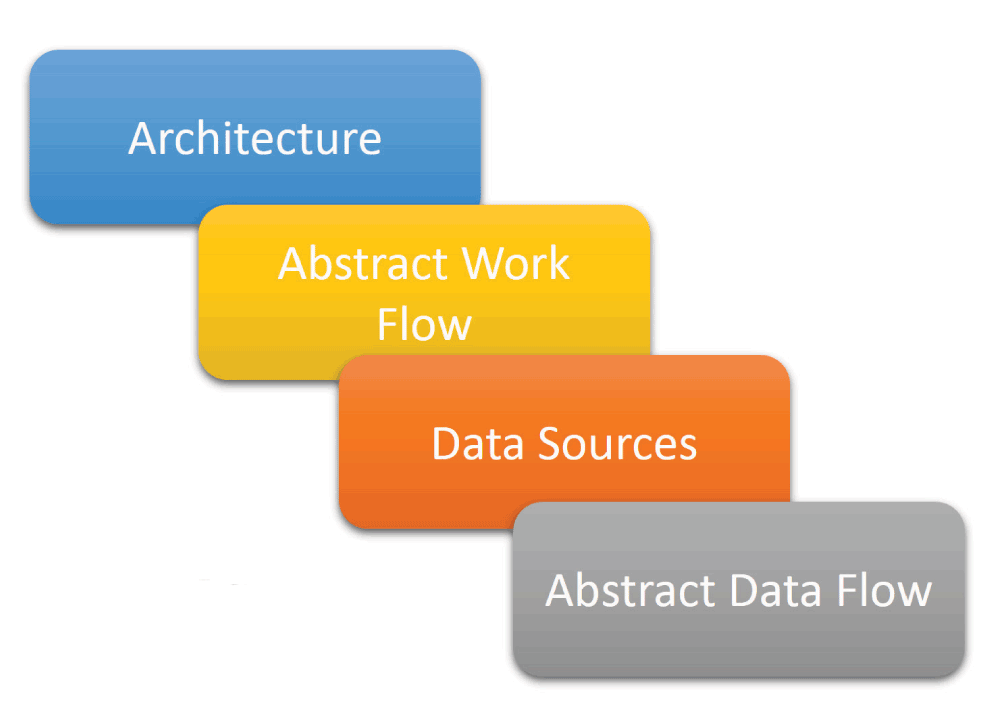
Figure 7. Conceptual software design and modeling.
This is the 3rd step of the top layer in the butterfly model.
The last phase of the gray layer concerns the design of a user-friendly GUI (Figure 8). First, some mock-ups should be made (hand-made on papers or better to use white board with color markers and later make pictures of finalized GUI designs), then these should be discussed with users in a brain storming session. Finally, based on the perceived designs, the abstract GUI (GUI with no running functionalities) should be created using HCI design patterns.
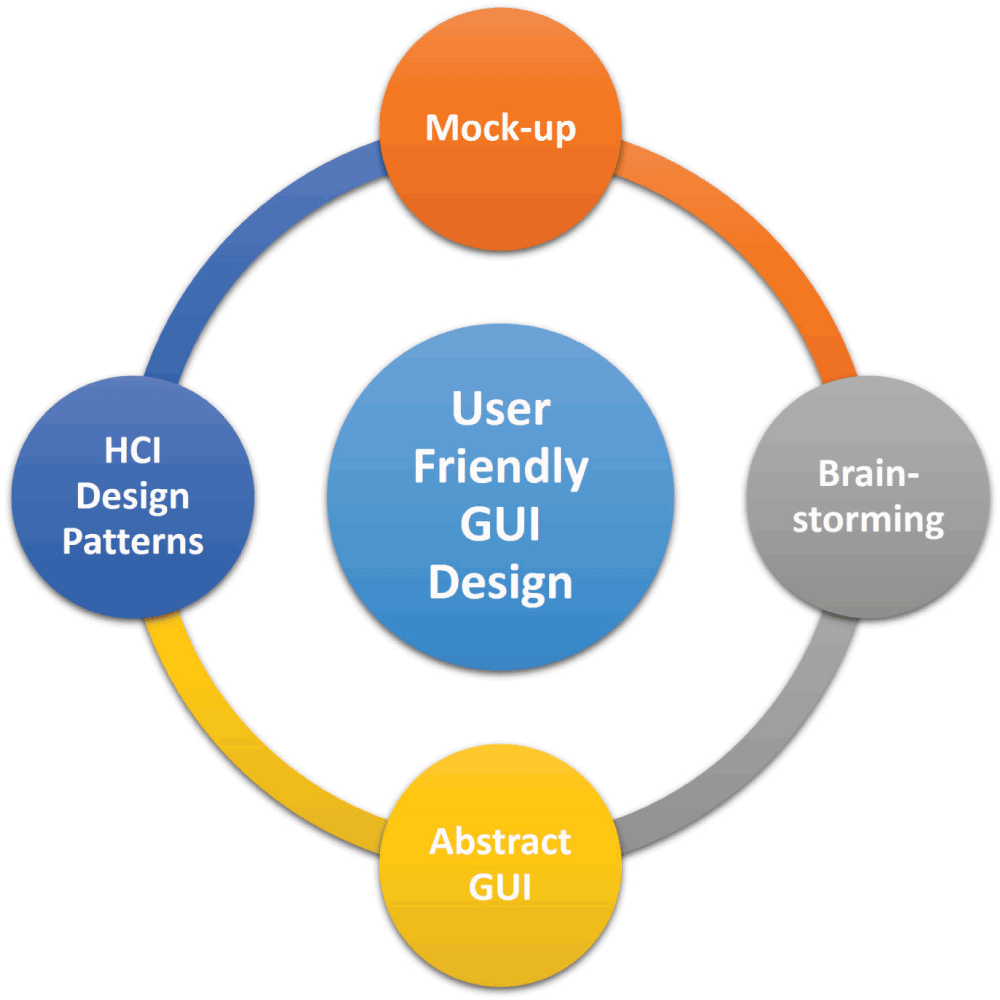
Figure 8. User Friendly Graphical Interface Designing.
This is the final step of the top, abstract layer (gray) of the three layers in the butterfly design.
Yellow layer
The yellow layer involves designers and developers. It consists of four phases: design, modeling and analysis, tools and technology selection, design implementation, and GUI implementation.
During design modeling and analysis, the important task is to create different implantable designs e.g. UML models (use case, class, system sequence, activity, component etc.) and database schemas (in case it’s a database management system). Here, we strongly recommend the use of Product Line architecture design modeling, where the whole software is divided into sets of modules, which work individually as well as together. This will customize project development and reduce error proneness during development. Moreover it will increase the concepts of modular reusability.
The next step involves the choice of available tools, technologies and programming languages that will be implemented in the designed models. The last step focuses on adding functionalities to the designed GUI.
Green layer
The green layer describes the final in house testing and debugging by the developers and tester. Some scientific software applications are developed to process the raw data using mathematical algorithms (e.g. processing GC-MS, LC-MS, NMR data), whereas some applications are implemented to perform different kind of experiments, which in return produce experimental data e.g. towards behavioural research on animals and insects etc.
Processing raw data is safe even if there are still some problems (e.g. minor calculation mistakes due to the different levels of fractional values or wrong implementation of mathematical algorithms, or some software developmental problems issues, which could be the ‘ripple effects’, or some logical bugs) after testing. However, when applied in real time experimentation, if the software does not work as expected, it could be very expensive and dangerous (e.g. if there is a software to control the temperature and light during experiments on insects or animals, and there are problems during experimentation leading to changes of the normal or expected temperature and light to some extreme positive or negative values, then this could not only effect the system’s hardware but can also threaten the life of animals or insects).
In order to avoid such problems, we enforce test trails by different users before making the software available for installation and training in the public domains.
Real time examples using Butterfly
A number of new scientific software applications based on the concepts of the Butterfly model have already been proposed, designed, implemented, tested and are currently in use. Some of them have been published and some remain unpublished. These applications are: Least Square MIDA (LS-MIDA), DroLIGHT, Isotopo, Lipid-Pro and App Ant Database.
LS-MIDA69,70 (Figure 9) is an own published scientific software (Department of Bioinformatics, Biocenter, University of Wuerzburg Germany) which estimates mass isotopomer distribution from the spectral data by analyzing each peak of given mass and each mass atom fragment. It implements a chain of mathematical and statistical algorithms, provides graphical interfaces to help users analyze experimental data and visualize the results, and provides a third party independent experimental data management system. For the most parts the requirement engineering and software design steps are followed until the final solution presented (Figure 9), and details on tested earlier solutions or specific requirements are available from the authors.
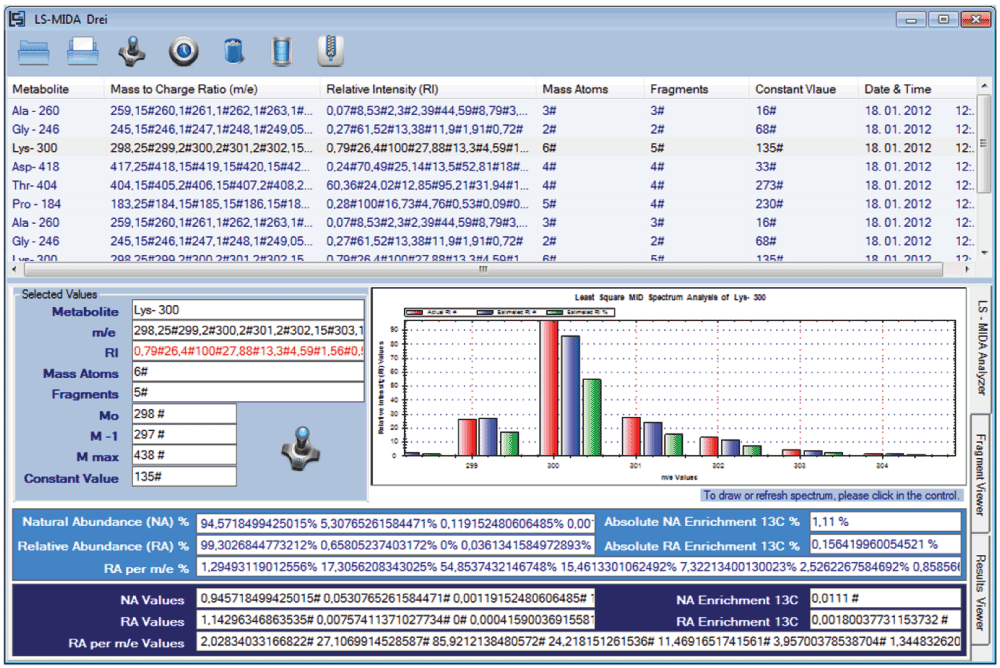
Figure 9. Least Square Mass Isotopomers Distribution Analysis’s (LS-MIDA) main graphical user interface.
Scientific software solution towards bioinformatics and biochemistry which estimates mass isotopomers distribution from spectral data by analyzing each peak of given mass and each mass atom fragment. (http://www.tr34.uni-wuerzburg.de/computations/ls_mida/).
DroLIGHT71–73 (Figure 10) is a published scientific computational solution towards neurobiology and photobiology (Department of Neurobiology and Genetics, Biocenter, University of Wuerzburg, Germany). It is a domain specific, intelligent, distributed, real time, embedded, data management system capable of controlling hardware devices, proficient in producing different colors of lights and monitoring the movements of Drosophila melanogaster. Moreover it also helps users generate circadian rhythms, provides a third party independent experimental data management system and produces experimentation output in two and three dimensional graphics formats. Constant improvement is further boosted by sustainable data structures and engineered robustness of the application. Furthermore, sustainable development and interoperability are considered from the start, support the rapid further development/improvement of software to study and manipulate circadian rhythm by different light cycles and test environments in drosophila.
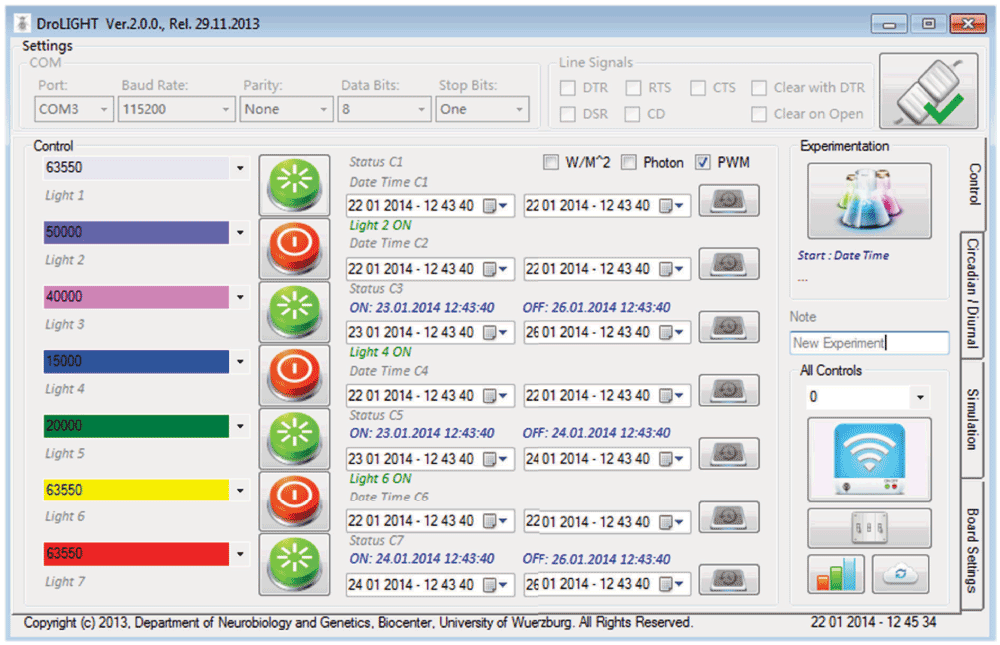
Figure 10. DroLIGHT’s main graphical user interface.
Scientific software solution towards neurobiology and photobiology, capable of controlling and automating the hardware that produces different colors of lights via Light Emitting Diodes (LEDs). It provides experimental data management system, circadian rhythm generation and 3D visualization of system’s performance and experimentation details. (http://www.neurogenetics.biozentrum.uni-wuerzburg.de/en/project/services/drolight/).
Isotopo software74 (Figure 11) is a published scientific software (Department of Bioinformatics, Biocenter, University of Wuerzburg, Germany), a bioinformatics solution with the ability of performing quantitative mass spectrometry in isotope labeling experiments. It is an extended version of the earlier software LS-MIDA with a well-optimized mathematics implementation. It not only provides the graphical interfaces for gas chromatography-mass spectrometry (GC-MS) experimental data analysis, visualization and management, but also provides an intelligent data parser to automatically transform the machine’s pre-processed data into the processable format of the Isotopo software (reducing both time and labor). It also provides a complete database management system as a simple, well sustainable version of a middleware between data storage and GUIs.
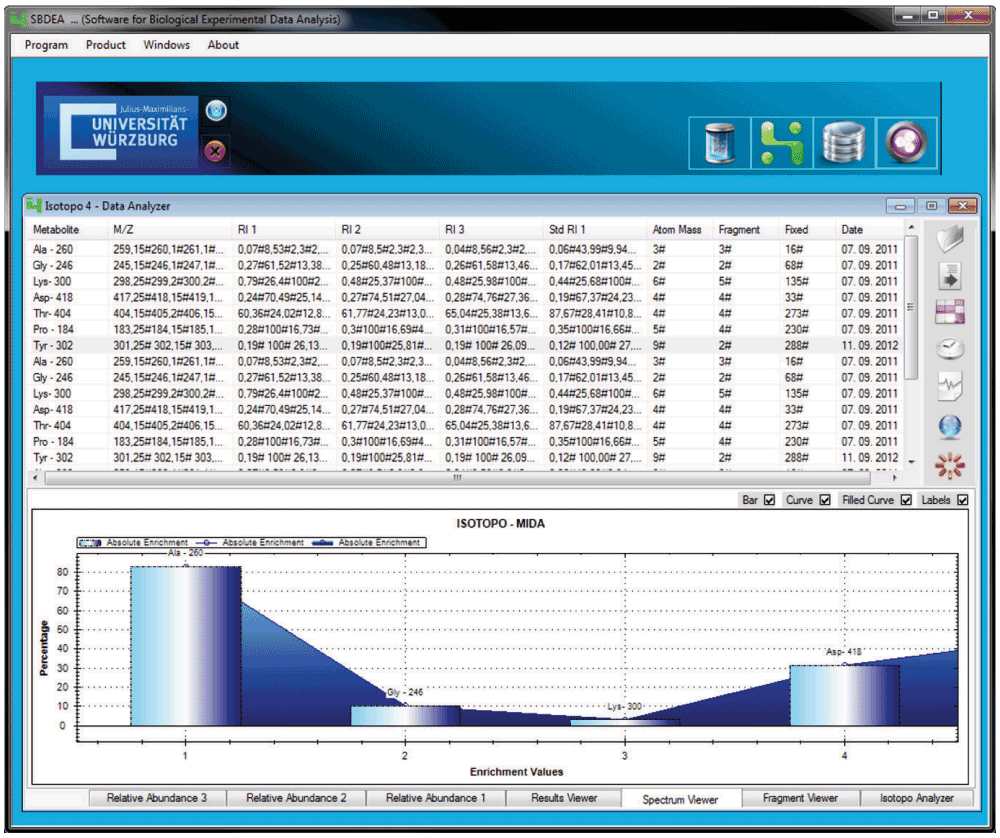
Figure 11. Isotopo Data Analyzer’s main graphical user interface.
Scientific software solution towards bioinformatics and biochemistry, with the ability of performing quantitative mass spectrometry to mixtures of materials labeled with stable isotopes. It provides internal database management system, third party independent file based experimental data management system and intelligent data format parser for data extraction and conversion of different data formats. (http://spp1316.uni-wuerzburg.de/bioinformatics/isotopo/).
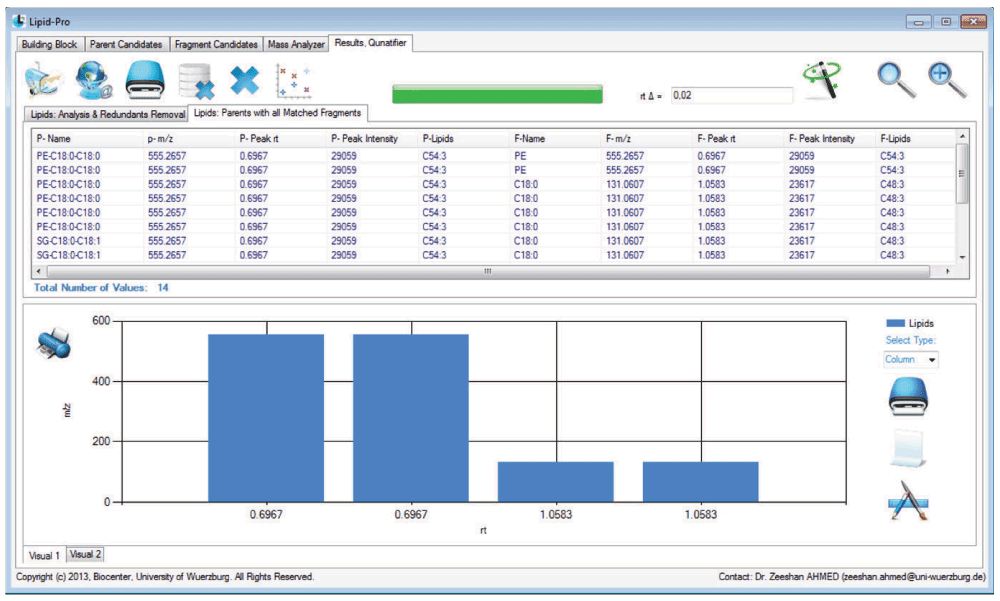
Lipid-Pro (Figure 12) is an unpublished scientific software (paper is in writing), a computational solution towards lipids and pharmaceutical biology, estimating fragment candidates, pre-parent candidates and most importantly lipids (Department of Pharmaceutical Biology, Biocenter, University of Wuerzburg, Germany). It implements a chain of mathematical operations and experimental data extraction processes. Along with the efficient third party independent data management system, it provides different graphical interfaces for individual and integrated intelligent operations.
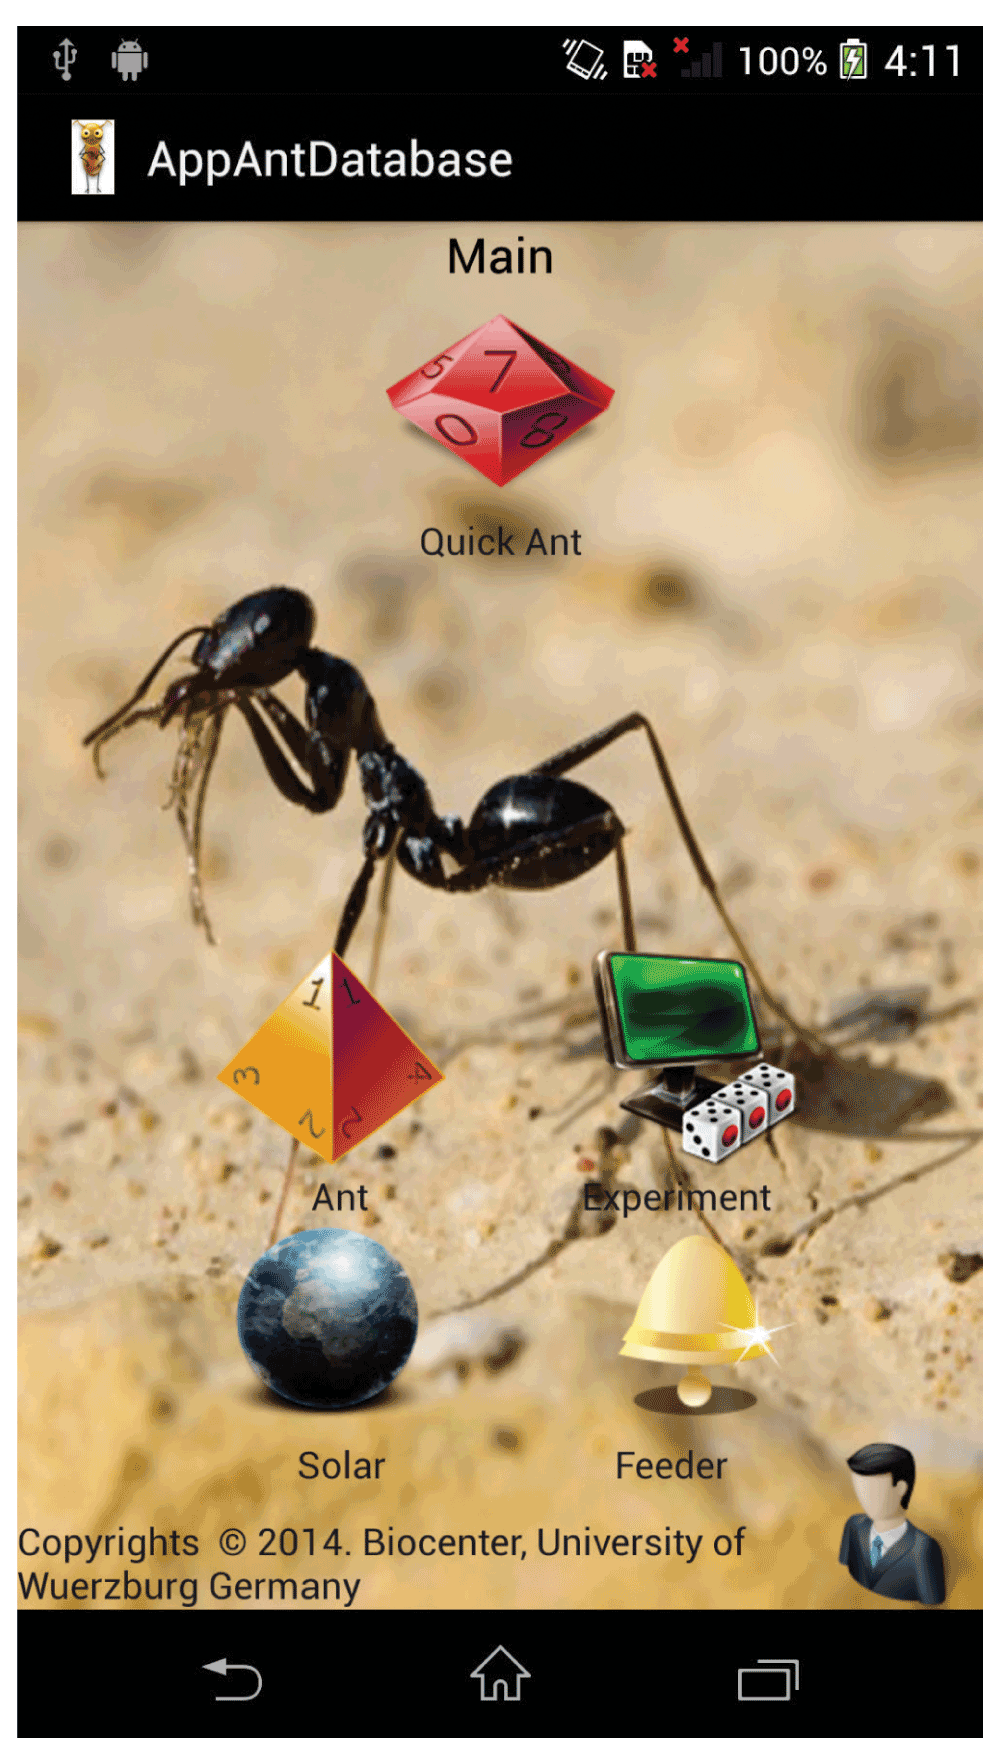
App Ant Database (Figure 13) is an unpublished scientific software (paper is currently in writing), featuring a distributed and embedded database system in the form of a smart phone, tablet and desktop application towards the rotating channel experiment data management during experimentation on desert ants (Department of Behavioral Physiology and Sociobiology, Biocenter, University of Wuerzburg, Germany). It is unique and the first bioinformatics smart phone application to be used in desert ant rotating channel experiments. After extensive requirement engineering, we established an extremely easy to use graphical interface. Furthermore, after studying the user requirements in monitoring desert ant movement and orientation in the desert, the application not only automatically records ant movements, but also estimates and calculates automatically all additional variables required for the project such as azimuth, solar time, equation of the time, time offset, hour angle, altitude, sunrise, sunset and solar noon using astronomical algorithms, recommended by the National Oceanic and Atmospheric Administration (NOAA).
Regardless of the individual specifications, development details, technologies used and usage perspectives, the key principles of the Butterfly model were applied in the design of these software solutions. Although the requirements for each of these were not fixed in the beginning, comprehensive requirements gathering and analysis operations were performed using brain storming and interviewing methods. Based on filtered out the functional requirements, the most suitable SDLCs (V-Model54 and Spiral55) were applied and the software applications were designed using UML (including use cases, class diagrams, sequence diagrams, work flows, activity flows, components diagrams, data flow diagrams etc.). Of those SDLC’s used in scientific software solution development, the Spiral Model proved most helpful and best suited due to its four main pillars: determine objectives, identify and resolve risk, development and test, and plan the next iteration. Another advantage of the spiral model is its risk driven approach, incorporating many useful features and refinements of other software development life cycle models54,72.
Using the HCI design patterns and principles, the graphical user interfaces of all these applications were designed considering the psychology, scientific and informatics backgrounds of the end users and the deployment environments.
All these applications are easy to deploy and use. We found that users did not require training to install, run and use the applications. As scientific research is a never ending process, these applications are still in development and will be continuously improved with respect to the methods, features, performance and technologies.
Comparing bioinformatics tools
We have performed a short comparative analysis of some bioinformatics software applications (C1375, Metatool76, BioOpt77, FiatFlux78 ReMatch79, Biolayout80, LS-MIDA69,70, DroLIGHT71–73, Isotopo74), describing their type, methodology, implementation, user friendliness, configuration etc., based on the provided, published information (Table 2).
Table 2. Comparative analysis of different scientific software applications.
SSE=Scientific Software Application; App.=Application; DB=Database; DM=Data Management; Sys.=System; SDLC=Software Development Life Cycle.
Applications/
Comparative
Measures | C13 | Metatool | BioOpt | Fiatlux | ReMatch | Biolayout | LS-MIDA | Dro-LIGHT | Isotopo |
|---|
|
SSE?
| Yes | Yes | Yes | Yes | Yes | Yes | Yes | Yes | Yes |
|
App. Type
| Desktop | Desktop | Desktop | Desktop | Web | Desktop | Desktop | Desktop | Desktop |
Data
Management
| No DM
Sys. | No DM
Sys. | No DM
Sys. | No DM
Sys. | DB | No DM
Sys. | File based | File based | File based
and DB |
Script or
Prototype
| Script | Script | Prototype | Script | Prototype | Prototype | Prototype | Prototype | Prototype |
Algorithm
Type
| Parallel | Sequential | Sequential | Parallel | Sequential | Parallel | Sequential | Parallel | Sequential |
Algorithm/
Methodology
| Isotopic
Labelling | Schuster
Algorithm | Mass
Balance
Equation | Isotopic
Labelling | Carbon
Mapping | Markov
Clustering | Least Square | Circadian
Rhythms | Partial Least
Square |
Running
Mode
| Interactive | Interactive | Batch | Interactive | Interactive | Interactive | Interactive | Interactive | Interactive |
Publishing,
licensing
| Published,
Free | Published,
Free | Published,
Free | Published,
Free | Published,
Free | Published,
Free | Published,
Free | Published,
Free | Published,
Free |
SDLC
Information
| Not
Provided | Not
Provided | Not
Provided | Not
Provided | Not
Provided | Not
Provided | V-Model | Spiral | V-Model |
HCI
Information
| Not
Provided | Not
Provided | Not
Provided | Not
Provided | Not
Provided | Not
Provided | HCI Patterns
Implemented | HCI Patterns
Implemented | HCI Patterns
Implemented |
|
User Friendly
| No | No | No | No | Yes | Yes | Yes | Yes | Yes |
Easy to
configure
| No | No | No | No | Yes | Yes | Yes | Yes | Yes |
|
Easy to train
| No | No | No | No | No | No | Yes | Yes | Yes |
Software
Re-Engineering
| Yes | No | Yes | Yes | Yes | No | Yes | No | No |
Cyclic or
Repetitive
| No | No | Yes | Yes | Yes | No | Yes | No | Yes |
Easy to learn
and Use
| Yes | Yes | No | No | Yes | No | Yes | Yes | Yes |
|
User Training
| No | No | No | No | No | No | No | Yes | No |
For our comparison, we chose software applications from fields we are familiar with, yet tried to cover a broad range of different applications and compared Metabolic Flux Analysis (MFA) as well as software metabolic network analysis81,82, Mass Isotopomers Distribution Analysis (MIDA) including GC-MS data analysis69,70, and neurobiology applications for behavioral analysis of insects such as desert ants and fly71–73.
We used the following parameters to classify the chosen bioinformatics software application: SSE type, data management, script or prototype, algorithm type, algorithm/methodology, running mode, publishing, licensing, SDLC information, HCI information, user friendly, easy to configure, easy to train, software re-engineering, cyclic or repetitive, easy to learn and use user training.
From the observed results (Table 2) we conclude that almost all of the applications have good implementations of their methodology (algorithms etc.) but often lack in usage point of views (user interface, documentation etc.), or long term sustainable development of the software (at least regarding the organization of future further developments). These shortcomings are prevented when following the “Butterfly” paradigm.
Conclusions
In the earlier sections of this paper we presented the concepts of usage of the existing scientific software solution design, modeling, implementation, testing and deployment. This helps in resolving conflicts and highlighting valuable differences between the traditional (professional) and scientific applications. This paper also proposes a new approach towards user friendly scientific software solution development, with emphases on the use of proper SDLC, HCI and technologies. The successful implementation of the five applications discussed strongly validates the potential of the Butterfly model.
In conclusion, although the adaptation of SSE principles to the Butterfly model may seem to increase developmental work load in comparison to the current running programming method applications, the Butterfly model will ultimately reduce the work by making the scientific application well designed, flexible, structured, reusable, developed according to a product line, as well as analytical and of high quality. According to its design, the software developed using the Butterfly paradigm is user friendly, easy to learn and deploy.
Author contributions
Zeeshan Ahmed has proposed the model Butterfly, and initiated the topic of discussion. Saman Zeeshan assisted Zeeshan Ahmed and Thomas Dandekar guided the study.
All authors participated in writing the manuscript.
Competing interests
The authors declare no conflict of interest.
Grant information
Funding was provided by the German Research Foundation (DFG), collaborative research center SFB 1047 "Insect timing", Project Z, to Zeeshan Ahmed. Thomas Dandekar and Saman Zeeshan were supported by the German Research Foundation (DFG), TR 34/Z.
The funders had no role in study design, data collection and analysis, decision to publish, or preparation of the manuscript.
Acknowledgements
We would like to thank all our interested colleagues for critical community input on the “Butterfly” approach.
We would like to thank Deutsche Forschungsgemeinschaft (DFG) for funding and University of Wuerzburg Germany for the support.
We thank two anonymous reviewers for helpful comments on the manuscript and the Land of Bavaria Germany.
Faculty Opinions recommendedReferences
- 1.
de Champeaux D, Constantine L, Jacobson I, et al.:
Structured analysis and object oriented analysis. In OOPSLA/ECOOP '90 Proceedings of the European conference on object-oriented programming on Object-oriented programming systems, languages, and applications. 1990. Reference Source
- 2.
Abrahamsson P, Salo O, Ronkainen J, et al.:
Agile software development methods - Review and analysis.
VTT Pub.
2002; 478. Reference Source
- 3.
Manyika J, Chui M, Brown B, et al.:
Big data: The next frontier for innovation, competition, and productivity.
McKinsey Global Institute.
2011. Reference Source
- 4.
Sergio C, Luciano F, Massimo B:
Software Interoperability in consequence assessment: results of a feasibility study.
Chem Eng Trans.
2010; 19: 341–346. Publisher Full Text
- 5.
Belhajjame K, Wolstencroft K, Corcho O, et al.:
Metadata Management in the Taverna Workflow System.
In IEEE International Symposium on Cluster Computing and the Grid.
2008. Publisher Full Text
- 6.
Penn State, Eberly College of Science. Galaxy DNA-analysis software is now available 'in the cloud'. ScienceDaily, Online 15 November 2011. Reference Source
- 7.
Pabinger S, Dander A, Fischer M, et al.:
A survey of tools for variant analysis of next-generation genome sequencing data.
Brief Bioinform.
First published online: January 21, 2013. PubMed Abstract
| Publisher Full Text
- 8.
Magrane M, Consortium U:
UniProt Knowledgebase: a hub of integrated protein data.
Database (Oxford).
2011: 2011; bar009. PubMed Abstract
| Publisher Full Text
| Free Full Text
- 9.
Boehm B:
Software Engineering.
IEEE Trans On Computers.
1976; 25(12): 1226–1242. Publisher Full Text
- 10.
Rook P:
Controlling software projects.
Software Engin J.
1986; 1(1): 7–16. Publisher Full Text
- 11.
Mahmood S, Lai R:
RE-UML: A Component-Based System Requirements Analysis Language.
Comput J.
2013; 56(7): 901–922. Publisher Full Text
- 12.
Szyperski C, Gruntz D, Murer S:
Component Software: Beyond Object-Oriented Programming.
Addison-Wesley.
2002. Reference Source
- 13.
Benediktsson O, Dalcher D, Thorbergsson H:
Comparison of software development life cycles: a multiproject experiment.
IEE Proceedings – Software.
2006; 153(3): 87–101. Publisher Full Text
- 14.
Munassar NMA, Govardhan A:
A Comparison Between Five Models Of Software Engineering.
Int Jr Comp Sci.
2010; 7(5): 94–101. Reference Source
- 15.
Ahmed Z:
Towards Performance Measurement and Metrics based Analysis of PLA Applications.
Int J Software Engin App.
2010; 1(3): 66–80. Publisher Full Text
- 16.
Ahmed Z, Majeed S:
Measurement, Analysis with Visualization for better Reliability. In Artificial Intelligence and Hybrid Systems. C. Rocha, F. Akune, A. El-Shafie, iConcept Press, 2013. Reference Source
- 17.
Ahmed Z, Majeed S:
Towards Increase in Quality by Preprocessed Source Code and Measurement Analysis of Software Applications.
IST Tran Inf Tech Theo App.
2010; 1(2): 8–13. Reference Source
- 18.
Ahmed Z:
Measurement Analysis and Fault Proneness Indication in Product Line Applications (PLA). In Sixth International Conference on New Software Methodologies, Tools, and Techniques. Italy, 2007; 391–400. Reference Source
- 19.
Ahmed Z:
Integration of variants handling in M-system NT. M.S. thesis, Blekinge Institute of Technology, Karlskrona, Sweden. 2006; 65. Reference Source
- 20.
Lee J, Xue NL:
Analyzing user requirements by use cases: a goal-driven approach.
IEEE Softw.
1999; 16(4): 92–101. Publisher Full Text
- 21.
Sommerville I:
Integrated requirements engineering: a Tutorial.
IEEE Softw.
2005; 22(1): 16–23. Publisher Full Text
- 22.
van Lamsweerde A, Darimont R, Letier E:
Managing conflicts in goal-driven requirements engineering.
IEEE Trans Softw Eng.
1998; 24(11): 908–926. Publisher Full Text
- 23.
Kaur H, Singh P:
UML (Unified Modeling Language): Standard Language for Software Architecture Development. In International Symposium on Computing, Communication, and Control. Singapore, 2011. Reference Source
- 24.
Garlan D, Shaw M:
An introduction to software architecture. In Advances in Software Engineering and Knowledge Engineering. V. Ambriola and G. Tortora: World Scientific Publishing Company, 1993; 2: 1–39. Reference Source
- 25.
Garlan D:
Formal Approaches to Software Architecture. In Workshop on Studies of Software Design, UK 1993; 64–76. Reference Source
- 26.
Garlan D, Notkin D:
Formalizing design spaces: Implicit invocation mechanisms. In 4th International Symposium of VDM Europe on Formal Software Development, UK 1991; 31–44. Reference Source
- 27.
Dashofy EM, Hoek A, Taylor RN:
An infrastructure for the rapid development of XML-based architecture description languages. In Twenty Fourth International Conference on Software Engineering, USA. 2002; 266–276. Publisher Full Text
- 28.
Egyed A, Kruchten PB:
Rose/Architect: A Tool to Visualize Architecture. In Thirty Second Annual Hawaii Conference on Systems Sciences USA. 1999; 8: 8066. Reference Source
- 29.
Booch G, Rumbaugh J, Jacobson I:
Unified Modeling Language User Guide, the (2nd Edition).
Addison-Wesley Professional.
2005. Reference Source
- 30.
Jacobson I, Christerson M, Jonsson P, et al.:
Object-Oriented Software Engineering: A Use Case Driven Approach. Reading, MA: Addison-Wesley, 1992. Reference Source
- 31.
Dumas M, ter-Hofstede AHM:
UML Activity Diagrams as a Workflow Specification Language. In Fourth International Conference on The Unified Modeling Language, Modeling Languages. Concepts, and Tools, UK 2001; 2185: 76–90. Publisher Full Text
- 32.
Bruza PD, van-der-Weide TP:
The Semantics of Data Flow Diagrams. In International Conference on Management of Data. 1993. Reference Source
- 33.
Latronico E, Koopman P:
Representing Embedded System Sequence Diagrams as a Formal Language. In Fourth International Conference on The Unified Modeling Language. Canada, 2001; 2185: 302–316. Publisher Full Text
- 34.
Marilyn B:
A guide for programmers. Prentice-Hall, 1978. Reference Source
- 35.
Berardi D, Calvanese D, Giacomo GE:
Reasoning on UML class diagrams.
Artif Intell.
2005; 168(1–2): 70–118. Publisher Full Text
- 36.
Haney FM:
Module connection analysis: a tool for scheduling of software debugging activities.
Proceedings of Fall Joint Computer Conference.
1972; 173–179. Publisher Full Text
- 37.
Moreton R:
A Process Model for Software Maintenance.
Journal Information Technology.
1990; 5: 100–104. Publisher Full Text
- 38.
Kan SH, Basili VR, Shapiro LN:
Software Quality: An overview from the perspective of total quality management.
IBM Systems Journal.
1994; 33(1). Reference Source
- 39.
Li W, Henry S:
An Empirical Study of Maintenance Activities in Two Object-oriented Systems.
Journal of Software Maintenance, Research and Practice.
1995; 7(2): 131–147. Publisher Full Text
- 40.
Pfleeger SL, Bohner SA:
A Framework for Software Maintenance Metrics.
IEEE Transactions on Software Engineering.
1990; 320–327. Publisher Full Text
- 41.
Moreton R:
A Process Model for Software Maintenance.
Journal Information Technology.
1990; 5: 100–104. Publisher Full Text
- 42.
Soong NL:
A program stability measure.
In Proceedings of Annual ACM conference.
Boulder Colorado, 1977; 163–173. Reference Source
- 43.
Yau SS, Collofello JS, McGregor TM:
Ripple effect analysis of software maintenance.
In Proceedings COMPSAC '78.
1978; 60–65. Reference Source
- 44.
Black S:
Automating ripple effect measurement. In 5th World Multiconference on Systemics, Cybernetics and Informatics, Florida, USA. 2001. Reference Source
- 45.
Davis A:
Software Requirements: Analysis and Specification.
Prentice-Hall.
New Jersey, 1989. Reference Source
- 46.
Martin J, McClure C:
Software Maintenance: The Problem and its Solutions.
Prentice-Hall.
London, 1983. Reference Source
- 47.
Parikh G: Some Tips, Techniques and Guidelines for Program and System Maintenance.
Winthrup Publishers, Cambridge, Mass.
1982; 65–70. Reference Source
- 48.
Sharpley WK:
Software Maintenance Planning for Embedded Computer Systems. In
Proceedings of the IEEE COMPSAC.
1977; 520–526. Reference Source
- 49.
Osborne WM:
Building and Sustaining Software Maintainability. In
Proceedings of Conference on Software Maintenance.
1987; 13–23. Reference Source
- 50.
Yau SS, Collofello JS:
Some Stability Measures for Software Maintenance.
IEEE Trans On Software Engineering.
1980; 6(6): 545–552. Publisher Full Text
- 51.
Jaffe MS, Leveson NG, Heimdahl MPE, et al.:
Software requirements analysis for real-time process-control systems.
IEEE Transactions on Software Engineering.
1991; 17(3): 241–258. Publisher Full Text
- 52.
Chikofsky EJ, Cross JH:
Reverse Engineering and Design Recovery: A Taxonomy.
IEEE Soft.
1990; 7(1): 13–17. Publisher Full Text
- 53.
Petersen K, Wohlin C, Baca D:
The Waterfall Model in Large-Scale Development.
Product-Focused Software Process Improvement, Lecture Notes in Business Information Processing.
2009; 32: 386–400. Publisher Full Text
- 54.
Rook P:
Controlling software projects.
Softw Eng J.
1986; 1: 7–16. Publisher Full Text
- 55.
Boehm BW:
A spiral model of software development and enhancement.
Computer.
1988; 21(5): 61–72. Publisher Full Text
- 56.
Larman C, Basili VR:
Iterative and Incremental Development: A Brief History.
Computer.
2003; 36(6): 47–56. Publisher Full Text
- 57.
Hull C, Feygin M, Baron Y, et al.:
Rapid prototyping: current technology and future potential.
Rapid Prototyping Journal.
1995; 1(1): 11–19. Publisher Full Text
- 58.
Ambler S:
Agile Modeling: Effective Practices for eXtreme Programming and the Unified Process.
Wiley Computer Publishing.
2002. Reference Source
- 59.
Cheriet H, Bounour N:
Software evolution: Models and challenges. In International Conference on Machine and Web Intelligence (ICMWI), 2010; 479–481. Publisher Full Text
- 60.
Pei Y, Wei Y, Furia CA, et al.:
Code-Based Automated Program Fixing.
In 26th IEEE/ACM International Conference on Automated Software Engineering (ASE).
2011; 392–395. Publisher Full Text
- 61.
William K:
A simple guide to five normal forms in relational database theory.
Commun ACM.
1983; 26(2): 120–125. Publisher Full Text
- 62.
Codd EF:
Normalized data base structure: A brief tutorial. In ACM SIG-FIDET Workshop on Data Description, Access and Control, San Diego, 1971; 1–17. Publisher Full Text
- 63.
Codd EF:
Further normalization of the data base relational model.
IBM Res Rep.
1971; RJ909. Reference Source
- 64.
Fagin R:
Multivalued dependencies and a new normal form for relational databases.
ACM Trans on Database Sys.
1977; 2(3): 262–278. Publisher Full Text
- 65.
Fagin R:
Normal forms and relational database operators. In ACM SIGMOD International Conference on Management of Data, USA. 1979; 153–160. Publisher Full Text
- 66.
Ahmed Z, Ganti SK, Kyhlbäck H:
Design Artifact’s, Design Principles, Problems, Goals and Importance.
In Fourth International Conference of Statistical Sciences,
Pakistan. 2008; 15: 57–68. Reference Source
- 67.
Ahmed Z:
Designing Flexible GUI to Increase the Acceptance Rate of Product Data Management Systems in Industry.
Int J Comp Sci Emerg Tech.
2011; 2(1): 100–109. Reference Source
- 68.
Klemmer SR, Lee B:
Notebooks that Share and Walls that Remember: Electronic Capture of Design Education Artifacts. In ACM Symposium on User Interface Software and Technology. 2005. Reference Source
- 69.
Ahmed Z, Zeeshan S, Huber C, et al.:
Software LS-MIDA for efficient mass isotopomer distribution analysis in metabolic modelling.
BMC Bioinformatics.
2013; 14: 218. PubMed Abstract
| Publisher Full Text
| Free Full Text
- 70.
Ahmed Z, Majeed S, Dandekar T:
Unified Modeling and HCI Mockup Designing towards MIDA.
Int Jr Emerg Sci.
2012; 2(3): 361–382. Reference Source
- 71.
Ahmed Z, Helfrich-Förster C, Dandekar T:
Integrating Formal UML Designs and HCI Patterns with Spiral SDLC in DroLIGHT Implementation.
Rec Pat Comp Sci.
2013; 6(2): 85–98. Publisher Full Text
- 72.
Ahmed Z, Helfrich-Förster C:
DroLIGHT: Real Time Embedded System towards Endogenous Clock Synchronization of Drosophila.
Front Neuroinform Conference Abstract: Neuroinformatics.
2013. Publisher Full Text
- 73.
Ahmed Z, Helfrich-Förster C:
DroLIGHT-2: Real Time Embedded and Data Management System for Synchronizing Circadian Clock to the Light-Dark Cycles.
Rec Pat Comp Sci.
2013; 6(3): 191–205. Publisher Full Text
- 74.
Ahmed Z, Majeed S, Dandekar T:
Formal UML Modelling of Isotopo, Bioinformatical Software for Mass Isotopomers Distribution Analysis.
Software Engin.
2012; 2: 147–159. Publisher Full Text
- 75.
Wiechert W, de Graaf AA:
Bidirectional reaction steps in metabolic networks: I. Modeling and simulation of carbon isotope labeling experiments.
Biotechnol Bioeng.
1997; 55(1): 101–117. PubMed Abstract
| Publisher Full Text
- 76.
Schuster R, Schuster S:
Refined algorithm and computer program for calculating all non-negative fluxes admissible in steady states of biochemical reaction systems with or without some flux rates fixed.
Comput Appl Biosci.
1993; 9(1): 79–85. PubMed Abstract
| Publisher Full Text
- 77.
Cvijovic M, Olivares-Hernández R, Agren R, et al.:
BioMet Toolbox: genome-wide analysis of metabolism.
Nucleic Acids Res.
2010; 38(Web Server issue): 144–149. PubMed Abstract
| Publisher Full Text
| Free Full Text
- 78.
Zamboni N, Fischer E, Sauer U:
FiatFlux - a software for metabolic flux analysis from 13C-glucose experiments.
BMC Bioinformatics.
2005; 6: 209. PubMed Abstract
| Publisher Full Text
| Free Full Text
- 79.
Pitkänen E, Akerlund A, Rantanen A, et al.:
ReMatch: a web-based tool to construct, store and share stoichiometric metabolic models with carbon maps for metabolic flux analysis.
J Integr Bioinformatics.
2008; 5(2): 1–13. PubMed Abstract
| Publisher Full Text
- 80.
Klamt S, von Kamp A:
An application programming interface for CellNetAnalyzer.
Biosystems.
2011; 105(2): 162–168. PubMed Abstract
| Publisher Full Text
- 81.
Ahmed Z, Majeed S, Dandekar T:
Computational Feature Performance and Domain Specific Architecture Evaluation of Software Applications Towards Metabolic Flux Analysis.
Rec Pat Comp Sci.
2012; 5(3): 165–176. Publisher Full Text
- 82.
Dandekar T, Fieselmann A, Majeed S, et al.:
Software applications toward quantitative metabolic flux analysis and modeling.
Brief Bioinform.
2014; 15(1): 91–107. PubMed Abstract
| Publisher Full Text
Comments on this article Comments (0)