Keywords
bottom-up proteomics, Amicon, eFASP/FASP, biomarker, MEG-01, sample preparation, tandem mass spectrometry, in-solution digestion
bottom-up proteomics, Amicon, eFASP/FASP, biomarker, MEG-01, sample preparation, tandem mass spectrometry, in-solution digestion
We added two references (Tang et al. [2008], and Serang and Noble [2012]) that provide an in-depth explanation of the principles underlying the False Discovery Rate (FDR) analysis of protein identification, as well as a review of the different statistical methods for protein identification. These references clarify the ambiguity related to the proteins listed as identified with “0 peptide”, which are, in fact, included in the false discovery rate inherent to our analysis. We have also re-organized our datasets according to the reviewer’s comments.
See the authors' detailed response to the review by Lloyd D. Fricker
Proteomics plays an increasingly greater role in diverse clinical settings provided that proteins give an integrative picture of patients’ phenotype and an accurate representation of changes in the status of an organism1. As such, intense efforts are now directed toward proteomics-based biomarker discovery, disease screening, and medical diagnosis2. Accuracy and reliability of bottom-up mass spectrometry (MS)-based proteomics analyses are undoubtedly dependent on the quality of prior sample preparation, which remains very challenging3. In fact, sodium dodecyl sulfate (SDS) is a powerful anionic detergent and one of the most widely used reagents for solubilisation and denaturation of proteins4. By binding amino acids through hydrophobic and ionic interactions, SDS alters proteins’ spatial conformational structure and inhibits proteases activity, thus enabling long-term conservation of structurally preserved proteins5. In spite of all its advantages, SDS significantly suppresses analyte ion signals in electrospray ionization (ESI)-MS, alters the chromatographic separation of peptides during liquid chromatography (LC)4,6, and strongly inhibits trypsin activity7, even at very low concentrations, which considerably limits protein identification. Samples therefore require to be completely depleted of SDS prior to digestion and liquid chromatography-tandem mass spectrometry (LC-MS/MS) analysis. However, removing SDS while achieving a high recovery rate is a challenging task and several approaches have been proposed over the years. Methods such as gel electrophoresis separation along with in-gel digestion, protein precipitation and dialysis have shown variable efficacy, low reproducibility and limited routine applicability. Among the different protein preparation techniques recently developed, spin filter-based sample preparation, a concept first introduced by Manza et al.8 and further optimized for better detergent removal by Wisniewski et al.9 – Filter-Aided Sample Preparation (FASP) –, emerged as a promising approach and has already been successfully applied in diverse experimental settings9–12. In fact, FASP is among the simplest sample preparation methods for SDS-containing extracts. Operating in an ultrafiltration spin filter device, the method allows samples to be cleaned of SDS with urea prior to on-filter tryptic digestion13. Moreover, urea enables usage of filter membrane with a molecular weight cut-off of 30 kDa (30k MWCO), while not compromising depth of proteome coverage, as it ensures unfolding of proteins during the workflow14. FASP is also described as a universal sample preparation method as it allows for unbiased proteome representation.
During past years, some groups have raised concerns regarding the depth of proteome coverage achieved with FASP15–20. Furthermore, there exist great disparities in the quality of outcomes when comparing FASP to other protocols depending on the authors and also as noted in practice by laboratories attempting to use FASP. Actually, Liebler and Ham21 first pointed out the difficulty of removing SDS by filter-aided buffer exchange, an observation further supported by Hustoft et al.16. The uncharged chaotrope urea may in fact have a limited capacity to deplete SDS from proteins as it may not completely dissociate negatively charged sulfate heads from basic amino acids. Disruption of these powerful ionic interactions may in fact require substitution of SDS by another anionic surfactant, such as sodium deoxycholate (NaDoc). Moreover, Proc et al.22 have shown that NaDoc was the most effective detergent to deepen proteome coverage and enhance digestion reproducibility when included in the digestion buffer. As long as its concentration remains below 1%, NaDoc promotes trypsin activity by easing contact between enzyme and cleavage sites23–26. This acid-insoluble surfactant is also MS-compatible as it is readily removed following acidification by either precipitation or phase transfer in organic solvent such as ethyl acetate24,25. Among the other factors possibly explaining the difficulties reported with FASP is the on-filter digestion, as it may have a more limited efficacy compared to the traditional in-solution approach27,28. These issues emphasize the need to fine-tune the FASP protocol with current state-of-the-art techniques in comprehensive proteomics in order to improve its robustness and reliability. As such, Erde et al. (2014) have recently proposed an enhanced FASP (eFASP) workflow to improve proteome coverage of SDS-solubilized protein samples18. This protocol, which is currently the only other equivalent alternative to FASP for preparing SDS-denatured proteins, incorporates a passivation step of the Microcon filter device, deoxycholic acid-based buffer exchanges, and a post-digestion phase transfer cleaning of peptides prior to LC-MS/MS analysis. These modifications led to a significant 14-fold increase in proteome coverage as compared to FASP18. Although the FASP was designed for use with the flat bottom filter Microcon device (EMD Millipore), several laboratories instead use the Amicon unit with V-shaped oriented filters (EMD Millipore)15,16,19,29. Difference between filters may in part explain why Nel et al. (2015) failed to show a significant difference in proteome coverage between eFASP and FASP while using Amicon devices29. In light of the striking discrepancy of proteome coverage between these two studies, an enhanced FASP workflow specifically tailored for Amicon filters was required in order to allow more laboratories to benefit from FASP advantages and ease-of-use in proteomics.
Herein, we report a reproducible Amicon-adapted enhanced FASP (eFASP) workflow for comprehensive proteomics that is based on the best practices in sample preparation of SDS-containing protein extracts. The Amicon-adapted eFASP method presents key modifications to the FASP protocol and addresses the above-raised concerns. We compared both methods for SDS removal efficacy, depth of proteome coverage and reproducibility. Our results show that Amicon-adapted eFASP compares favourably to FASP and can therefore be regarded as a new alternative sample preparation approach for proteomics.
Ammonium bicarbonate (ABC), 3-[(3-Cholamidopropyl)dimethylammonio]-1-propanesulfonate hydrate (CHAPS), ethyl acetate, iodoacetamide, methanol, brilliant blue R250, phenylmethanesulfonyl fluoride (PMSF), potassium chloride (KCl), sodium chloride (NaCl), sodium deoxycholate (NaDoc), sodium dodecyl sulfate (SDS), stains-all, trizma base and urea were purchased from Sigma-Aldrich (St. Louis, MO) and were of the highest quality available. DL-Dithiothreitol (DTT), formamide, isopropanol, sodium hydroxide (NaOH), thiourea and Tween-20 were obtained from Thermo Fisher BioReagents (Ottawa, ON). OptimaTM LC/MS grade formic acid (FA) and water were obtained from Thermo Fisher chemicals (Ottawa, ON). Unless indicated, all other chemicals were from Sigma-Aldrich (St. Louis, MO) and minimally of ACS grade. RPMI-1640 (#350–007-CL), heat-inactivated fetal bovine serum (FBS), L-glutamine and penicillin/streptomycin were obtained from Wisent Bioproducts (St-Bruno, QC). Amicon Ultra-0.5 ml centrifugal filters of 30 kDa (#UFC503096) and 10 kDa (#UFC501096) molecular weight cutoff (MWCO) were obtained from EMD Millipore Corporation (Billerica, MA). Trypsin Gold (#V5280) and Trypsin/Lys-C Mix (#V5073), both of Mass Spectrometry Grade, were from Promega (Madison, WI). BCA protein assay kit (#23227) and NanoDrop 2000c (#ND-2000c) were purchased from Thermo Scientific Pierce (Rockford, IL). Eppendorf Protein LoBind tubes were from Eppendorf (Hamburg, Germany).
MEG-01 cells (CRL-2021, ATCC, Manassas, VA) were grown (37°C/5% CO2) in a medium containing 90% RPMI-1640, 10% FBS, 2 mM L-glutamine, 100 U/ml penicillin and 100 µg/ml streptomycin. Adherent cells were scraped into the medium and the resulting suspension was centrifuged at 430 g (5 min/4°C) for pelleting cells. Ice-cold 0.9% NaCl-resuspended cells were again pelleted by centrifugation. Cells were then lysed with a buffer consisting of 2% SDS, 0.1 M Tris-HCl pH 8 and 10 mM DTT, and heated for 7 min at 98°C. Nucleic acids were sheared by probe sonication (Misonix Sonicator 3000, Cole-Parmer, Hills, IL). Unbroken cells and debris were cleared by centrifugation at 16,000 g for 10 min. Sonication and centrifugation were repeated once. The final supernatant was carefully withdrawn, transferred in a LoBind tube and its protein concentration quantified by bicinchoninic acid (BCA) protein assay according to manufacturer’s instructions. “Non-SDS” control lysates were prepared with a buffer containing 7 M urea, 2 M thiourea, 4% CHAPS, 1% DTT and 0.5 mM PMSF. Lysates were centrifuged at 16,000 g for 20 min (4°C). Supernatants were removed and transferred in LoBind tubes. Disulphide bridges were reduced following a 1h incubation at 37°C and protein concentration quantified by the BCA protein assay.
Impact of increasing SDS concentrations (0.01% to 0.30% w/v) on trypsin (FASP) and one-step trypsin/Lys-C (Amicon-adapted eFASP) overnight digestion completion was assessed by Coomassie-stained 12% and 18% SDS-polyacrylamide gel electrophoresis (PAGE). SDS-free cell lysates were prepared by probe sonication of 50 mM ABC-resuspended MEG-01 pellet followed by 16,000 g centrifugation (10 min). Sonication and centrifugation were repeated once on collected supernatant. Lysates were solubilized in 6 M urea, reduced for 60 min at 37°C with 10 mM DTT and alkylated by 30 mM iodoacetamide for 30 min. One hundred-microgram whole cell lysate aliquots were next diluted six-fold in ABC buffer and digested in increasing concentrations of SDS5. Half of samples were afterward incubated for 12h at 37°C in the presence of (1) trypsin (enzyme-to-protein ratio 1:100 w/w) or (2) trypsin/Lys-C Mix (ratio 1:25 w/w) for proteolysis. Digested samples were next mixed with SDS loading buffer, heated and half the volume loaded onto a 12% SDS-PAGE while the other half was loaded on an 18% SDS-PAGE. Gels were subsequently stained for 3h in a Coomassie solution and scanned with an Odyssey® Infrared Imaging System (LI-COR Biosciences, Lincoln, NE).
The SDS concentration was measured according to Rusconi et al.30 by recording the absorbance (438 nm) (Ultrospec 2100 pro, Biochrom, Holliston, MA) of a stains-all dosage solution mixed with 1 µl of sample (Supplementary Table 1). To assess the assay’s specificity, we performed interference studies with all solutions and SDS-free biological samples used in FASP and Amicon-adapted eFASP protocols. The complete list of tested compounds is presented in Supplementary Table 2.
Refer to Figure 1 for a detailed study flowchart (see also Supplementary Table 3).

A total of two FASP and eight Amicon-adapted eFASP protocols were compared on the basis of several performance characteristics. Apart from the purification protocol itself, protocols differed in regard to the type of filter unit used, the passivation of filter device, the enzymatic digestion and following cleanup. n=3 for FASP and Amicon-adapted eFASP without passivation; n=2 for Amicon-adapted eFASP with passivation.
Prior to protein purification, every non-passivated filter unit has been thoroughly rinsed following manufacturer’s instructions. A first cleaning spin (14,000 g/15 min [30k]/25 min [10k]) with 0.05 M NaOH was followed by a final spin with 500 µl of MS-grade H2O.
Thirty-microliter aliquots (150 µg proteins) of MEG-01 total extract were purified by the FASP protocol9. Aliquots were either dispensed to prerinsed Amicon Ultra-0.5 ml 10k filters (A10k) or Amicon Ultra-0.5 ml 30k filters (A30k). Every experiment was performed in triplicate (n=3). The FASP protocol was followed exactly as described by Wisniewski et al.9. Briefly, samples were washed twice with 200 µl of 8 M urea in 0.1 M Tris-HCl pH 8.5 and spun at 14,000 g for 15 min (30k) or 30 min (10k). Flow-through was discarded from collection tube and 100 µl of 50 mM iodoacetamide solution in 8 M urea, 0.1 M Tris-HCl pH 8.5 was added to each filter unit. After mixing filter content well for one minute, cysteines were alkylated at room temperature in the dark for 20 min without shaking. Excess iodoacetamide was then removed by spinning at 14,000 g for 10 min (30k) or 30 min (10k). Samples were further washed thrice with 100 µl of 8 M urea in 0.1 M Tris-HCl pH 8.5 and centrifugation resumed each time for 15 min (30k) or 30 min (10k) at 14,000 g. Three final buffer exchanges were performed by adding 100 µl 50 mM ABC followed by a 14,000 g spin for 10 min (30k) or 30 min (10k) and filtrates were discarded. Classically, FASP would have included an on-filter digestion. However, since our preliminary experiments using Amicons have shown suboptimal protein identifications and reproducibility with this approach, it was not further investigated and digestion has instead been performed in-solution. Precisely, concentrated samples were first recovered through a quick inverse spin of Amicons (1,000 g/5 min), thereafter transferred in a LoBind tube, diluted with 40 µl of ABC, dosed for residual SDS, and trypsin-digested (ratio 1:100 w:w) overnight (37°C) in solution. Proteolysis was quenched with 2% final (v:v) FA. Peptide yields were assessed before and after solid phase extraction (SPE) with the BCA assay on a NanoDrop-2000c.
In parallel, 150-µg aliquots of “non-SDS” lysate were also FASP-processed to confirm that nucleic acids and proteins do not interfere with the SDS colorimetric assay.
(see Supplementary Protocol)
When required by the protocol, filter units and collection tubes were filled with a 5% (v/v) Tween-20 solution in MS-grade water and soaked overnight at room temperature for passivation. Before use, passivated materials were twice immerged in water for 10 min with low-speed shaking. Filters and tubes were next twice filled with water and centrifuged at 14,000 g for 15 min (30k) or 25 min (10k).
A total of 20 fifty-microliter aliquots (150 µg of proteins) of MEG-01 lysate were purified by the Amicon-adapted eFASP protocol, corresponding to 10 samples per type of filter (A10k and A30k) (see Supplementary Table 3). Lysates were mixed with iodoacetamide (50 mM final concentration), diluted to a volume of 500 µl with 8 M urea in 0.1 M Tris-HCl pH 8 and kept in dark for a 30-min alkylation. Samples were then deposited onto filter devices for centrifugal concentration at 14,000 g for 15 min (30k) or 30 min (10k). The flow-through was discarded, as was systematically the case following each subsequent centrifugation. SDS removal was initiated by adding 500 µl of 4% (w/v) NaDoc in 8 M urea to filter units, inverting devices thrice to mix the content well and centrifuging for 30 min (30k) or 45 min (10k). Two more washing steps were performed with urea by filling devices to completeness, inverting filters and spinning for 15 min (30k) or 30 min (10k). Excess urea was then removed with two buffer exchanges during which devices were filled with ABC and spun for 20 min (30k) or 30 min (10k). Protein recovery prior to in-solution digestion was performed by an inverse spin of Amicons in new collection tubes (1,000 g/5 min), either passivated or not. Proteins were diluted to a final volume of 150 µl with ABC, mixed with trypsin/Lys-C Mix (ratio 1:25 w:w) in a LoBind tube and digested for 12 h at 37°C.
Samples were cleaned from residual SDS and NaDoc using either precipitation or phase transfer as described below. Yields were calculated with the BCA assay next to (1) precipitation or phase transfer and (2) SPE.
The concentration of SDS in purified samples was measured prior to digestion and next to precipitation or phase transfer. Before digestion, a first measurement of SDS was carried out after addition of 40 µl of ABC and a second after addition of the remaining ABC (150 µl final volume). Again, 150-µg aliquots of “non-SDS” control lysate were processed by Amicon-adapted eFASP to assess the stains-all colorimetric method’s specificity.
Following Amicon-adapted eFASP, two methods for simultaneous SDS and NaDoc removal were compared: precipitation and phase transfer. The precipitation protocol is based on Zhou et al.5 and Zhou et al.24, with minor modifications. Briefly, samples were mixed with an equal volume of 4 M KCl, acidified with 2% FA and peptides were collected in the supernatant after centrifugation at 15,700 g for 15 min to pellet the potassium dodecyl sulfate (KDS) and deoxycholate precipitates.
The phase transfer procedure has been adapted from Masuda et al.25 and Yeung and Stanley31. First, an equal volume of 4 M KCl was added to each sample, as well as 1 ml of water-saturated ethyl acetate. Samples were then centrifuged at 16,000 g for 1 min to allow separation of organic and aqueous phases. Part of the KDS-containing organic phase was discarded, leaving approximately 1 mm of the ethyl acetate layer to avoid loss of aqueous-soluble peptides. The extraction was repeated once with 600 µl of ethyl acetate before acidification with 2% FA, after which deoxycholic acid was removed by three rounds of ethyl acetate extraction. Samples were next vacuum dried for 10 min to remove the remaining organic solvent.
Unlike SDS, NaDoc cannot be quantified with the stains-all colorimetric assay. We therefore estimated its residual concentration in Amicon-adapted eFASP-prepared samples by visually comparing their deoxycholate acid-precipitated pellet with various concentrations of acid-precipitated NaDoc (standard curve).
To evaluate the processing capacities of Amicon-adapted eFASP regarding the highest amount of protein and the largest volume of sample that can be purified with no decrease in the effectiveness of SDS cleaning, we treated nine different samples containing various quantities of proteins and an equal number of volumes of lysate with A10k- and A30k-based Amicon-adapted eFASP. The remaining SDS concentration was quantified by the stains-all assay30. ‘Protein’ experiments were carried out with the lowest volume of lysate possible (<60 µl) and amounts of proteins ranged between 100 and 600 µg as initially measured by BCA protein assay. For ‘volume’ experiments, 50 µg of protein extract solubilized in lysis buffer volumes varying between 30 and 300 µl were used.
Recovered digested peptide mixtures were cleaned by SPE prior to LC-MS/MS analysis. SPE was carried out on an Oasis HLB 96-well µElution Plate containing 2 mg Sorbent (Waters, Milford, MA). Elution was performed with 75% acetonitrile containing 2% FA.
Acquisition was performed with a TripleTOF 5600 from AB SCIEX (Framingham, MA) equipped with an electrospray interface with a 25 μm I.D. capillary and coupled to an Eksigent μUHPLC (AB SCIEX). Analyst TF 1.6 software was used to control the instrument and for data processing and acquisition. The source voltage was set to 5.2 kV and temperature maintained at 375°C, curtain gas was set at 27 psi, gas one at 17 psi and gas two at 17 psi. Acquisition was performed in Data Dependent Acquisition (DDA) mode where a first period experiment was set for high resolution positive time-of-flight (TOF) MS in the m/z range 350–1,250 with a 25 ms accumulation time with declustering potential at 90 V and collision energy at 10. Top 40 ions were next triggered for 35 ms MS/MS experiment. Selected ions were next excluded after two occurrences for 45 sec. Separation was performed on a reversed phase HALO C18-ES column 0.3 μm i.d., 2.7 μm particles, 150 mm long (Advanced Materials Technology, Wilmington, DE) which was maintained at 50°C. Samples were injected by loop overfilling into a 5-μl loop that represented 3 µg of peptides. For the 60 min LC gradient, the mobile phase consisted in the following solvent A (0.2% v/v FA and 3% DMSO v/v in water) and solvent B (0.2% v/v FA and 3% DMSO in ethanol) at a flow rate of 5 μl/min. The gradient was the following: 0–45 min 2% B to 50% B, 45–49 min 50% B to 95% B, 49–53 min 95% B, 53–56 min 95% B to 2% B, 56–60 min 2% B and followed by a 2 min post-flush at 6 µl/min at final condition.
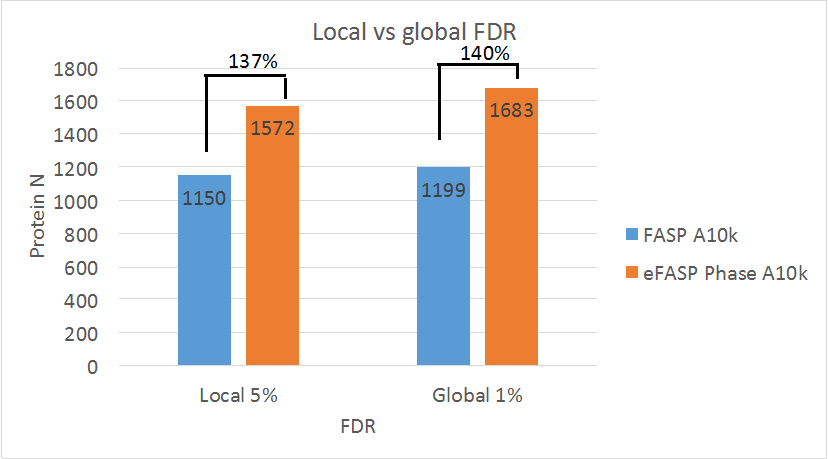
Protein identification was performed with ProteinPilot V4.5 beta (AB SCIEX) with the instrument pre-set for TripleTOF 5600, iodoacetamide as cysteine alkylation and urea denaturation as special factor. Thorough search with false discovery rate analysis was performed with biological modification emphasis against Human UniProtKB/Swiss-Prot Release 2014_01. For protein identification and data analysis using the validated Proteomics System Performance Evaluation Pipeline Software (PSPEP) from AB SCIEX, global false discovery rate was set at 1% and local false discovery rate was set at 5%. Description and review of this protein identification method can be found in Tang et al. (2008)32 and Serange and Noble (2012)33. A combined ProteinPilot analysis of data acquired by each replicate of a specific protocol was also performed to generate a separate list of confidently identified proteins. Both combined and individual analyses of replicates are reported in the manuscript, the results of the latter being expressed unless otherwise indicated as: average ± standard deviation (SD) for the replicates. Note that in FASP and Amicon-adapted eFASP without passivation, data were summarized from triplicate experiments. In Amicon-adapted eFASP protocols with passivation, data were summarized from duplicate experiments. Chromatogram review and peak area information was performed with PeakView Software (AB SCIEX). Gene Ontology (GO) analyses were based on the PANTHER Classification System (v9.0) described by Mi et al.34. A Homo sapiens genome-wide data analysis was performed on every protein ID lists generated by combined ProteinPilot analysis of replicates and accessions searched for ‘Molecular Function’, ‘Biological Process’ and ‘Cellular Component’ classes and subclasses.
We assessed the reproducibility of FASP and Amicon-adapted eFASP by manually inspecting the total ion currents (TIC) chromatograms of each protocol. For quantitative results, we extracted and cumulated, for each replicate, the intensity (area under the peak) of the five most intense peptides from the five most abundant identified proteins (25 peaks total) per protocol. Likewise, peptide retention time was compared between replicates. The identity of these five proteins was determined by the combined Protein Pilot analysis of each replicate’s data. We then averaged the total cumulated intensity of the 25 peaks for every replicate, and compared protocols on the basis of the average cumulated peaks intensity and the resulting coefficient of variation (see Equations 1). We also performed the same analysis with the average peak height. Briefly, a cumulated peak height for each of the five proteins was calculated by adding up the peak height of each of its five most intense peptides. For every single replicate, a global peak height was obtained by averaging the cumulated peak height of the five proteins. Then, the global peak heights were averaged for all protocols (see Equations 2).
Equations 1: Average cumulated signals intensity. The five most intense proteins along with their five most intense peptides for a given protocol were selected according to the combined Protein Pilot analysis of each of its replicate’s data.
(1) Protein signal intensity = intensity of peptide 1 + intensity of peptide 2 + intensity of peptide 3 + intensity of peptide 4 + intensity of peptide 5
(2) Replicate cumulated signal intensity = Protein signal intensity 1 + Protein signal intensity 2 + Protein signal intensity 3 + Protein signal intensity 4 + Protein signal intensity 5
(3) Protocol average cumulated signals intensity = (cumulated signal intensity of R1 + cumulated signal intensity of R2 + cumulated signal intensity of R3)/3
Equations 2: Average peak height. The five most intense proteins along with their five most intense peptides for a given protocol were selected according to the combined Protein Pilot analysis of each of its replicate’s data.
(1) Protein cumulated peak height = peak height of peptide 1 + peak height of peptide 2 + peak height of peptide 3 + peak height of peptide 4 + peak height of peptide 5
(2) Replicate global peak height = (Cumulated peak height of protein 1 + protein 2 + protein 3 + protein 4 + protein 5)/5
(3) Protocol global peak height = (global peak height of R1 + global peak height of R2 + global peak height of R3)/3
Few reliable and reproducible sample preparation methods are available for proteomics-based biomarker discovery, especially when conducted with SDS-solubilized biological samples. FASP is certainly one of the most efficient and simple available methods for such experiments, especially as it has been successfully applied to a variety of different samples including clinical material10–12. Nevertheless, as is the case with every other sample preparation method, FASP is not a processing method that works optimally with all biological samples and in every experimental setting15–20. In light of the very extensive literature on ‘best practices’ in sample preparation for proteomics experiments, we sought to tailor the FASP workflow for the Amicon filter device in order to improve its analytical performances. In this regard, we designed the Amicon-adapted eFASP, a complementary sample preparation method that introduces key modifications to the FASP and that is intended to improve proteome coverage and reproducibility. Among these modifications are: a passivation of the filter unit for improving SDS removal and peptide yields, a critical cleaning step with a high-content NaDoc buffer, and the substitution of on-filter for in-solution ‘one-step-two-enzymes’ trypsin/Lys-C digestion35,36. In this study, we extensively characterized the analytical properties of the Amicon-adapted eFASP by comparing it to the classic one-step digestion FASP approach9 during shotgun proteomics experiments. The extensive characterization of the human cancer cell MEG-01 proteome (a model of human leukemic megakaryoblast) is also described for the first time herein.
In agreement with Zhou et al.5, we confirmed the extreme sensitivity of trypsin to low concentrations of SDS, with complete digestion being achieved for samples containing ≤0.05% SDS (Figure 2A and Supplementary Figure 1A). The upper tolerable SDS limit is however not known for combined trypsin and Lys-C. Specifically, we found that optimal trypsin/Lys-C digestion efficacy, in a ratio of 1:25 w/w as is used in the Amicon-adapted eFASP protocol, was achieved for SDS concentrations ≤0.07% and that this combined proteolysis performed better than trypsin alone in higher SDS concentrations (Figure 2B and Supplementary Figure 1B), likely due to the greater stability of Lys-C in denaturing conditions25. The enzyme-to-protein ratio of 1:25 w/w in Amicon-adapted eFASP, representing a four-fold increase as compared to FASP, was chosen because it was previously shown preferable in comprehensive proteomics16.

Effect of increasing SDS concentrations on the completion of overnight (A) trypsin (ratio 1:100 w/w) and (B) trypsin/Lys-C (ratio 1:25 w/w) digestion of MEG-01 total cell lysates assessed by a Coomassie-stained 12% SDS-PAGE. (C) Concentrations of residual SDS prior to digestion and (D) peptide yields in FASP (n=3) and Amicon-adapted eFASP (n=10). Nonparametric Mann-Whitney U test was performed for comparison of mean SDS concentrations and peptide yields: **p<0.01, *p<0.05. Mean (±S.D.) Statistical comparisons were made between the same filters as used in FASP and Amicon-adapted eFASP. TCL: Total cell lysate.
SDS is not easily removed from proteins to which it binds strongly through ionic and hydrophobic interactions5. In FASP, usage of a washing buffer composed solely of urea has been assumed to be sufficient to completely deplete the SDS from up to 30 µl of a small protein extract (≤250 µg)9,13,14. However, this assumption was supported by the measurement of the residual detergent concentration in a FASP-cleaned 100-µl 2% SDS protein-free lysis buffer14. Rationally, the processing of a cell lysate would have been more appropriate for this purpose, especially as proteins are strongly bonded to SDS and may lower its critical micelle concentration (CMC ~6–8 mM)37, which can greatly impede its elimination (http://www.millipore.com/techpublications/tech1/6djp7f, EMD Millipore). Indeed, SDS micelles are not readily filtered by 30k and 10k MWCO membranes as their molecular weight is ~18–40 kDa14. Furthermore, urea is an uncharged chaotrope that disrupts hydrogen bonds and hydrophobic molecular interactions38. It enables the dissociation of SDS nonpolar tails from proteins but may not be as effective for disrupting the ionically bonded sulfate heads. We reasoned that introduction of the weak anionic surfactant NaDoc in the Amicon-adapted eFASP workflow would enhance the disruption of these powerful ionic interactions. Therefore, we measured for the first time the residual SDS concentration in Amicon-adapted eFASP- and FASP-processed 150-µg protein extracts. Owing to incorporation of a cleaning step with a high-concentration 4% (w/v) NaDoc buffer, Amicon-adapted eFASP significantly improves the removal of SDS from high-content protein samples independently of the filter used, and diluting proteins in a final volume of digestion buffer of 150 µl was sufficient to lower SDS concentration below the trypsin-activity-compatible 0.05% threshold for all conditions (Figure 2C and Supplementary Table 4). We also found that 4% NaDoc as used in the present Amicon-adapted eFASP version was more effective than 0.2% deoxycholic acid as is used in Erde’s eFASP18 for removing the SDS (Supplementary Table 5). In fact, among the ten different NaDoc concentrations (ranging from 0.1 to 5%) tested during Amicon-adapted eFASP designing, a single wash with 4% NaDoc was the most effective approach to deplete the SDS. Moreover, as exemplified by the complete depletion of SDS from FASP-processed samples containing <100 µg of proteins, the efficiency of filter-based SDS removal is tightly related to the initial amount of protein in the sample. This is further supported by the fact that recent experiments in which FASP led to lower-than-expected protein identifications have used >100 µg of proteins15–19. Equally important for efficient depletion of SDS is the starting volume of the sample, which was different in Amicon-adapted eFASP (50 µl) and FASP (30 µl). In fact, samples must be sufficiently diluted during buffer exchanges to minimize formation of unfilterable SDS micelles. This is more readily done with Amicon-adapted eFASP as the buffer volume is beneficially increased to 500 µl throughout the protocol, relative to the 200 µl in the FASP. Thereupon, when purifying <30 µl of a 150-µg protein extract with Amicon-adapted eFASP, SDS is almost completely (<0.05%) removed with both 10k and 30k filters. Of note, modifications brought by the Amicon-adapted eFASP protocol extend the processing limits to 50 µl/400 µg and 125 µl/600 µg for 10k and 30k filters, respectively (volume/protein) (Supplementary Table 6, Supplementary Table 7).
Minimizing nonspecific protein and peptide binding to filter device’s plastic walls and membrane by passivation is possible with Tween-20 and SDS18. This reasonably implies that SDS present in the sample may bind to non-passivated filter reservoir’s surfaces and may not be completely removed despite buffer exchanges, further explaining the difficulty of removing it from spin filter-processed proteins. This may however be prevented by pre-treating filters with Tween-20. As such, lower concentrations of SDS were achieved in samples eFASP-processed with passivated Amicon filters (Supplementary Table 4). In sum, Amicon-adapted eFASP efficiently eliminates SDS by combining a passivation of the filter device, an increase of exchange buffer volume and an incorporation of a high-concentration NaDoc-based cleaning step. These features respectively prevent non-specific binding of SDS to device’s surfaces, minimize formation of unfilterable SDS micelles and ease dissociation of ionically bonded SDS from basic amino acids.
Amicon-adapted eFASP provided 10% higher peptide recoveries for each type of filter as compared to FASP (Figure 2D and Supplementary Figure 2). The better yields of Amicon-adapted eFASP may be attributed to the filter passivation (Supplementary Table 4) and to its reduced number of centrifugations.
We next aimed to evaluate if Amicon-adapted eFASP compares favourably to FASP in regard to depth of proteome coverage. We found that Amicon-adapted eFASP noticeably deepened the MEG-01 cell’s proteome coverage relative to FASP (Figure 3A, B and Table 1). The lower concentrations of SDS remaining in samples after Amicon-adapted eFASP protocols, which were lower than the trypsin/Lys-C activity-compatible threshold, may in part explain the difference in proteome coverage. A considerable number of peptides/proteins were confidently identified (1% false discovery rate) in the three replicates of the Amicon-adapted eFASP/A10k/PPT protocol: 6,479/1,595, 6,567/1,596 and 6,424/1,603. The delivery rate was accordingly very high, with 27 proteins identified per minute, and the combined peptides-to-protein ratio was close to 6.0, an increment of 1 peptide per protein relative to FASP. This Amicon-adapted eFASP protocol (i.e. A10k/PPT) is the least variable regarding the number of identified peptides (coefficient of variation [CV] = 1.1%) and proteins (CV = 0.28%) per replicate. Combined analysis led to the identification of 12,431 peptides and 2,177 proteins, a significant increase of 200% for peptides and 150% for proteins compared to FASP with a 30k MWCO filter. Moreover, the protein overlap is ≥70% between the Amicon-adapted eFASP/A10k/PPT protocol and every other single one (Figure 3C and Supplementary Table 8). Along with improvements in SDS removal and peptide recoveries, passivation increased peptide and proteins identifications by 7% and 6%, respectively. There is also ≥80% homology among the proteins identified by a passivated Amicon-adapted eFASP approach and its non-passivated equivalent. In conjunction with the Amicon-adapted eFASP/A10k/PPT protocol, passivation yields identification of 1,662 and 1,698 proteins, for the two replicates. In light of the previous results, it seems clear that passivation of filter, simultaneous trypsin/Lys-C in-solution digestion and incorporation of NaDoc to enhance both removal of SDS and enzyme activity, were beneficent for the workflow. In fact, the concentration of residual NaDoc in Amicon-adapted eFASP digestion buffer as assessed by precipitation ranged between 0.20% and 0.35%. This concentration is known to significantly improve digestion reproducibility and to facilitate proteolysis of membrane and hydrophobic proteins22,25,39. As logically expected with a lower MWCO filter, fewer proteins were lost in A10k-based Amicon-adapted eFASP protocols, enabling the identification of more proteins. The opposite finding in FASP might be explained by the lower digestion efficiency achieved for A10k-processed samples due to higher concentrations of residual SDS, leading to loss of incompletely cleaved polypeptides during SPE.
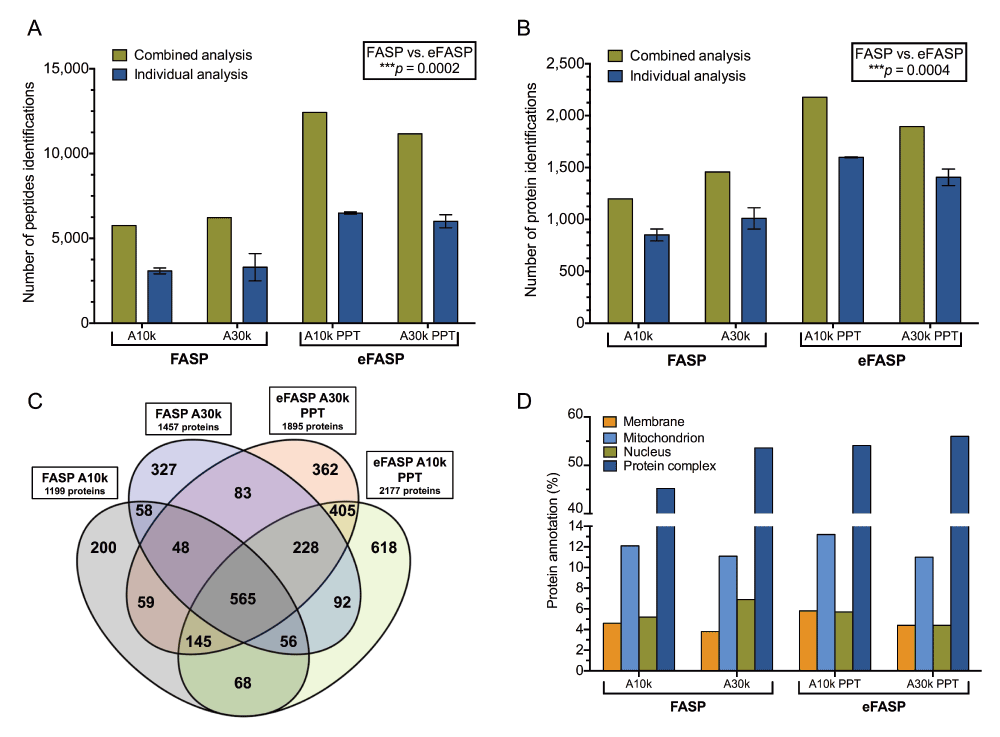
(A) Peptide and (B) protein identifications achieved by Amicon-adapted eFASP/precipitation and FASP protocols at a 1% global false discovery rate. Displayed are the results of the combined (green) and individual (blue) analyses of replicates. For individual analyses, data corresponding to the mean ± standard deviation were summarized from triplicate experiments. Comparison of peptide and protein total identifications between Amicon-adapted eFASP and FASP was performed with the nonparametric Mann-Whitney U test. (C) Protein identifications overlap from combined analysis of Amicon-adapted eFASP/precipitation and FASP protocols. The total number of proteins identified per protocol is indicated in the corresponding box. (D) Comparison of Gene Ontology annotations for specific cellular component classes in Amicon-adapted eFASP/precipitation- and FASP-processed and analyzed SDS lysates. Bars represent the percentage of identified proteins with the indicated annotations. PPT: Precipitation.
| Peptide Identifications | Protein Identifications | Average Sequence Coverage (%) | Molecular Weight (kDa) | Peptides-to-protein Ratio | ||||||||
|---|---|---|---|---|---|---|---|---|---|---|---|---|
| Protocol | Totala | Average (±SD)b | Totala | Average (±SD)b | Combined analysisa | Individual analysis (±SD)b | Mediana | Average (±SD)b | Combined analysisa | Averageb | ||
| FASP | Amicon 10k | 5,755 | 3,080 (174.7) | 1,199 | 851 (57.2) | 23.96 | 18.83 (0.22) | 43.90 | 62.43 (127.70) | 4.8 | 3.6 | |
| Amicon 30k | 6,223 | 3,299 (802.9) | 1,457 | 1,010 (102.8) | 20.38 | 15.27 (1.87) | 46.99 | 61.62 (57.23) | 4.3 | 3.2 | ||
| Amicon- based eFASP | Amicon 10k | Phase | 9,907 | 5,153 (354.9) | 1,683 | 1,214 (87.1) | 25.84 | 20.64 (1.29) | 44.76 | 58.61 (54.32) | 5.9 | 4.2 |
| PPT | 12,431 | 6,490 (72.1) | 2,177 | 1,598 (4.4) | 22.22 | 18.29 (0.24) | 46.42 | 61.24 (56.49) | 5.7 | 4.1 | ||
| PT20/Phase | 8,171 | 5,262 (145.0) | 1,525 | 1,208 (31.8) | 24.15 | 19.74 (0.79) | 46.39 | 60.63 (57.13) | 5.4 | 4.4 | ||
| PT20/PPT | 10,338 | 6,716 (5.0) | 2,046 | 1,680 (25.5) | 19.68 | 17.58 (0.21) | 46.90 | 64.02 (105.60) | 5.1 | 4.0 | ||
| Amicon 30k | Phase | 10,343 | 4,313 (1,569.1) | 1,677 | 1,075 (261.5) | 25.01 | 16.94 (2.78) | 45.49 | 60.30 (59.72) | 6.2 | 3.9 | |
| PPT | 11,167 | 6,007 (385.3) | 1,895 | 1,406 (80.0) | 23.10 | 18.47 (0.19) | 46.41 | 59.89 (55.93) | 5.9 | 4.3 | ||
| PT20/Phase | 7,134 | 4,643 (270.1) | 1,437 | 1,131 (97.6) | 21.39 | 17.83 (0.57) | 46.87 | 60.41 (54.20) | 5.0 | 4.1 | ||
| PT20/PPT | 9,805 | 6,395 (35.4) | 1,826 | 1,508 (5.0) | 20.71 | 18.25 (0.04) | 46.42 | 59.88 (54.95) | 5.4 | 4.2 | ||
Finally, it is worth noting that phase transfer-based Amicon-adapted eFASP protocols yielded 20% lower protein identifications as compared to precipitation-based ones (Table 1). This is in good agreement with Lin et al.39 and might have been caused by loss of ethyl acetate-miscible hydrophobic peptides and incorporation of peptide-containing water droplets in the organic phase during the extractions31. Moreover, there is no significant difference in sequence coverage and mean molecular weight of identified proteins among protocols (Supplementary Figure 3–Supplementary Figure 5 and Supplementary Table 4).
Amicon-adapted eFASP is the first method to enable the identification in only one hr of nearly 1,700 proteins in a single analysis and 2,200 proteins in three separate runs from minimally prepared and non-fractionated SDS-solubilized lysates. To our knowledge, this is also the first study to achieve an identification yield this high in one hr with a 15-cm column, favourably comparing to Hebert et al.40 that reached 3,977 identifications with a 35-cm column.
The complete list of peptides and protein IDs identified by each protocol with both combined and individual analyses of replicates can be found in Supplementary Dataset 1–Supplementary Dataset 11.
Supplementary Dataset 1: Proteins identified by combined analysis of replicates for each of the ten protocols of the study
Supplementary Dataset 2: Peptides and proteins identified by individual analysis of each replicate for the FASP, Amicon 10k protocol
Supplementary Dataset 3: Peptides and proteins identified by individual analysis of each replicate for the FASP, Amicon 30k protocol
Supplementary Dataset 4: Peptides and proteins identified by individual analysis of each replicate for the Amicon-adapted eFASP, Amicon 10k, phase transfer protocol
Supplementary Dataset 5: Peptides and proteins identified by individual analysis of each replicate for the Amicon-adapted eFASP, Amicon 10k, precipitation protocol
Supplementary Dataset 6: Peptides and proteins identified by individual analysis of each replicate for the Amicon-adapted eFASP, passivated Amicon 10k, phase transfer protocol
Supplementary Dataset 7: Peptides and proteins identified by individual analysis of each replicate for the Amicon-adapted eFASP, passivated Amicon 10k, precipitation protocol
Supplementary Dataset 8: Peptides and proteins identified by individual analysis of each replicate for the Amicon-adapted eFASP, Amicon 30k, phase transfer protocol
Supplementary Dataset 9: Peptides and proteins identified by individual analysis of each replicate for the Amicon-adapted eFASP, Amicon 30k, precipitation protocol
Supplementary Dataset 10: Peptides and proteins identified by individual analysis of each replicate for the Amicon-adapted eFASP, passivated Amicon 30k, phase transfer protocol
Supplementary Dataset 11: Peptides and proteins identified by individual analysis of each replicate for the Amicon-adapted eFASP, passivated Amicon 30k, precipitation protocol41
Visual appraisal of TIC identified Amicon-adapted eFASP/A10k/PPT as the most reproducible protocol, which is further improved for significant signal enhancement throughout the gradient by passivation (Figure 4, Figure 5 and Supplementary Figure 6D). Noteworthy, the TIC spectra of each replicate are almost perfectly superposed one to another in these two protocols as exemplified by the ~6.5% CV in the cumulated intensity and global peak height. In fact, combination of precipitation and passivation always provided the strongest signal and the highest reproducibility for both Amicon 10k and 30k when used in the Amicon-adapted eFASP workflow (Supplementary Figure 6–Supplementary Figure 8). Signal suppression from remaining SDS seems to be present in both FASP/A10k and FASP/A30k chromatograms, which might also have contributed to the lower identification yields of FASP (Figure 4C and Supplementary Figure 6A). Indeed, it was previously shown that ≥0.01% (w/v) SDS significantly suppresses analyte ion signals and dramatically reduces protein identification in bottom-up proteomics approaches4.

Total ion current (TIC) chromatograms of the three replicates from (A) Amicon-adapted eFASP Amicon 10k precipitation (maximal signal intensity: 4.0e7) and (C) FASP Amicon 10k (maximal signal intensity: 1.5e7) within the total 1-hr analytical liquid chromatography gradient. Extracted-ion chromatograms of Histone H2B peptide LLLPGELAK from (B) Amicon-adapted eFASP Amicon 10k precipitation (maximum signal intensity: 2.5e6) and (D) FASP Amicon 10k (maximum signal intensity: 7.5e5). (B, D) The retention time (minutes) of the peptide is also indicated for each replicate.

Bars show the average cumulated MS signals intensities from each replicate for the five most intense peptides from the five most abundant identified proteins per protocol. Error bars are representative of the standard deviation of the mean associated with each replicate analysis. Data were summarized from triplicate experiments and duplicate experiments for the Amicon-adapted eFASP passivated Amicon 10k and Amicon 30k precipitation (Amicon-adapted eFASP/A10k/PT20/PPT and Amicon-adapted eFASP/A30k/PT20/PPT) protocols. Numbers above error bars indicate the coefficient of variation in the average cumulated MS signal intensities. PPT: Precipitation. PT20: 5% Tween-20 passivation.
Broad and unbiased proteomics representation of subcellular compartments is a prerequisite for successful protein biomarker discovery. There were some differences in Gene Ontology (GO) cell component annotations between FASP and Amicon-adapted eFASP protocols, with more membrane and mitochondrion proteins, as well as more protein complex annotated in the latters (Figure 3D). On the other hand, the Amicon-adapted eFASP/passivated A10k/PPT protocol provided the highest combined GO annotations for nuclear and membrane proteins (Supplementary Figure 9), likely owing to the presence of NaDoc in the digestion buffer. Indeed, NaDoc helps to solubilize and expose membrane proteins’ cleavage sites to trypsin26, leading to an increase of their identification as previously shown18,23–25,39.
In summary, our Amicon-adapted eFASP protocol is an optimized Amicon unit-based sample preparation approach that provides efficient removal of SDS, high reproducibility, deep proteome coverage and enhanced identification of membrane proteins. Amicon-adapted eFASP enabled the identification of 1,700 proteins from SDS-solubilized proteins with minimal sample preparation and no fractionation, within a single run one-hr liquid chromatography and using a 15-cm column. Its implementation in proteomics may therefore improve the identification of high-confidence and significant biomarkers.
F1000Research: Dataset 1. Supplementary Dataset 1–Supplementary Dataset 11, 10.5256/f1000research.6529.d10259441
| Views | Downloads | |
|---|---|---|
| F1000Research | - | - |
|
PubMed Central
Data from PMC are received and updated monthly.
|
- | - |
Click here to access the data.
Spreadsheet data files may not format correctly if your computer is using different default delimiters (symbols used to separate values into separate cells) - a spreadsheet created in one region is sometimes misinterpreted by computers in other regions. You can change the regional settings on your computer so that the spreadsheet can be interpreted correctly.
Provide sufficient details of any financial or non-financial competing interests to enable users to assess whether your comments might lead a reasonable person to question your impartiality. Consider the following examples, but note that this is not an exhaustive list:
Sign up for content alerts and receive a weekly or monthly email with all newly published articles
Already registered? Sign in
The email address should be the one you originally registered with F1000.
You registered with F1000 via Google, so we cannot reset your password.
To sign in, please click here.
If you still need help with your Google account password, please click here.
You registered with F1000 via Facebook, so we cannot reset your password.
To sign in, please click here.
If you still need help with your Facebook account password, please click here.
If your email address is registered with us, we will email you instructions to reset your password.
If you think you should have received this email but it has not arrived, please check your spam filters and/or contact for further assistance.
Comments on this article Comments (0)