Keywords
Functional genomics, Epidemiological studies, Data exploration, On-demand data analysis, Open-source software, Kvik
This article is included in the Container Virtualization in Bioinformatics collection.
Functional genomics, Epidemiological studies, Data exploration, On-demand data analysis, Open-source software, Kvik
Overall we reduced the implementation details in the note. This was something that both reviewers pointed out and we felt that the note was a bit too
technical. We also clarified the difference between Kvik and Kvik Pathways. We have changed the requirements and included a list of contributions. We also revisited the figures to make them more clear to the reader. We also fixed some grammatical errors.
See the authors' detailed response to the review by Zhenjun Hu
See the authors' detailed response to the review by Paul Klemm
Visual explorative analysis is essential for understanding biological functions in large-scale omics’ datasets. However, enabling the inclusion of omics’ data in large epidemiological studies requires collecting samples from thousands of people at different biological levels over a long period of time. It is therefore usual to reuse the data for different research questions and projects. Although an existing tool may be useful for one project, no tool provides the required functionality for several different projects.
We have designed and implemented Kvik, a framework that makes it easy to develop new applications to explore different research questions and data. The initial version Kvik1 contained a prototype system for exploring biological pathways and gene expression data. From this prototype we built the Kvik Framework, which provides developers a simple interface to powerful systems for statistical analyses and meta-databases, and Kvik Pathways: a publicly available data exploration application. From our experience in developing a framework for building data exploration applications, we identified four requirements such applications should satisfy:
Interactive The applications should provide interactive exploration of datasets through visualizations and integration with relevant information. To understand the large quantities of heterogeneous data in epidemiological studies, researchers need interactive visualizations that provide different views and presentations of the data. Also, to understand the results it is important to have instant access to existing knowledge from online databases.
Familiar They should use familiar visual representations to present information to researchers. For more efficient data exploration it is effective to use representations that researchers are familiar with both from the literature and from other applications.
Simple to use Researchers should not need to install software to explore their data through the applications. The applications should protect the researcher from the burden of installing and keeping an application up to date.
Lightweight Data presentation and computation should be separated to make it possible for researchers to explore data without having to have the computational power to run the analyses. With the growing rate data is produced at, we cannot expect that researchers have the resources to store and analyze data on their own computers.
There are several tools for exploring biological data in the context of pathways, such as VisANT (available online at visant.bu.edu) by 2, VANTED (available online at vanted.ipk-gatersleben.de)3, enRoute by 4 or Entourage by 5 (both available online at caleydo.org). However, these tools do not provide the adaptability needed for exploration of multi-study datasets. Many existing tools place the visualization, data analysis and storage on the user’s computer, making it necessary to have a powerful computer. In addition, the tools are often standalone applications that require users to install and update the applications. Kvik Pathways satisfies the above requirements as follows:
Interactive Kvik Pathways provides interactive pathway visualizations and information from the popular Kyoto encyclopedia of genes and genomes (KEGG)6 database (available online at kegg.jp).
Simple to use Kvik Pathways uses HTML5 and modern JavaScript libraries to provide an interactive application that runs in any modern web browser.
Familiar Kvik Pathways uses the familiar pathway representations from KEGG and graphical user interfaces found in modern web applications.
Lightweight Kvik Pathways uses a powerful back-end provided by the Kvik framework to perform statistical analyses.
Both Kvik and Kvik Pathways are open-sourced at github.com/fjukstad/kvik. We provide an online version of Kvik Pathways at kvik.cs.uit.no and to run Kvik Pathways in a local Docker instance or on a cloud service such as Amazon Web Services (aws.amazon.com) or Google Compute Engine (cloud.google.com/compute), we provide a Docker image at registry.hub.docker.com/u/fjukstad/kvik.
In this note we describe how we used Kvik to implement Kvik Pathways, a tool for exploring gene expression in the context of biological pathways. In Kvik Pathways researchers can explore gene expression data from 7 combined with information from online knowledge bases. We provide the following contributions:
Kvik Pathways, a publicly available web application for exploring gene expression data in the context of biological pathways without any additional applications than a web browser.
A requirement analysis for interactive exploration tools for epidemiological studies.
A detailed description of how we have used Kvik Pathways to explore gene expression data from healthy women with high and low plasma ratios of essential fatty acids.
Kvik Pathways allows users to interactively explore a molecular dataset, such as gene expression, through a web application. It provides pathway visualizations and detailed information about genes and pathways from the KEGG databases (Figure 1). Through pathway visualizations and integration with the KEGG databases, epidemiologists can perform targeted exploration of pathways and genes to get an overview of the biological functions that are involved with gene expression from the underlying dataset. Kvik Pathways gathers information about related pathways and retrieves relevant information about genes, making it unnecessary for researchers to spend valuable time looking up this information manually. For example, navigating a set of pathways and browsing information about genes in these, requires the researcher to manually query KEGG for each specific gene. Kvik Pathways retrieves information about genes without the researcher having to leave the pathway visualization to retrieve relevant information.
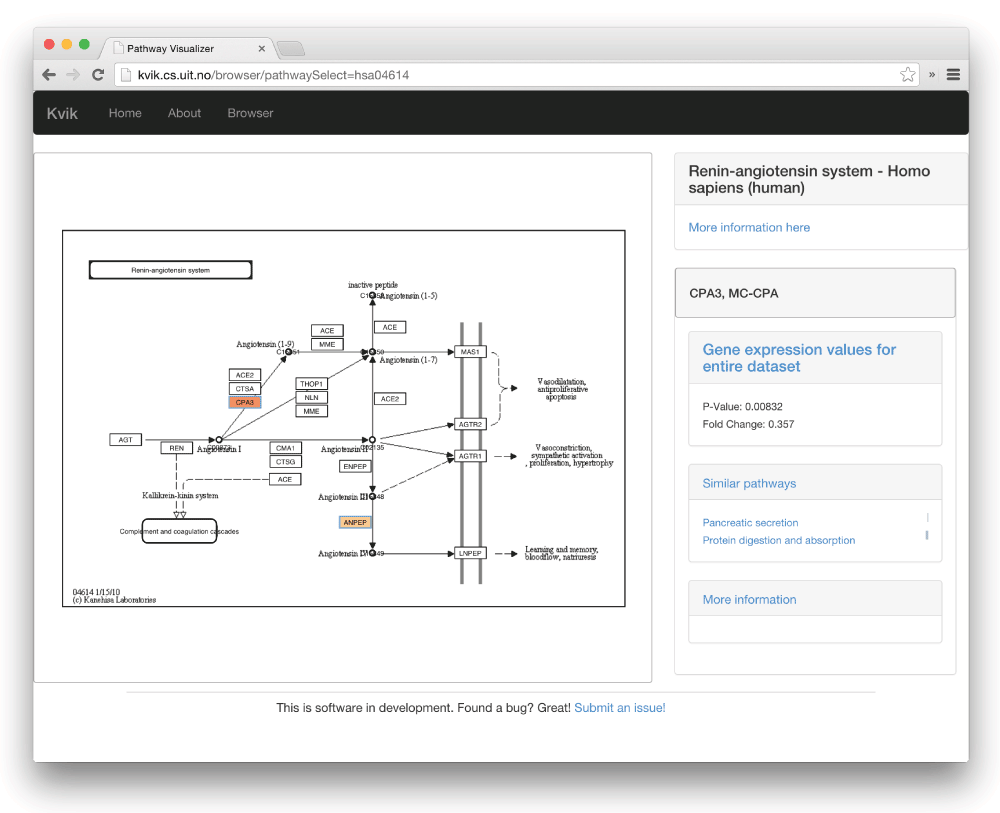
The user has selected the gene CPA3, which brings up the panel on the right. From here researchers can browse pathways that the gene is a member of, and read relevant information about the gene from KEGG.
The Kvik framework provides a flexible statistics back-end where researchers can specify the analyses they want to run to generate data for later visualization. For example, in Kvik Pathways we retrieve fold change for single genes every time a pathway is viewed in the application. These analyses are run ad hoc on the back-end servers and generates output that is displayed in the pathways in the client’s web browser. The data analyses are implemented in a simple R script and can make use of all available libraries in R, such as Bioconductor (bioconductor.org).
Researchers modify this R script to, for example, select a normalization method, or to tune the false discovery rate (FDR) used to adjust the p-values that Kvik Pathways uses to highlight significantly differentially expressed genes. Since Kvik Pathways is implemented as a web application and the analyses are run ad hoc, when the analyses change, researchers get an updated application by simply refreshing the Kvik Pathways webpage.
We implemented interactive visualizations using the Cytoscape.js (js.cytoscape.org) library to generate the interactive pathway visualizations, and D3 (d3js.org) for Document Object Model (DOM) manipulation such as generating bar charts with HTML <svg> elements. We integrate these with the popular Bootstrap front-end framework (getbootstrap.com) to provide a familiar and aesthetically pleasing user interface.
Kvik Pathways has a three-tiered architecture of independent layers (Figure 2). The browser layer consists of the web application for exploring gene expression data and biological pathways. A front-end layer provides static content such as HTML pages and stylesheets, as well as an interface to the data sources with dynamic content such as gene expression data or pathway maps to the web application. The back-end layer contains information about pathways and genes, as well as computational and storage resources to process genomic data such as the NOWAC data repository. The Kvik framework provides the components in the back-end layer.
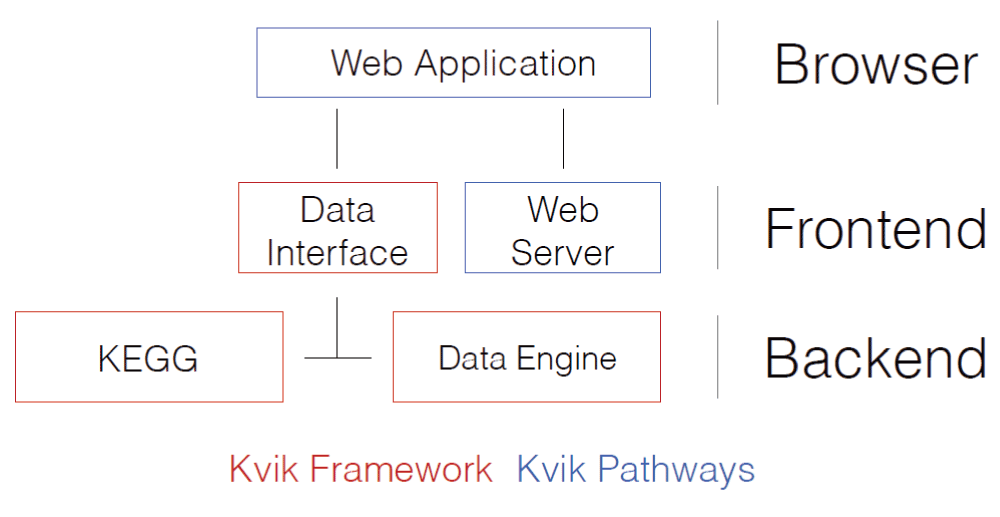
In our setup the Data Engine in the back-end layer provides an interface to the NOWAC data repository stored on a secure server on our local supercomputer. In Kvik Pathways all gene expression data is stored on the computer that runs the Data Engine. The Data Engine runs an R session accessible over remote procedure calls (RPCs) from the front-end layer using RPy2 (rpy.sourceforge.net) to interface with R. To access data and run analyses the Data Interface exposes a HTTP API to the browser layer (Table 1 provides the interfaces).
All URLs are relative to the hostname where the Data Engine server runs. On our public installation the Data Engine runs on kvik.cs.uit.no:8888. For example, use kvik.cs.uit.no:8888/genes/ to retrieve all available genes in our dataset. By using a HTTP API we can build different data exploration applications in virtually any programming language.
To create pathway visualizations the Kvik back-end retrieves and parses the KEGG Markup Language (KGML) representation and pathway image from KEGG databases through its REST API (rest.kegg.jp). This KGML representation of a pathway is an XML file that contains a list of nodes (genes, proteins or compounds) and edges (reactions or relations). Kvik parses this file and generates a JSON representation that Kvik Pathway uses to create pathway visualizations. Kvik Pathways Cytoscape.js to create a pathway visualization from the list of nodes and edges and overlay the nodes on the pathway image. To reduce latency when using the KEGG REST API, we cache every response on our servers. We use the average fold change between the groups (women with high or low plasma ratios of essential fatty acids) in the dataset to color the genes within the pathway maps. To highlight p-values, the pathway visualization shows an additional colored frame around genes. We visualize fold change values for individual samples as a bar chart in a side panel. This bar chart gives researchers a global view of the fold change in the entire dataset.
We used Kvik Pathways to repeat the analyses in a previous published project (7, doi: 10.1371/journal.pone.0067270) that compared gene expression in blood from healthy women with high and low plasma ratios of essential fatty acids. Gene expression differences between groups were assessed using t-tests (p-values adjusted with the Benjamini-Hochberg method). There were 184 differentially expressed genes significant on the 5% level. When exploring this gene list originally, functional information was retrieved from GeneCards and other repositories, and the list was analyzed for overlap with known pathways using MSigDB (available online at broadinstitute.org/gsea/msigdb). The researchers had to manually maintain overview of single genes, gene networks or pathways, and gather functional information gene by gene while assessing differences in gene expression levels. With this approach, researchers are limited by manual capacity, and the results may be prone to researcher bias. Kvik Pathways eliminates this researcher bias and does not limit the information retrieval to a researcher’s manual capacity.
Initially, Kvik Pathways was implemented to explore gene expression data from a not yet published dataset. To use Kvik Pathways to explore the data from the analyses in 7, we only needed to make small modifications to the analysis R script used by the Data Engine. (The modified R script is found at github.com/fjukstad/kvik/blob/master/dataengine/data-engine.r). Instead of loading the unpublished dataset, we could load the dataset from 7 and use the four functions that are accessible over RPC (Table 1 shows the HTTP API which uses the underlying RPCs). Currently this script is less than 30 lines, consisting of four functions to retrieve data and a simple initialization step that reads the dataset. Researchers only have to modify these four functions to enable exploration of new datasets. As of the current implementation of Kvik Pathways researchers have to modify the analysis script outside the application.
As an example of practical use of Kvik Pathways, we chose one of the significant pathways from the overlap analysis, the renin-angiotensin pathway (Supplementary table S5 in 7). The pathway contains 17 genes, and in the pathway map we could instantly identify the two genes that drive this result. The color of the gene nodes in the pathway map indicates the fold change, and the statistical significance level is indicated by the color of the node’s frame. We use this image of a biological process to see how these two genes (and their expression levels) are related to other genes in that pathway, giving a biologically more meaningful context as compared to merely seeing the two genes on a list.
Kvik Pathways is an open-source system for explorative analyses of functional genomics data from epidemiological studies. It uses R to perform on-demand data analyses providing a flexible back-end that can expand to new analyses and research projects. It uses modern visualization libraries and a powerful back-end for on-demand statistical analyses. Epidemiologists are using Kvik Pathways to analyze gene expression data. Kvik Pathways is open-sourced at github.com/fjukstad/kvik and is available as a Docker image at registry.hub.docker.com/u/fjukstad/kvik.
Data used in the use case is available in the Gene Expression Omnibus (ncbi.nlm.nih.gov/geo), under accession number GSE15289.
| Views | Downloads | |
|---|---|---|
| F1000Research | - | - |
|
PubMed Central
Data from PMC are received and updated monthly.
|
- | - |
Provide sufficient details of any financial or non-financial competing interests to enable users to assess whether your comments might lead a reasonable person to question your impartiality. Consider the following examples, but note that this is not an exhaustive list:
Sign up for content alerts and receive a weekly or monthly email with all newly published articles
Already registered? Sign in
The email address should be the one you originally registered with F1000.
You registered with F1000 via Google, so we cannot reset your password.
To sign in, please click here.
If you still need help with your Google account password, please click here.
You registered with F1000 via Facebook, so we cannot reset your password.
To sign in, please click here.
If you still need help with your Facebook account password, please click here.
If your email address is registered with us, we will email you instructions to reset your password.
If you think you should have received this email but it has not arrived, please check your spam filters and/or contact for further assistance.
Comments on this article Comments (0)