Keywords
artemisinin resistance, resistance evolution, Plasmodium falciparum, non-synonymous polymorphism
artemisinin resistance, resistance evolution, Plasmodium falciparum, non-synonymous polymorphism
Artemisinin combination therapy (ACT) is the frontline treatment for malaria caused by Plasmodium falciparum and has played a major role in reducing malaria mortality from an estimated 840,000 deaths in the year 2000 to 440,000 deaths in the year 20151. The emergence and spread of artemisinin resistance in South-East Asia, however, poses a serious threat to malaria control, and the containment of artemisinin resistance is thus a global public heath priority2–8.
One of the most important unanswered questions in anti-malarial drug resistance is why it has repeatedly emerged in South-East Asia3,4,6,9. The resistance to chloroquine was first reported in South-East Asia in 1957 before spreading to India and Africa where it resulted in the significant increase in malaria child mortality possibly killing millions of children10–12. The resistance to sulphadoxine-pyrimethamine also emerged in South-East Asia in the late 1960s following a similar route to India and Africa9. Worryingly, the resistance to artemisinin has emerged independently at multiple places in South-East Asia13–17 and is now present 25 km from the Indian border17 threatening to follow the same trajectory as resistance to previous anti-malarial drugs. Improved understanding of the process of how and why anti-malarial drug resistance emerges in South-East Asia could provide critical information in developing strategies to prevent the spread of the current wave of artemisinin resistance.
Here we ask whether there are evolutionary constraints on P. falciparum strains from South-East Asia that differ from African strains and thus might explain the higher predisposition of South-East Asia strains to evolve drug resistance. To answer this question we utilized a recent large global genome sequencing data from ~3400 clinical samples which identified nearly million high-quality single nucleotide polymorphisms (SNPs) in the exonic regions of P. falciparum18.
Resistance to anti-malarial drugs often involves changes in the amino-acid sequence within specific proteins. Thus, we tested whether the ratio of non-synonymous (amino acid changing) to synonymous polymorphism is higher in South-East Asia (SEA). Figure 1 shows a significantly higher ratio of non-synonymous to synonymous polymorphism (N/S) in SEA samples compared to African samples with almost no overlap in their distributions. The mean and median N/S for samples from SEA were 2.33, compared to 2.06 for Africa (Wilcox test p-value 0, number SEA samples 1600, and number Africa samples 1647). The higher N/S in SEA compared to Africa was also evident at the gene level with a larger number of genes showing higher N/S in SEA than in Africa (Figure 2). Mean and median N/S for genes in SEA samples were 2.1 and 1.9 respectively, while for African samples the mean and median N/S were 1.9 and 1.8 respectively (paired t-test p-value 1E-43, paired Wilcox-test p-value 4E-27, n = 4792). There were 75 genes with more than 3-fold higher N/S in SEA samples relative to African samples and N/S of more than four in SEA. Interestingly, most of these genes were not related to antigenic variation (Supplementary Table 1), but perform basic housekeeping functions, suggesting that higher N/S of these genes in SEA might not be primarily driven by differential host immune selection. In addition to Kelch13, -the only gene known to be causally associated with artemisinin resistance- the list includes CRT (chloroquine-resistance transporter) which shows an 8-fold higher N/S in SEA samples compared to African samples and has previously been shown to be associated with artemisinin resistance in a genome-wide association studies (GWAS) study15. In summary, P. falciparum strains from SEA show a higher ratio of non-synonymous to synonymous polymorphisms than African strains.
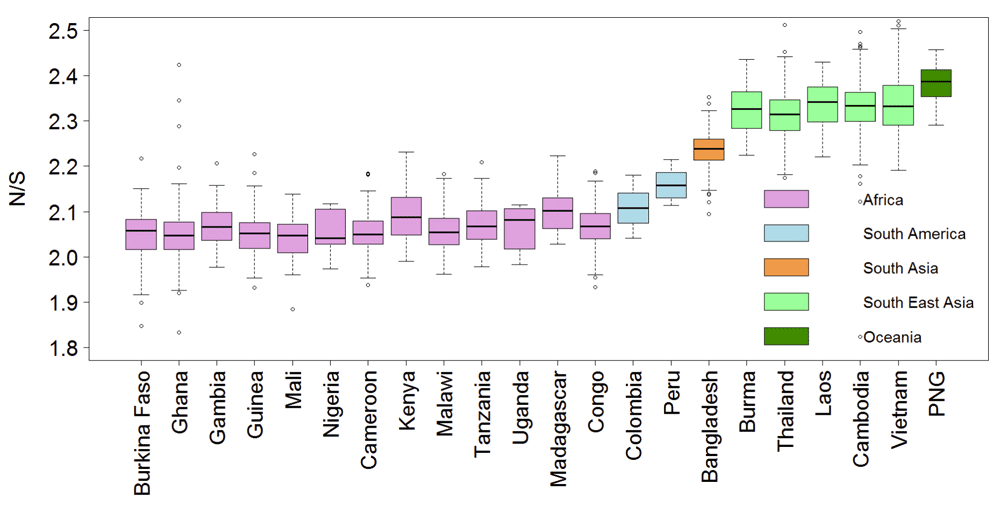
The ratios of non-synonymous to synonymous polymorphism (N/S) for 3394 samples from 22 countries are shown. The y-axis is truncated at the top with 13 samples not shown.
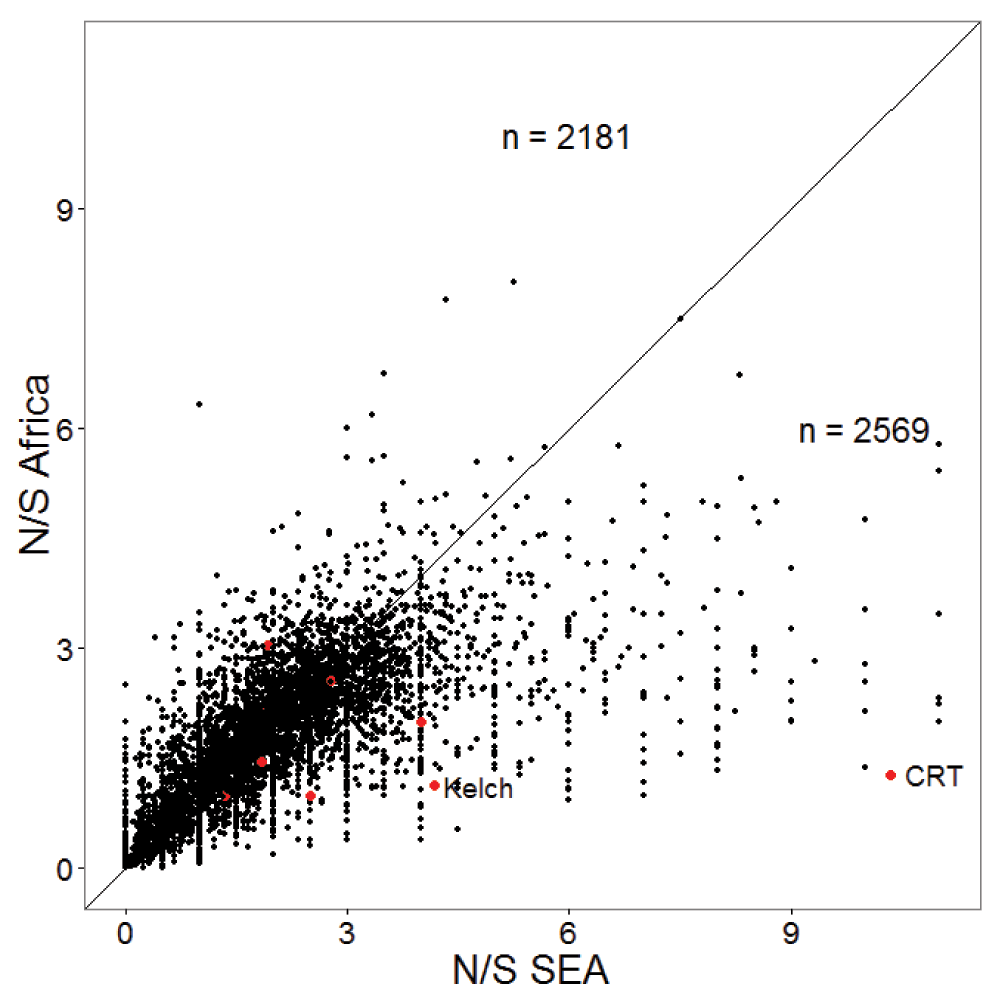
The scatter-plot shows N/S in SEA and Africa for 4792 genes. Genes previously associated with artemisinin resistance in a GWAS study15 are shown in red, with Kelch13 and chloroquine-resistance transporter (CRT) labelled. The diagonal line is shown and the numbers of genes on both sides of the diagonal are indicated. The x and y-axes are truncated with 28 genes not shown.
Highly conserved proteins in P. falciparum show a much lower N/S, indicating lower tolerance for non-synonymous polymorphism18. We tested whether the correlation between N/S and protein conservation might be different in SEA and Africa. The correlation between N/S and conservation was much weaker in SEA (Figure 3) with Pearson correlation of -0.43 (95% CI: -0.41 to -0.46) compared to -0.69 (95% CI: -0.68 to -0.71) in Africa. The lower correlation in SEA suggests a higher ratio of non-synonymous to synonymous changes at conserved positions. Indeed, non-synonymous polymorphisms specifically observed in SEA are more likely to occur at conserved positions compared to those specific to Africa (Figure 4). Samples from SEA show higher N/S compared to Africa when considering only conserved positions (Figure 5). These results suggest a lower efficiency of negative selection in SEA in removing potentially deleterious mutations. This may be important for the acquisition of antimalarial drug resistance since these mutations preferentially occur at the conserved sites19, e.g. artemisinin resistance mutations in Klech13 occur in the conserved region of the protein18, resistance mutations also occur in the conserved regions in DHFR (dihydrofolate reductase), DHPS (dihydropteroate synthase), and CRT (chloroquine-resistance transporter)19. In summary, P. falciparum strains from SEA show a higher ratio of non-synonymous to synonymous polymorphisms at conserved sites in the protein sequences than African strains.
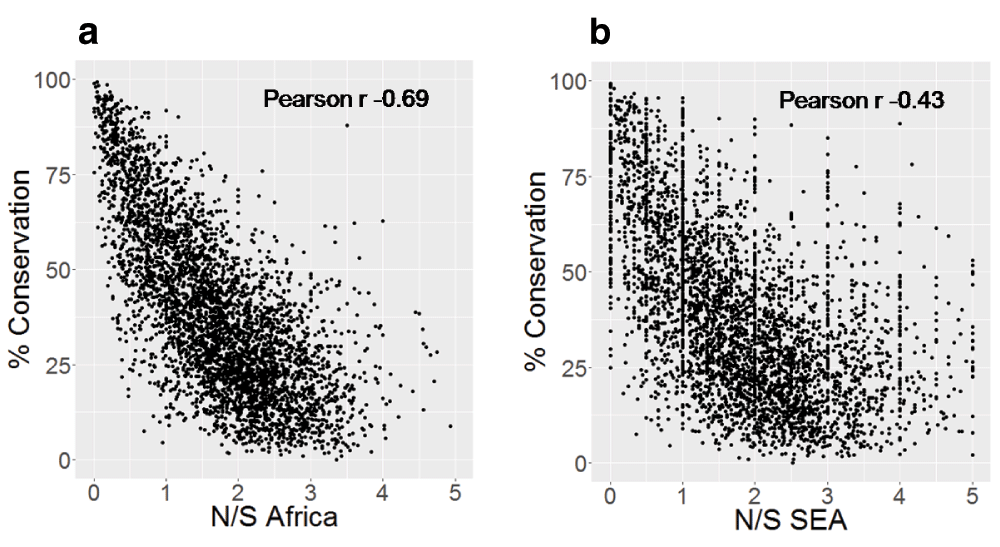
A) Scatter-plot of N/S in Africa and percent protein conservation and B) Scatter-plot of N/S in SEA and percent protein conservation. Percent conservation for each protein is the percent of residues identical across orthologs in seven Plasmodium species (P. berghei, P. chabaudi, P. cynomolgi, P. knowlesi, P. reichenowi, P. vivax, P. yoelii). Only proteins with orthologs in all Plasmodium species are shown (4075 proteins). Y-axis is truncated with 7 points not shown in Figure 3a and 112 points not shown in Figure 3b.
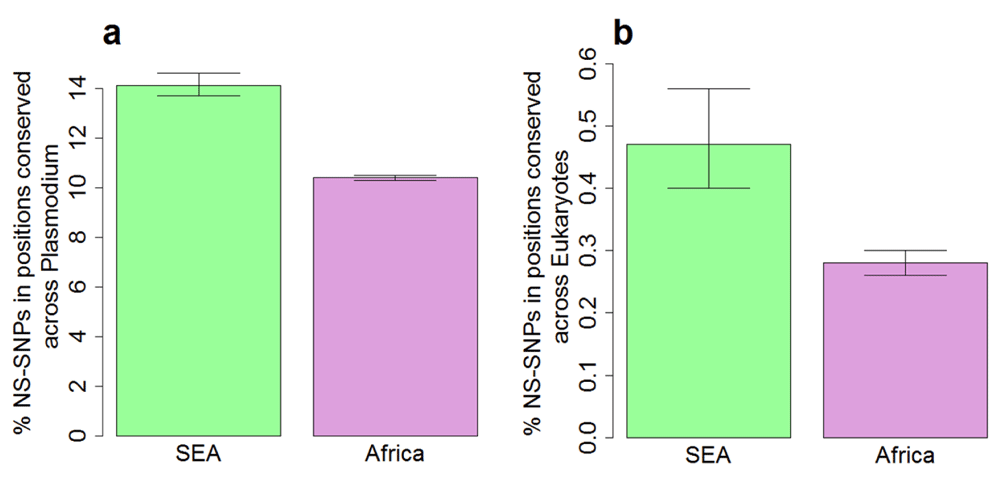
A) Conserved sites were defined as sites identical across orthologs in Plasmodium species (P. berghei, P. chabaudi, P. cynomolgi, P. knowlesi, P. reichenowi, P. vivax, P. yoelii) in multiple sequence alignment. B) Conserved sites were defined as sites identical across orthologs in diverse eukaryotes (S. cerevisiae, D. melanogaster, C. elegans, H. sapiens) in multiple sequence alignment. Error bars indicate 95% confidence intervals of the mean from 1,000 bootstrap samples.
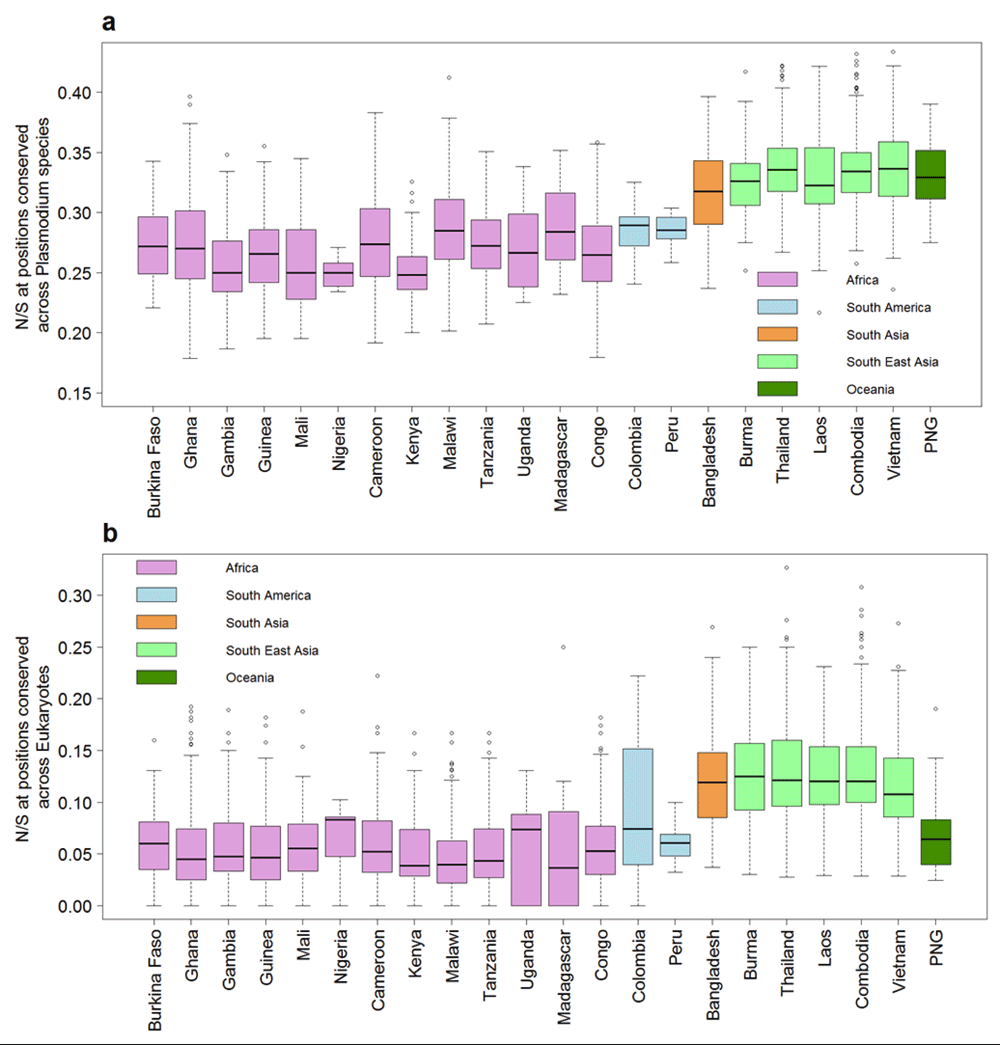
A) Box-plot showing N/S for 3394 samples from 22 countries at sites identical across orthologs in seven Plasmodium species in multiple sequence alignment. B) Box-plot showing the N/S ratio at sites identical across orthologs in diverse eukaryotes (S. cerevisiae, D. melanogaster, C. elegans and H. sapiens) in multiple sequence alignment. The y-axis is truncated at the top with 10 samples not shown in both panels.
Blood samples may contain more than one haploid parasite clone due to mixed infections by multiple genotypes. The rate of mixed infection is generally lower in areas of low-transmission such as SEA20. The lower efficiency of negative selection in removing potentially deleterious mutations at conserved positions in SEA could result from lower competition between parasite clones in the hosts. Indeed, the estimated rate of mixed infections, detected by a high proportion of heterozygous calls in the sequencing data, was much lower in South-East Asia compared to Africa (Figure 6).
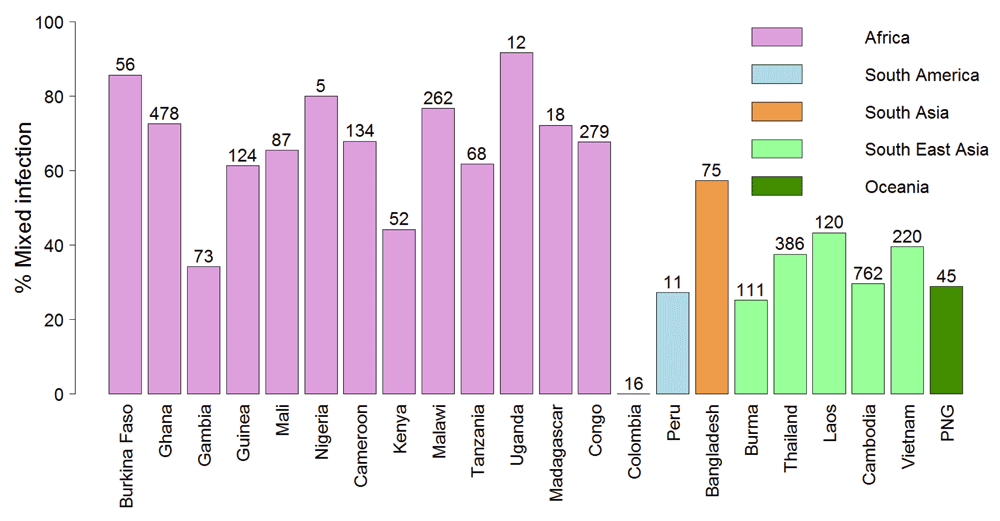
Mixed infection defined as samples with >10% SNP calls as heterozygous. This cut-off was determined from the distribution of heterozygous SNPs across the samples (Supplementary Figure 2). The numbers of samples from each country are shown at the top of bar plots.
Based on our observations that P. falciparum from SEA shows 1) a higher ratio of non-synonymous to synonymous polymorphism 2) a higher proportion of non-synonymous polymorphism at conserved sites and 3) a lower rate of mixed infections, we propose a model for the higher propensity of SEA populations to acquire drug resistance (Supplementary Figure 1). Lower mixed infections in SEA may allow even less-fit parasites to be transmitted to the next set of hosts due to reduced level of intra-host competition between multiple genotypes. Thus, fitness-reducing mutations including drug-resistance mutations might have a higher chance of spreading in SEA. In contrast, the higher mixed infection rate in Africa may drive more intense competition between genotypes within the host, and may therefore reduce the probability of transmission of less-fit parasites.
This model can explain some surprising observations and predicts conditions under which resistance might spread to Africa. The much larger population size of P. falciparum in Africa, as also evidenced by high rate of mixed infection (Figure 6) should make it easier for resistance mutation to appear. Indeed, artemisinin resistance mutations in Kelch13 were observed in 10 samples from Africa, including two samples with the most common artemisinin resistance mutation C580Y18. The C580Y mutation is capable of generating artemisinin resistance in vitro in the NF54 parasite strain considered to be of African origin21. This raises an important question as to why artemisinin resistance is not spreading in Africa. Since artemisinin resistance is likely to incur a fitness cost in the drug-free environment22–24, we propose that strains with these mutations are continuously arising in Africa but get competitively removed by the more fit drug-sensitive strains23. However once a strain acquires compensatory mutations that may reduce the fitness cost of the original mutation, it may be able to spread in a more competitive environment in Africa. While compensatory mutations can occur anywhere in the genome and may even spread in South-East Asia, these could be unlinked by recombination in areas with high transmission rate such as Africa25. Thus, compensatory mutations in the same gene might be more likely to spread in high-transmission areas. Indeed, drug-resistance genes often acquire multiple mutations before spreading to Africa, e.g. pyrimethamine resistance gene dhfr acquired at least three different mutations in South-East Asia before it spread to Africa9. All chloroquine resistance strains have the K76T mutation in CRT (chloroquine-resistance transporter) but are accompanied by a number of mutations in the same gene26. While at present Klech13 does not appear to have multiple mutations27, it would be critical to monitor the acquisition of additional mutations in the Kelch13 protein which might compensate the fitness cost of Kelch13 resistant mutations in the drug-free environment.
It is important to note that higher N/S in SEA populations does not necessarily imply higher mutation rate. Brown et al. previously found similar substitution rates in samples from Africa and SEA28. Thus substitution rate in SEA population appears to be similar to that of African populations, but a higher fraction of those substitutions occur at conserved non-synonymous positions in SEA populations. The MalariGEN study from where we obtained the dataset reported much higher density (per sample) of both synonymous and non-synonymous polymorphisms in Africa compared to SEA18. It is also important to note that higher density of SNP/sample does not imply higher substitution rate in Africa, rather it reflects the higher rate of mixed infection in Africa, i.e. more SNPs are identified in samples from Africa because of the higher number of different parasite clones per samples (Figure 6). While our data suggest that differences in the selective constraints on P. falciparum strains from SEA and Africa may contribute towards the higher propensity for resistance emergence and spread in SEA, other factors such as differences in the drug pressure, usage of artemisinin mono-therapy, social factors and host immune factors may also be important3,4.
Resistance to chloroquine and sulphadoxine-pyrimethamine spread from SEA to India to Africa4. Interestingly we observed higher mixed infection rates in Bangladesh than in neighboring SEA. The Indian subcontinent has areas with widely variable transmission rates1. This might allow drug-resistant P. falciparum evolved in low transmission areas in SEA to gradually adapt to higher transmission areas in the Indian subcontinent, which could then spread to the high transmission areas in Africa. Therefore, it would be critical to track the spread of artemisinin resistance in the Indian subcontinent.
The SNP data of P. falciparum was obtained from the MalariaGen community webpage (https://www.malariagen.net/data/p-falciparum-community-project-jan-2016-data-release)18. The SNP data consist of filtered and high quality 939,687 exonic SNPs with 631,715 non-synonymous and 307,972 synonymous SNPs. The data comprised 3,394 samples from 22 countries, with roughly equal number of samples from South-East Asia (1,600 samples) and Africa (1,647 samples). The N/S ratio for each sample was obtained by dividing the number of non-synonymous SNPs by number of synonymous SNPs in that sample. Proteome sequences of P. falciparum, P. berghei, P. chabaudi, P. cynomolgi, P. knowlesi, P. reichenowi, P. vivax, P. yoelii were downloaded from PlasmoDB database and proteome sequences of S. cerevisiae, D. melanogaster, C. elegans and H. sapiens were downloaded from European Bioinformatics Institute (EBI) database. Orthologous sequences were identified using best bidirectional hit algorithm29 and aligned using ClustalO30. The conservation score for P. falciparum proteins was calculated as the percentage of positions identical across all orthologous proteins from Plasmodium species. The N/S ratio for each gene in South-East Asia and Africa was calculated by dividing the number of unique non-synonymous SNPs by the number of unique synonymous SNPs across samples from the two geographical areas. The Pearson correlation between N/S for each gene and the conservation score was calculated in R. All figures were created in R version 3.2.3. Mixed infection samples were defined as samples with >10% SNP calls as heterozygous. This cut-off was determined from the distribution of heterozygous SNPs across the samples (Supplementary Figure 2). It is important to note that this method is not likely to accurately classify each sample into a polyclonal (mixed infection) or a monoclonal sample, but the overall trend of higher rate of mixed infection in African samples compared to SEA samples is likely to be robust.
This publication uses data from the MalariaGEN Plasmodium falciparum Community Project as described in Genomic epidemiology of artemisinin resistant malaria, eLife, 2016 (DOI: http://dx.doi.org/10.7554/eLife.08714). This data is also available from the MalariaGEN website (https://www.malariagen.net/data/p-falciparum-community-project-jan-2016-data-release).
G.P.S. and A.S. conceived and designed the study. G.P.S. performed the research. G.P.S. and A.S. wrote the manuscript. All authors reviewed the manuscript.
The work is supported by J. C. Bose Fellowship to A.S. by Department of Science and Technology, Govt. of India and by an Early Career Fellowship to G.P.S. by the Wellcome Trust/DBT India Alliance (IA/E/15/1/502297).
The funders had no role in study design, data collection and analysis, decision to publish, or preparation of the manuscript.
Genome sequencing was performed by the Wellcome Trust Sanger Institute and the Community Project is coordinated by the MalariaGEN Resource Centre with funding from the Wellcome Trust (098051, 090770).
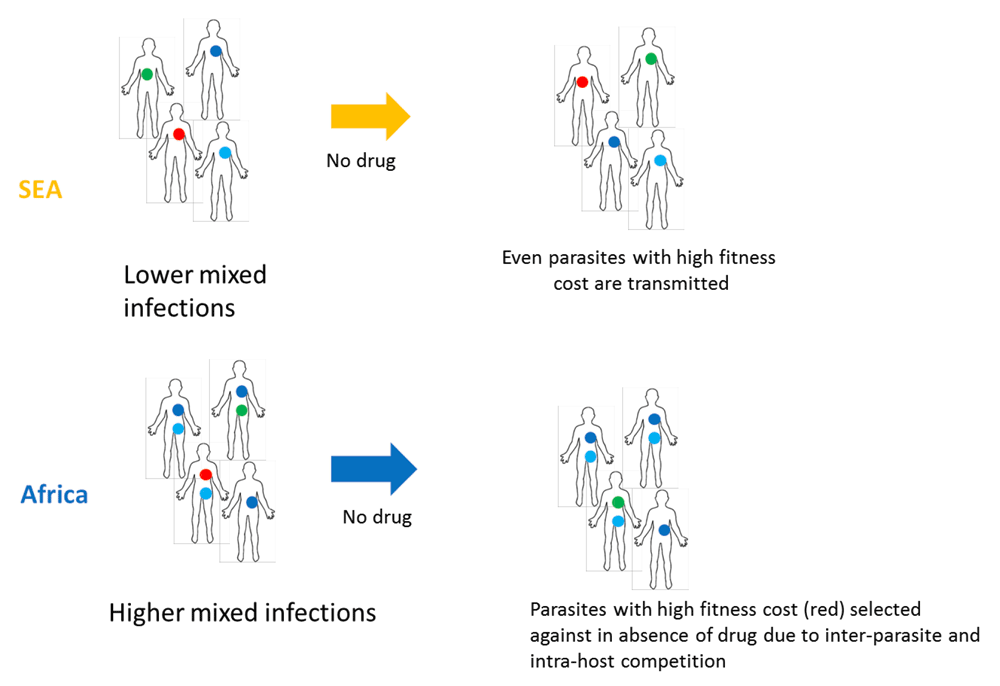
Lower mixed infections in SEA may allow even less-fit parasites to be transmitted to next set of hosts due to reduced level of intra-host inter-parasite competition. Thus, fitness-reducing mutations including drug-resistance mutations might have a higher chance of spreading in SEA. In contrast, the higher mixed infection rate in Africa may drive more intense inter-clone competition within the host, thereby reducing the probability of transmission of the less-fit clones, including potentially drug-resistant clones. The public domain image of the outline of the human body was obtained from https://en.wikipedia.org/wiki/File:Outline-body.png.
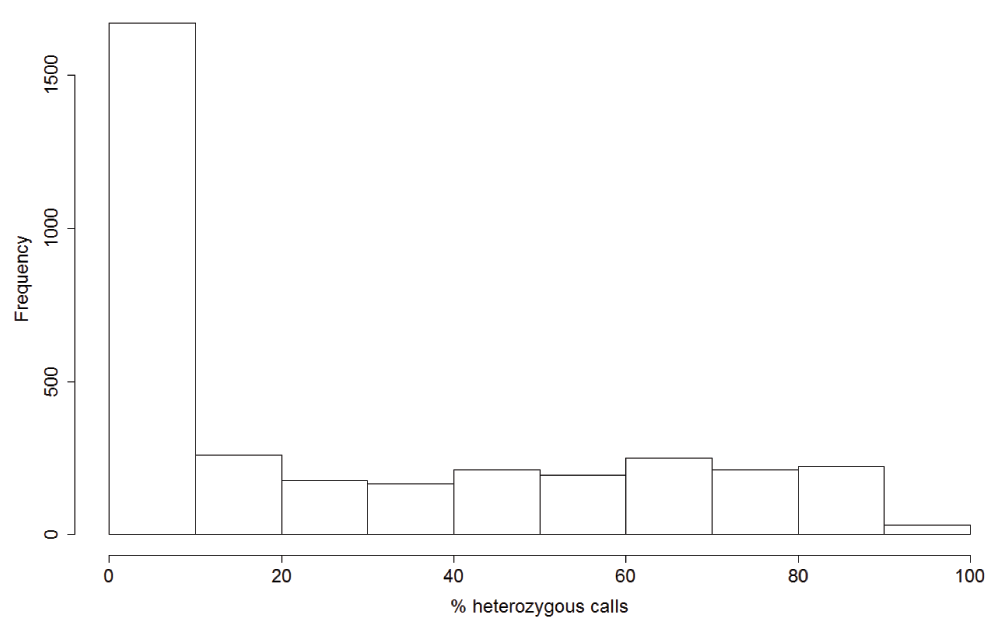
About half of the 3,394 samples showed percentage heterozygous calls less than ten percent and were defined as monoclonal. Rest of the samples showed roughly uniform distribution of percentage heterozygous calls and were defined as polyclonal (mixed infection).
| Views | Downloads | |
|---|---|---|
| F1000Research | - | - |
|
PubMed Central
Data from PMC are received and updated monthly.
|
- | - |
Competing Interests: No competing interests were disclosed.
References
1. MalariaGEN Plasmodium falciparum Community Project: Genomic epidemiology of artemisinin resistant malaria.Elife. 2016; 5. PubMed Abstract | Publisher Full TextCompeting Interests: No competing interests were disclosed.
Competing Interests: No competing interests were disclosed.
Competing Interests: No competing interests were disclosed.
Alongside their report, reviewers assign a status to the article:
| Invited Reviewers | ||||
|---|---|---|---|---|
| 1 | 2 | 3 | 4 | |
|
Version 2 (revision) 21 Oct 16 |
read | |||
|
Version 1 12 Aug 16 |
read | read | read | read |
Provide sufficient details of any financial or non-financial competing interests to enable users to assess whether your comments might lead a reasonable person to question your impartiality. Consider the following examples, but note that this is not an exhaustive list:
Sign up for content alerts and receive a weekly or monthly email with all newly published articles
Already registered? Sign in
The email address should be the one you originally registered with F1000.
You registered with F1000 via Google, so we cannot reset your password.
To sign in, please click here.
If you still need help with your Google account password, please click here.
You registered with F1000 via Facebook, so we cannot reset your password.
To sign in, please click here.
If you still need help with your Facebook account password, please click here.
If your email address is registered with us, we will email you instructions to reset your password.
If you think you should have received this email but it has not arrived, please check your spam filters and/or contact for further assistance.
Comments on this article Comments (0)