Keywords
animal models, neuropathic pain, erythropoietin, nerve regeneration, neuritis, tissue repair, hydrogel, nerve block, morphine resistance, refinement
animal models, neuropathic pain, erythropoietin, nerve regeneration, neuritis, tissue repair, hydrogel, nerve block, morphine resistance, refinement
The development of chronic neural pain following soft tissue injuries in humans is an uncommon but disabling complication1–5. The persistent pain usually begins gradually, continuing for months to years. The typical initiating causes of the antecedent soft tissue injuries include blunt trauma, strains, surgery, industrial injuries, radiation, fractures, vibration, and repetitive motion6–16. Disuse also contributes to the tissue matrix stiffness, edema and pain17. Despite a common history of trauma, a trauma-specific neural lesion or occult nerve injury are seldom recognized. The existence of an occult neural lesion has been implied in the initiation and the maintenance of neuropathic pain18. In the absence of an identified neural lesion, many of these patients have been hypothesized to have a peripheral neural “generator” or an “ectopic” site of localized inflammation19–30.
The perceived absence of a specific neural injury site does not mean these patients lack such a lesion; these lesions may be “clinically invisible” and below our current level of detection31. These patients usually have no clinical evidence of either neural injury or physical abnormality18,32. The persistence of pain behaviors in these individuals argues in support of a local neural activation site. In vivo peripheral nerve imaging techniques33–39 and diagnostics are presently being developed40,41; however, they cannot yet detect abnormalities in small branches of the distal peripheral nerves18, which are the fibers most likely to be affected in soft tissue injuries.
A logical cause for the gradual appearance of chronic pain following soft tissue trauma is the predictable changes that occur during the tissue repair process at the affected site. These changes involve the removal of debris, fibrosis, and the regeneration of damaged tissue, including muscle, nerve, vasculature and extracellular matrix. The remodeling of tissue may result in nerve compression, with delayed onset of pain42. One such example of the ability of minimal pressure on the nerve causing severe pain, is trigeminal neuralgia, where even micro-compression of the nerve root can cause severe pain43. The timing of the onset of chronic neuropathic pain parallels tissue morphologic events that occur during healing and tissue remodeling of the affected area (Figure S1: Tissue repair comparison chart)44,45. We hypothesize that it is during tissue remodeling that an accumulation of matrix and possibly local edema alter the neural microenvironment46 and contribute to the compression of vulnerable nerve cells, resulting in focal neural injury. These injuries cause atypical matrix forces then abnormal function47 of peripheral glia and neurons48, resulting in subsequent pain syndromes. To test this biophysical hypothesis we have created a model of a discrete focal lesion in the rat rear limb that recreates clinical findings found in humans.
Doubts have been raised about whether or not rodents can represent the human condition in neuropathic pain because few effective analgesics have been discovered using them1,49. We consider the social behaviors50, tissue healing51,52 and the similar evoked neural pain behaviors that humans share with rodents as confirmative to the relevance for their use. Two other crucial factors we used were the rodent’s correlated mature human age and the clinical relevance of the biologic pathophysiology embodied by the model1,53. Presently, animal models with neuropathic pain behaviors are created using forms of direct surgical nerve trauma or open surgery with neural irritation using chemicals, drugs, cold or heat54,55. The most commonly used of these are the Spinal Nerve Ligation (SNL) model56, the Chronic Constriction Injury (CCI) model57, and the Spared Nerve Injury (SNI) model58. These models use ligations, neurectomies or a combination to create pain with sensory and motor debility. While these open surgical models are useful in mimicking direct nerve trauma, they do not reproduce the pathophysiology of the delayed onset of neural pain without debility, as usually happens in many patients with neuropathic pain.
This biomimetic neural pain model is based on clinical observations of patients with soft tissue injuries followed by persistent pain. Many of them were treated with a specific localized nerve block for a regional pain, after a detailed neuroanatomic examination of their involved peripheral nerves (MRH physician practice 1987–2016). The NeuroDigm GEL™ Model uses a known physiological tissue process to create an occult chronic mononeuritis as seen in these patients.
The protocol was approved by the Institutional Animal Care and Use Committee of NeuroDigm Corporation (IACUC permit number 1-2014/15) and was in compliance with the guidelines of the 8th edition of Guide for the Care and Use of Laboratory Animals. All efforts were made to minimize the number of animals used, and pain and suffering. NC3Rs ARRIVE guidelines for reporting on animal research were followed (Supplementary file S2).
Thirty-seven Sprague Dawley 9.5-month-old male rats (an outbred strain from Harlan facility in Houston, Texas) were received, after being raised within their normal social groups. Their initial weights ranged from 440 to 660 grams, with a mean of 545 grams. In this study, the rats’ human equivalent age is as a mature adult59–61. The rats had no prior drug exposure. A total of 37 rats were received with 36 rats enrolled after baseline testing. Three rats were removed from study for complications, with 33 finishing study.
Ventilation and housing were in compliance with the guidelines of the 8th edition of Guide for the Care and Use of Laboratory Animals. Each rat was housed singly in clear, open cages in the same room. The room and individual cages had ammonia sensors (Pacific Sentry). No other animals or rodents were housed in the facility. The cages were changed out every 2 weeks or earlier. Bedding was 0.25-inch corncob pellets. Food was LabDiet 5V5R with low phytoestrogens, continuous access. Light-dark cycle was 12 hours, with lights off from 7 PM to 7 AM, except when screening. Maximum lumens at cage level were 20–40; at time of pain behavior testing the maximum lumens were 85–100. The room had no high frequency interference detected (Batseeker Ultrasonic Bat Detector), other than that related to the rats on weekly and as needed testing. Water used was municipal water. In each cage, enrichments were 1) a non-plasticized polyvinyl chloride tube 4” in diameter by 6” in length (Bisphenol A free) for shelter and 2) bedding at an increased depth of 0.75 to 1 inch when dry, to encourage burrowing. Facility was in north Texas. All pain behavior testing were performed in the same room as the rats were housed.
After receiving, the rats were acclimated for 15 days with baseline testing (Figure 1). The rats were housed singly to limit fighting and rough play. The rats were randomly assigned to one of three groups: GEL procedure, sham procedure, or control (no procedure). The investigator performing the procedures and behavioral testing was blinded to the rat group assignment. Another experimenter did the random group assignment, before the initial procedures. The rats were housed in a separate room during the procedures and handed to the investigator by an assistant. Tail identification was masked prior to performance of the procedures. The investigator did not know the group assignments at any time, until the unblinding on post procedure day 149. The locations of the animals on the rack were randomly changed every 10–14 days. Isoflurane 2–3% was used for anesthetic induction and during the procedure for approximately 2 minutes. Isoflurane gas was used due to brief anesthetic time needed, enabling less recovery time compared to most injectable anesthetics. Four analgesics, morphine, celecoxib, gabapentin and duloxetine, were screened three times each during the 5-month study. The screening involved testing the plantar hindpaws of the rats with stimuli used to detect mechanical allodynia and mechanical hyperalgesia. Each rat was tested singly on a wire mesh with manual application of stimuli, for all behavior testing. The behavioral testing was performed between 1 PM and 11 PM. Animal welfare observations of behavior, coat and movement were checked daily. Monitoring for signs of infection, water and food use were conducted at least three times a week. Weights were monitored every 4 weeks, or every 2 weeks as indicated. The same female investigator performed all procedures and screenings, with no one else in the room. Subcutaneous injections rather than oral gavage were used for analgesics, as they are less stressful. A pilot study, blinded during pain behavior testing, was performed on the effect of a localized application of a human recombinant erythropoietin analog (EPO) injected near the GEL™ neural procedure site on post procedure day 152, followed by behavioral testing on days 153–160.
We tested the null hypothesis62 that the GEL procedure does not differ from the control group during the 5 months after procedure on the dependent variables of paw withdrawals in response to von Frey fibers, a camel-hair brush, and pinprick. The alternative hypothesis was that, over time, there is a difference between the groups. The experiment was designed to discover the smallest biologically important effect, optimizing the number of animals used63.
We conducted a power analysis based on data from previous rat experiments with the GEL model to detect a difference between the GEL group and control group with an unpaired t-test if the difference was 1 paw withdrawal and the standard deviation was 0.5 paw withdrawals. We concluded that a minimum sample size of eight per group would yield 95% power with a two-tailed Type I error rate of .05. An additional three animals per group were added to compensate for a possible loss of sample size during the 5-month study, and an additional four animals were added to the GEL group for illness over time, technical complications, and a pilot study with local EPO. GEL n = 14, control n = 11, sham n = 8 were the final sample sizes.
Percutaneous injectable procedure for GEL and sham. During isoflurane anesthesia the percutaneous injection procedures were performed. The hydrogel used in the GEL group was the proprietary biological NeuroDigm GEL™, that is composed of purified biocompatible tissue-derived by-products and peptides of mammalian soft tissue, as found in the perineural tissue milieu after a soft tissue injury. Such injectable implant products are used in human surgeries, dermal procedures, and wound healing, with rare reactions of acute inflammation. Purified biological proteins and hydrogels are normally absorbed over days to weeks by the tissues into which they are implanted, and are rarely antigenic64,65. The hydrogel we used was introduced within the left (ipsilateral) tibial neural tunnel below the popliteal area at mid lower leg, with aseptic technique. First, the skin was pierced with a sterile 19 gauge needle tip; then a sterile, custom tapered, blunted 21 gauge hollow probe entered the skin puncture site to gain access to the tibial nerve tunnel (U.S. patents 7015371, 7388124). Since older confined rats normally have less passive knee extension, a distal to proximal neural tunnel access was used in this study. The point of the probe’s percutaneous entry was over the Achilles tendon. The probe then advanced subcutaneously in a caudal direction; then it pierced the fascia between the distal origins of the medial and lateral gastrocnemius muscle and entered the anatomic tunnel posterior to the tibialis posterior muscle and medial to the soleus, where the tibial nerve courses. Upon entering the neural tunnel, the probe was softly glided in avoiding resistance or nerve contact. In the mid-tibial tunnel of the lower leg 0.3 cc of the GEL™ or the shams’ Ringer’s lactate was deposited, and then the probe was withdrawn, with the rat placed in a cage for observation.
Procedures to elicit neuropathic pain behavior. The primary outcome measure was the average number of paw withdrawals to each of five stimuli applied eight times to each plantar mid hindpaw of a rat. Each stimulus was applied first to the contralateral hindpaw, then to the ipsilateral side of the GEL and sham procedure. Time between each stimulus application was usually 2–4 seconds or longer. For each stimulus the total number of each hindpaw withdrawals was recorded as a data point.
Measures of mechanical hypersensitivity were chosen for this analgesic study. These measures are the most commonly used in rodent screening for analgesics and also commonly used in humans. Further behavioral characterization of this model is planned.
Non-noxious light touch: for static mechanical allodynia von Frey filaments (Semmes Weinstein Mono-filaments North Coast Medical TouchTest®) exerting confirmed forces of 2 grams, 6 grams and 10 grams were used, tips smooth. Dynamic mechanical allodynia was tested with a fan sable brush (09004-1002; Dick Blick Art Materials). The stimuli were applied in the order of: von Frey 2 g, 6 g, 10 g, then brush. Each von Frey stimulus was applied for approximately 1 second until the fiber bent, or the paw was withdrawn. The brush was stroked gently from rear to front of the plantar hindpaw.
Noxious light touch: mechanical hyperalgesia was tested with a custom sharp non-penetrating plastic point calibrated to elicit 2–4 paw withdrawals at baseline. This pinprick stimulus tip was touched to the plantar site until the paw withdrew or the skin visibly indented. Each stimulus lasted about 1 second.
Analgesics administration. The analgesics were administered by subcutaneous injection (27 g 1.5”) over the dorsal lower back and proximal thighs, with a custom administrator-held restraint device to reduce handling and stress. Morphine sulfate (West-Ward) was mixed with normal saline and administered at a dose of 3 mg/kg 1 hour prior to screening the analgesic. The vehicle used in mixing the following three drugs was 0.25% methylcellulose (Methocel® A4MPremium LV USP). These three drugs were mixed 24–48 hours prior to use. Celecoxib (Cayman Chemical) was dispensed at a dose of 10 mg/kg 1 hour prior to screening; gabapentin (Cayman Chemical) was dispensed at a dose of 25 mg/kg 2 hours prior to screening; and duloxetine (Cayman Chemical) was mixed (mechanically agitated) and administered at a dose of 10 mg/kg 2 hours prior to screening. The experimenter knew the drugs being screened; the identity of the groups were blinded throughout experiment. The injected volume of each drug was less than 1.2 cc.
The original doses chosen for gabapentin and duloxetine had adverse effects in this study of aged mature rats, interfering with the testing of pain behaviors. Gabapentin at 60 mg/kg had marked ataxia in all rats, with their hindpaws not staying on testing screen due to lumbering gait and falls. Duloxetine at 30 mg/kg was noted for marked “frozen” hypoactive posture, with increased tone and alertness (no central sedation) to normal handling and testing. After duloxetine was given at this dose, paw withdrawals were not elicited in any of the three groups. Due to these adverse effects, lower doses were tested and used, as described above. These lower doses had no observed drug side effects and improved the ability to test paw withdrawals66.
Epoetin alfa (EPO) by Amgen, a recombinant human erythropoietin analog at 2000 units/mL, was diluted 1:3 with normal saline, and 0.3 cc vol., 200 units, was the administered dose in the pilot study. After the main experiment was over the 14 GEL procedure rats continued in a pilot study for 8 days beginning on day 152, with days 140, 149 and 152 taken as baseline days. Three subgroups were picked randomly and the experimenter was blinded during screenings for pain behavior. On day 152 under isoflurane, as described prior, the "EPO at site" group (n = 5) received an injection of 200 units of EPO at the site of the original GEL procedure on the ipsilateral leg. The “EPO SC” group (n = 4) received the same EPO injection subcutaneously by dorsal low back, and the “No EPO” group (n = 5) received no injection. The original “EPO at site” injection approach was ipsilateral (left) posterior-to-anterior at mid tibia through the bellies of the gastrocnemius muscle aiming for the tibial nerve tunnel. Pinprick behavior data were collected on days 153, 154, 156, 159, and 160.
Two of the five “EPO at site” rats had no decrease in paw withdrawals with the original technique of the EPO injection. These two rats had an adapted lateral approach of the injection of 200 units of EPO to improve localization of the perineural infiltrate near the original ipsilateral GEL™ procedure site. This adapted injection was on the ipsilateral side, through the lateral gastrocnemius muscle targeted to the mid tibial tunnel at lower leg.
At the conclusion of the study, three rats were chosen randomly from each of the three groups: 1.) GEL procedure rats 2.) sham procedure rats of the 5/8 that displayed late onset robust pain behavior, and 3.) controls. The selection from the GEL group contained two rats that were controls in the EPO pilot study, and one that had received the subcutaneous EPO injection, all with no change in pain behavior noted. The animals were anesthetised, and then perfused with Lactated Ringer’s solution (Hospira), followed by perfusion fixation with 4% paraformaldehyde (PCCA Professional Compounding Centers of America) in Phosphate Buffered Saline (PBS) (Electron Microscopy Services). Following fixation, the lower limb on the ipsilateral side was grossly dissected to reveal the gastrocnemius muscle thus providing a landmark for locating the tibial nerve. Once identified, the distal tibial nerve (below the popliteal area) was dissected free of the surrounding muscle and fascia, and placed into ice-cold 4% paraformaldehyde in PBS for overnight incubation. The following day the paraformaldehyde solution was replaced with 30% sucrose (IBI Scientific) to cryoprotect the tissue. The cryoprotected samples were embedded in Tissue-Tek OCT (Sakura Finetechnical, Japan) and frozen on dry ice. Cryosections (10 μm) were then prepared and mounted onto SuperFrost Plus slides (Fisher Scientific, Rockford, IL). Sections were then fixed in 10% Neutral Buffered Formalin for 10 minutes, washed for 5 minutes in 1X PBS to remove OCT, and rinsed with tap H2O. Subsequently, sections were then stained in Hematoxylin (Fisher Scientific) for 5 minutes and rinsed with tap H2O, differentiated in acid alcohol (1% HCl in 70% EtOH) for 30 seconds and rinsed extensively with tap H2O, blued in 0.2% aqueous ammonia, rinsed with tap H2O, and stained with eosin (Fisher Scientific) for 1 minute. Sections were then dehydrated by sequential submersion in graded 75%, 95%, 100% EtOH for 5 minutes each, and a final submersion in xylene. The slides were air dried before mounting with Permount (Fisher Scientific) and adding coverslip. Sections were viewed and the images captured on a Nikon 80i microscope, outfitted for digital light micrographs.
Pain behavior statistical analyses. As described in detail in the results section, the data were inspected for compliance with the assumptions of ANOVA. Two areas of concern were noted, particularly the heterogeneous variances in the pinprick data and the very large number of pairwise comparisons that could be compared. The former occurred because (a.) GEL animals that developed pain symptoms tended to score a maximum number of withdrawal responses (8) out of the possible number of stimuli presented (8) leading to some cells with very small or zero variance in the GEL group only, and (b.) the animals in the sham group were not homogeneous in their response to the sham procedure and this greatly increased their variance. We proceeded with the ANOVA for pinprick because of the convenience of describing interaction effects and for comparison with the allodynia data. We note that the pinprick variable was the least likely to generate errors of inference because of the very large effects and consequent minuscule p values obtained. Individual sham data are plotted in a separate graph to illustrate the problem there. Type I errors were reduced by testing only planned comparisons among a relatively small number of means and by combining data where appropriate before analysis so that fewer comparisons would be made.
Analyses of the paw withdrawals in response to von Frey fibers, the brush, or the pinprick on the routine test days were conducted using a mixed model ANOVA with one between groups factor (eleven controls, fourteen GELs, and eight shams) and two repeated measures factors. The first repeated measures factor was the time the data were collected, with an average baseline period of 4 days prior to the procedures and the five 30-day periods, referred to as post procedure Monthly Periods 1 through 5 (P1, P2, P3, P4, P5), following the procedure (Figure 1). For analyses, the data point for each animal in each monthly period was the mean of at least four routine pain behavior testing days during that month. The second repeated measures factor for the von Frey fiber analysis was a composite factor combining the three levels of fiber force (V1, V2, V3) and the two sides for a total of six levels of different forces tested on bilateral hindpaws. Differences owing to fiber force and sidedness were determined by comparing means with planned comparisons. The second repeated measures factor for the brush and pinprick were the bilateral hindpaws. In the global ANOVA, a p value of <.05 was considered significant. Except for the von Frey analysis, planned comparisons were conducted using Fisher's Least Significant Difference test after a global ANOVA was determined to be significant at the .05 level with a two-tailed test (Dataset was used in all analyses).
Analgesic statistical analyses. Experiments were conducted with four analgesic drugs administered shortly before the usual testing with von Frey fibers, the brush, and the pinprick. The four drugs were each tested three times during the post procedure period from day 28 to day 149. The effects of the analgesic drugs were analyzed on two dependent variables instead of five (allodynia measures averaged together as one variable and the hyperalgesia measure of pinprick as the other). The data were analyzed using a mixed model ANOVA with the three groups as a between-subjects factor and side (left or right) and days (three pairs of pre-drug and analgesic drug days) as repeated measures factors. The effect of the analgesic drug for each pair of days was analyzed using planned comparisons. These comparisons used Fisher's Protected Least Significant Difference test if the corresponding F-ratio was significant or used a Bonferroni-protected contrast if the F-ratio was not significant. All tests used a two-tailed significance level of .05.
All rats had recovered from anesthesia within 5 minutes and were walking normally without altered gait. Following recovery from anesthesia the subjects did not demonstrate observable pain behaviors67 nor clinical evidence of tissue injury. Throughout the duration of the study all the rats were observed to have normal gait and were without visible evidence of inflammation, swelling, weakness, deformities or positional changes noted on the operated hindpaw, at any time. There was no observed evidence of acute nocioceptive pain, even after the procedures. Their grooming activities were normal. Among the GEL group, 14/14 rats had markedly increased paw withdrawals to pinprick, von Frey fibers and brush by day 23 post procedure; the paw withdrawals to pinprick became more exaggerated over the remaining months. By post procedure day 60, 5/8 of the sham rats had developed marked paw withdrawals. The most common pain behavior paw withdrawal reaction was a reflexive flinch. Other reactions appearing 1 month after increased pain behaviors included prolonged shaking and or licking of their affected ipsilateral paw. Similar patterns of paw withdrawal reactions occurred on testing the contralateral side as pain behavior appeared. No chewing of the paws occurred.
Results are presented below with the statistics; also see Supplementary file S3: Basic Anova for a comprehensive description of the pain behavior statistical results without drugs or EPO.
Pain behavior analyses. While the hyperalgesia in this mature GEL™ model was robust over time; the allodynia was a minor response. Before attempting a statistical analysis, we plotted the raw routine days of data (without analgesics) of each group for inspection. The robust effects of pinprick hyperalgesia were evident in the raw data graph. The small effects observed with the data of each individual allodynia stimulus (each of three von Frey fibers and the brush) indicated that an individual routine days mean in the GEL group could not reliably be expected to differ from the control group. In order to observe more reliable differences, the pain behavior data could be grouped for more samples in two ways.
First, different days of testing for each stimulus could be averaged together for an individual variable, such as data for each individual von Frey fiber averaged together over 4 testing days to make a monthly average: This method was used in the allodynia and hyperalgesia line graphs (Figure 3–Figure 5).
Second, the scores for all four allodynia measurements could be averaged together to make a summary single variable, i.e., averaging data for all three von Frey fibers and the brush into a single number representing allodynia. This method was used for allodynia in the analgesic drug response bar graphs, to compare one day of pre-drug data to one day of post-drug data (Figure 7–Figure 10).
These methods have different advantages. Plotting each day’s data is useful for determining the precise timing of when effects emerge during the long period of testing. Plotting monthly data is useful for observing the small effects that are apparent between the individual von Frey fibers. Information about effect sizes will be presented for the routine days data of the averaged variable (von Frey plus brush), and formal statistical analysis will be applied to the much smaller number of means in the monthly data for each individual variable.
Days of data pattern of allodynia and hyperalgesia after GEL procedure. The data for all routine testing days (no analgesics given) for the combined allodynia variable (von Frey plus brush, top) and for the hyperalgesia variable (pinprick, bottom) are presented in Figure 2 below. The most noticeable effect is the increase of pain behaviors in response to the pinprick in the GEL group on both the ipsilateral and contralateral sides. The pinprick hyperalgesia effect occurred in every rat subjected to the GEL procedure. Although the pinprick responses required about 23 days to develop, the symptoms, and therefore the opportunity to study those symptoms, persisted for months and showed no sign of waning by the end of the experiment. Under conditions of a null effect, each of two groups would be expected to have a greater mean than the other about 50% of the time. However, the last day on which the control group had an absolutely greater mean was for pinprick post procedure day 5 on the ipsilateral side and day 23 on the contralateral side.
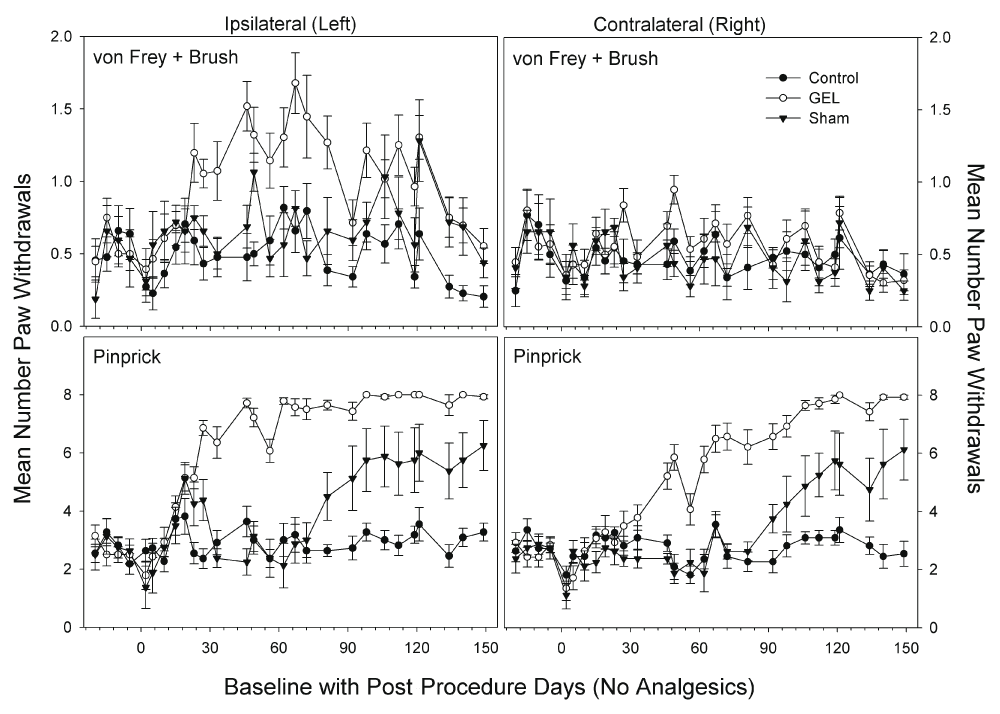
The averaged allodynia measures on the ipsilateral side were more consistently different on a routine test day basis than any of the individual allodynia measures (top: y-axis is 2, maximum is 8). Allodynia effects on the contralateral side are not obvious. Effects related to pinprick hyperalgesia were more robust and persistent than those for the allodynia measures (bottom: maximum y-axis is 8). Shams are not homogenous: 5/8 with pinprick hyperalgesia, 3/8 similar to controls.
Table 1 provides estimates of effect sizes for the GEL™ effect, which tends to increase with time. The standardized effect size was calculated as the difference between the means of the GEL and control groups on that day divided by the pooled standard deviation of the two groups. These can be used to plan future experiments depending on which interval after the procedure will be studied. Minimum sample sizes are provided to yield at least 80% power in a two-group, two-sided t-test with a Type I error rate of .05. Larger sample sizes are required to study allodynia than to study hyperalgesia. More complex designs, such as this one, which include many repeated measurements and multiple groups, will have more error degrees of freedom for the comparisons than a simple t-test, and will not require such large sample sizes for the allodynia measures.
Included are the last day that the control group mean exceeded the GEL group mean, and the inclusive days that the size of effect for the GEL group exceeded the control group by 1.94, 2.83, or 3.50 standard deviations (SDs). ES is the difference between the group means divided by the pooled standard deviation of the two groups. The calculated n is the sample size required to detect a difference between GEL and control groups of the given size for the hyperalgesia or allodynia variable on a routine test day basis in an independent-samples t-test with 80% power and a two-sided alpha of .05. Allodynia was not consistent on the contralateral side. See routine test day means in Figure 2. NA, not applicable.
Using these data, analgesic screening can start on day 23 or later with a group of n = 6 rats using pinprick (mechanical hyperalgesia) on the ipsilateral side. The effect size for hyperalgesia on the ipsilateral side was persistent at more than 1.94 standard deviations from day 23 until the end of the main experiment on day 149. Smaller effects of the GEL group were observed for the combined allodynia variable (von Frey plus brush) than for hyperalgesia with the pinprick, but, unlike the data for the individual von Frey and brush variables, the combined variable showed clear and persistent differences between the GEL group and control group on the ipsilateral side for each testing day. This is important for our subsequent experiments with analgesics. The effect of the GEL™ procedure is not constant across time. Therefore, when testing the effect of an analgesic on a single day with a control value from the same animal, the response must be compared to a control day very close in time to the day the analgesic is given rather than to the average of all control days. To do this successfully, each control day must show a positive effect of the GEL procedure, and this was not true on every day for the individual von Frey fibers or the brush alone. Consequently, we opted to use the combined von Frey plus brush data for all comparisons between individual analgesic and control days (see the section, Results of experiments with analgesic drugs, where statistical analyses of those days are provided).
In order to provide a formal statistical analysis of the individual allodynia variables, we averaged all days (at least 4) within each month that the animals were tested without analgesics to remove some of the test day variability, stabilize the means, and estimate effect sizes. These analyses are presented in the following sections.
Mechanical allodynia: von Frey analysis. The data are given in Figure 3 for the three different fiber forces in each group, over all periods applied to both the ipsilateral and contralateral sides. The highest-order interaction of the ANOVA was significant (F (50, 750) = 2.21, p < .001). The control group never significantly exceeded the baseline value in any monthly period on either side. Asterisks in Figure 3 mark means of the GEL group that were significantly different from both the GEL group baseline and the mean of the control group during the same period. The shams had no significant allodynia.
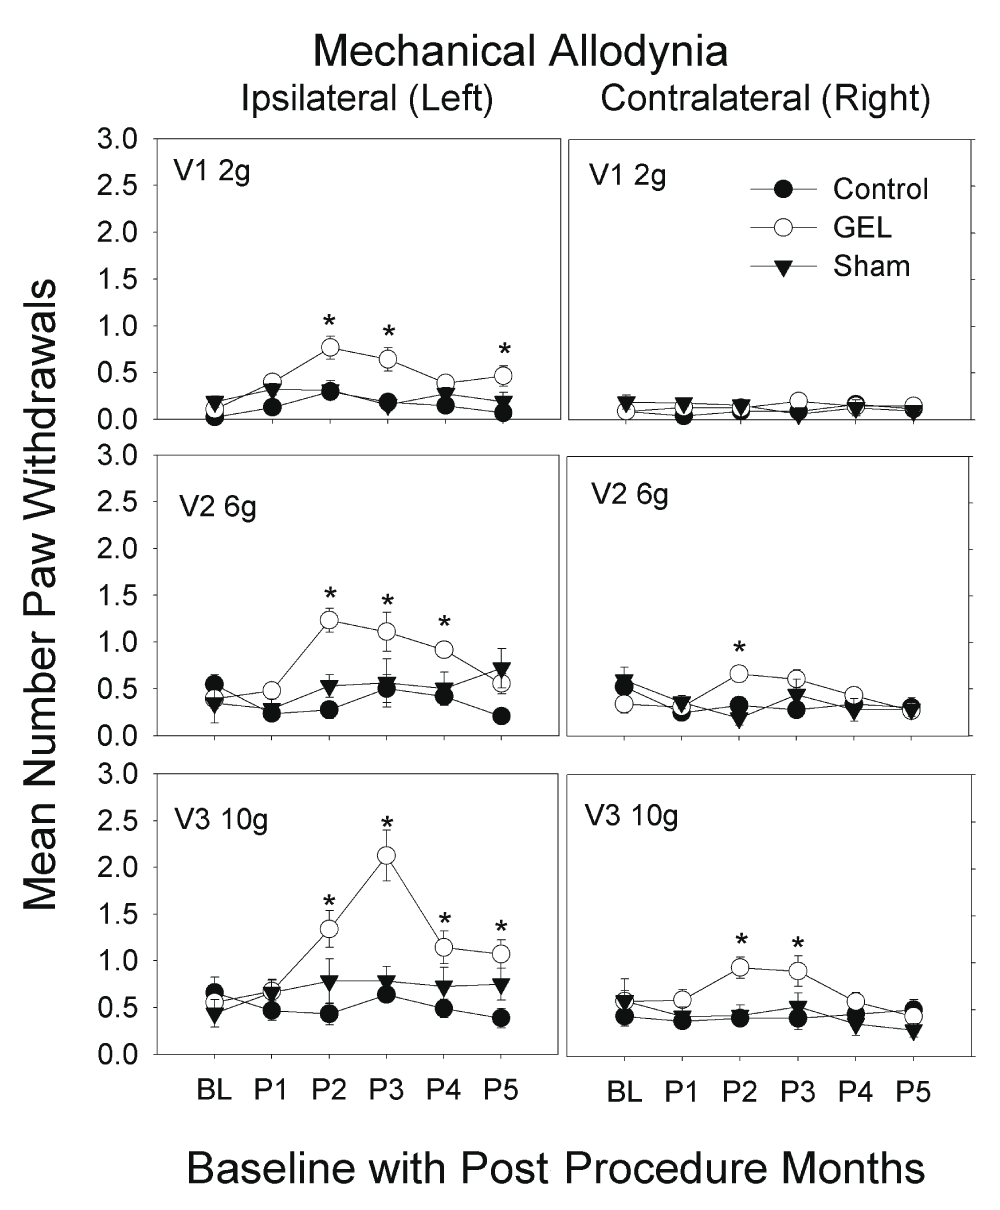
Increased pain behavior of allodynia to light touch with von Frey fibers only seen in the GEL rats, bilaterally; on the left with 2 g, 6 g and 10 g fibers, and on the right with 6 g and 10 g. This allodynia decreased after the 3rd month for all fibers with this effect. These graphs depict von Frey fiber results for paw withdrawals ipsilateral and contralateral, for all groups, for three fiber forces over 5 monthly post procedure periods (P1–P5) (maximum y-axis is 8). Mean and S.E.M. *p < .05 GEL group greater than both GEL group baseline and control group for same period. Reduced responding in the GEL group during period 5 may reflect habituation.
Mechanical allodynia: brush analysis. The GEL group showed prolonged pain behavior of dynamic mechanical allodynia to brush stimuli with increased paw withdrawals, only on the ipsilateral side. This pain behavior peaked by the 3rd month then waned, returning to near baseline by the 5th month. The shams had similar pain behavior that plateaued by the 4th month, persisting until the 5th month at end of study. The response of the shams, with the onset of the pain behavior of mechanical allodynia during the 3rd month that persisted, was not anticipated (Figure 4). The highest-order interaction was significant (F (10, 150) = 1.943, p = .044). The control group never significantly exceeded the baseline value in any monthly period on either side. Asterisks in Figure 4 mark means of the GEL group that were significantly different from both the GEL group baseline and the mean of the control group during the same period.
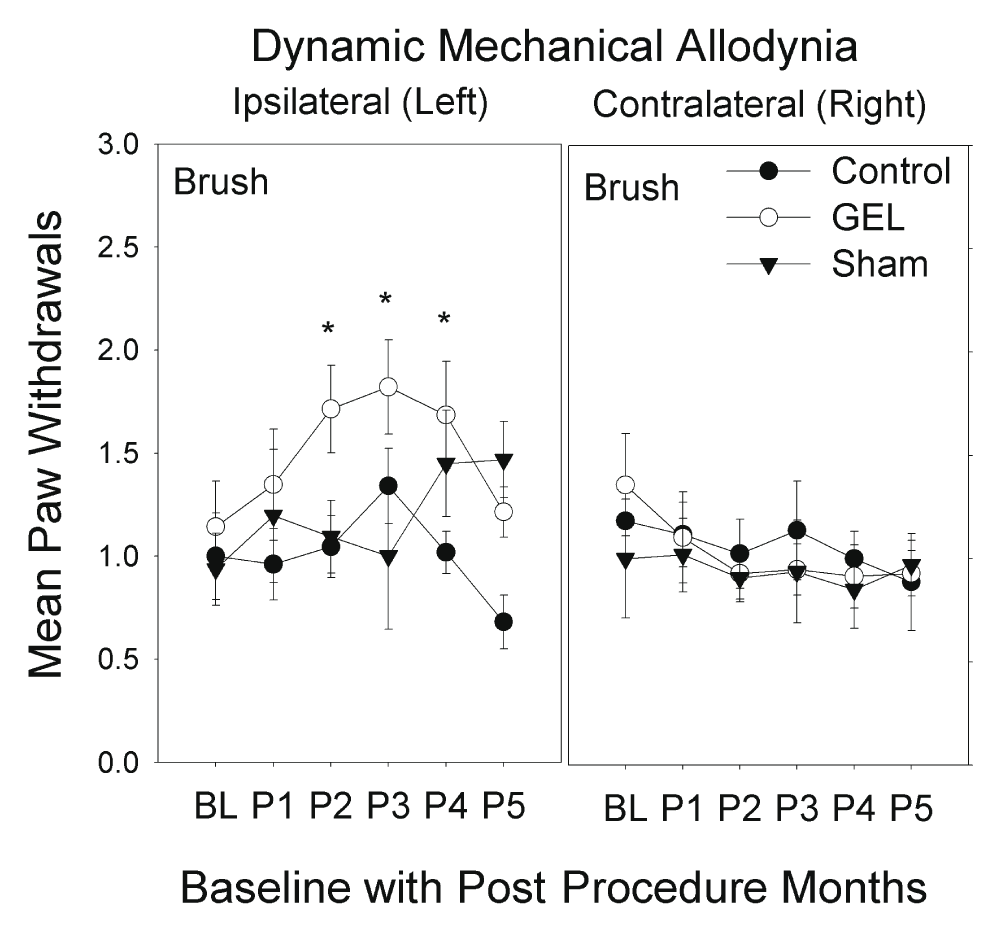
Dynamic allodynia or hypersensitivity to the brush was noted only on the ipsilateral hindpaw. These graphs depict brush results for paw withdrawals ipsilateral and contralateral to procedure over 5 monthly post procedure periods (P1–P5) (maximum y-axis is 8). Mean and S.E.M. *p < .05 GEL group greater than both GEL group baseline and control group for same period. Reduced responding on the ipsilateral side in the GEL and control groups during period 5 may reflect habituation, which is not present in the shams as their allodynia increased in P4–P5.
Mechanical hyperalgesia: pinprick analysis. The GEL group had the earliest and most persistent pain behavior of mechanical hyperalgesia with increased paw withdrawals to pinprick, bilaterally. The hyperalgesia was first present on the left side and within a few weeks present on the right side. This pain behavior was vigorous after the first month and persisted robustly for 4 months, until the end of the study. The shams had similar pinprick pain behavior bilaterally that peaked by the 4th month and persisted until the 5th month, at end of study. The control group had no pinprick pain behavior during the study.
The data for pinprick are presented in Figure 5. The highest-order interaction was significant (F (10, 150) = 4.592, p < .001). The control group never deviated from its own baseline value in any post procedure period on either side. By contrast, the GEL group’s paw withdrawal response on the ipsilateral side was significantly greater than baseline during all five post procedure periods, and the GEL group on the contralateral side was significantly greater than baseline during periods 2 through 5. Between-group comparisons for pinprick indicated that the three groups were not significantly different during the baseline period on either the contralateral or ipsilateral side. Asterisks in Figure 5 mark means of the GEL group that were significantly different from both the GEL group baseline and the mean of the control group during the same period.
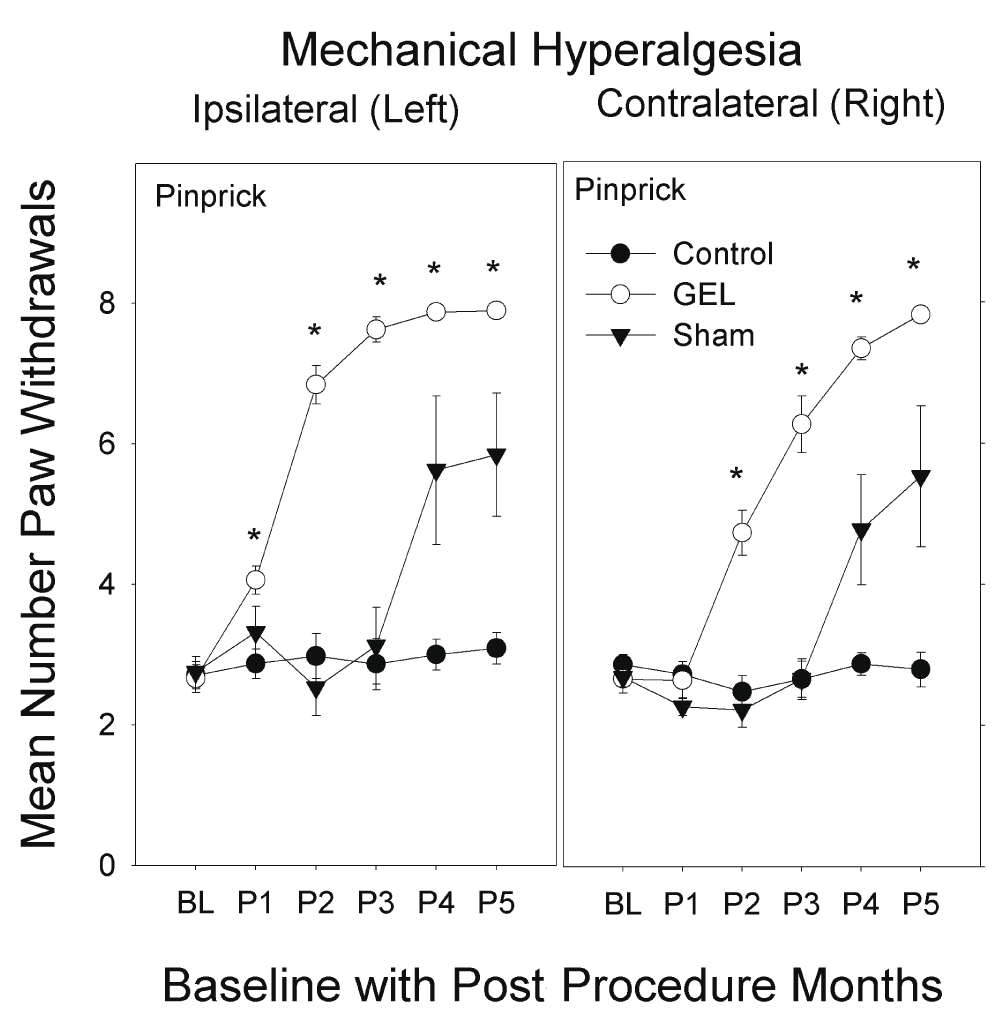
The GEL and later the sham groups developed mechanical hyperalgesia to pinprick bilaterally. In the GEL group, 2–3 weeks following the onset of hyperalgesia on the left it began to develop on the contralateral side; a similar slight delay in the contralateral onset of hyperalgesia is seen in the shams. The graphs depict the mean of all paw withdrawal responses to pinprick on the ipsilateral and contralateral sides during the 5 monthly post procedure periods (maximum y-axis is 8). Shams are not homogenous: 5/8 with pinprick hyperalgesia, 3/8 similar to controls. No habituation effect was noted.
Individual data for sham group. Retrospectively, we noted that five of eight sham procedure animals developed pain behavior bilaterally, similar to the GEL™ animals, in post procedure monthly periods 4 and 5 (after 3 months); and the three remaining sham rats behaved similarly to the control group.
The foregoing analysis did not stress any effects that might or might not be different between the GEL and sham groups. The reason for this is that the sham group itself was not homogeneous in the responses of the animals to the sham procedure. Individual data for the sham animals are presented in Figure 6. The data on the shams, in all the pain behavioral studies and in the analgesic screening, included the results from all eight shams. The probability that the bracketed five responder sham rats would separate themselves from the other three in exactly the same direction by chance in the allodynia experiment is .017 for a single day. This probability does not factor in the magnitude of the effect between responders and non-responders or the fact that they separated themselves the same way on the same two consecutive days as in the hyperalgesia experiment. This is very strong evidence that we detected ipsilateral allodynia in all of the same sham animals where we detected hyperalgesia.
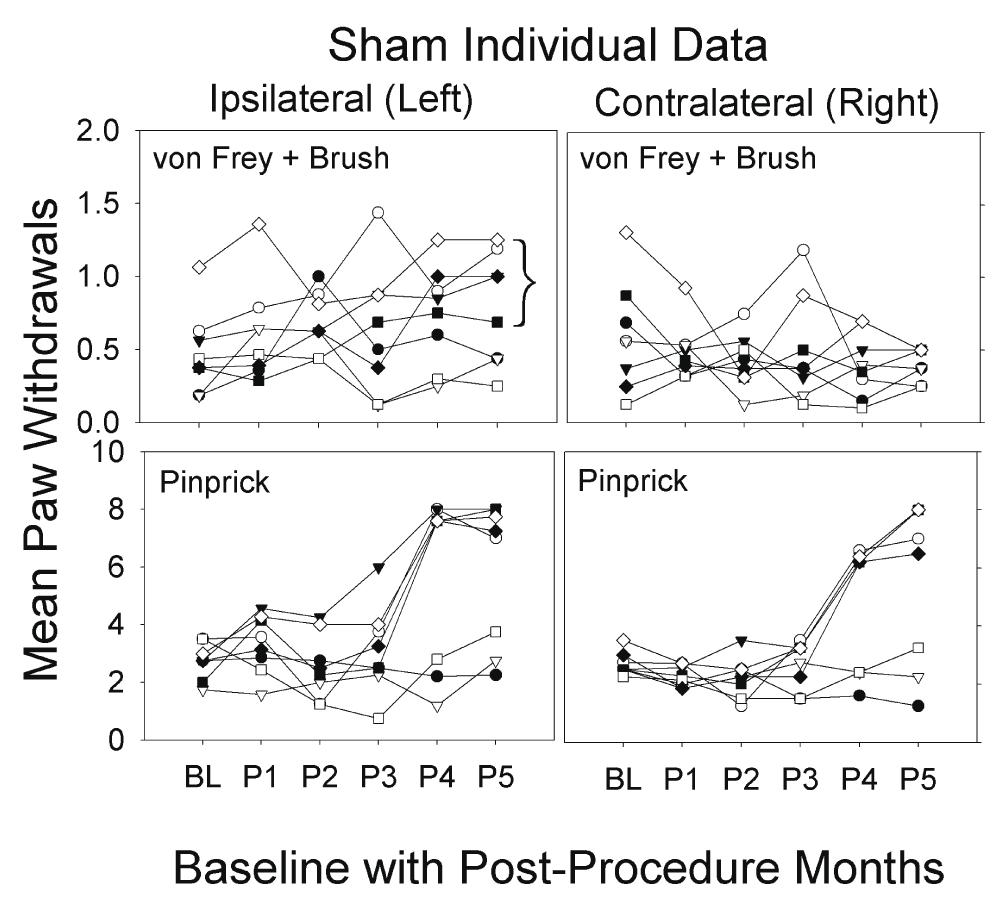
Graphs depict average of paw withdrawals for eight individual shams; the average of all responses to von Frey and brush stimuli (top) or to pinprick (bottom) over baseline and for 5 months (maximum on y-axis is 8). Pain behavior in response to pinprick on right developed 2–3 weeks after the left; 5/8 shams had bilateral pinprick mechanical hyperalgesia during the P3 month persisting until end of study. The remaining three animals resembled the control group. Bracket in allodynia graph identifies the same five responders from the hyperalgesia data. In P4 and P5 for bilateral pinprick there is complete separation between the three behaving like controls and the five behaving like GEL.
Summary of pain behaviors. For the GEL procedure group, we found that the gradual pattern of development of ipsilateral pain behaviors was usually followed with the gradual onset of contralateral pain behaviors within 2–3 weeks. In the GEL group, the light touch mechanical allodynia responses had a gradual onset after the first month, decreasing slowly after the third month (P3). Once the pinprick hyperalgesia developed in the GEL group it became robust and persisted until the end of the study.
The sham procedure also gradually induced the pain behavior of pinprick similar to the GEL procedure in five of eight rats on the ipsilateral side after day 72, followed by the contralateral side after day 90. The affected shams (5/8) with elicited pain behavior of mechanical hyperalgesia became robust after the third month (P3), persisting until the end of the study. The shams did not have a robust response to von Frey or brush stimulation. The control group developed no pain behaviors.
Factor influencing pain behavior testing. A reportable factor discovered during this study relates to the influence of hormone replacement of the experimenter on the elicited responses to stimuli. On each routine pain behavior test day, after the first six random rats were screened, the results were compared to the prior session of each rat, to observe for environmental influences. In nine such early screening comparisons, paw withdrawals were markedly less to nonexistent bilaterally in the six rats prescreened as compared to their prior screening session. Thirty minutes after the topical application to the investigator of a 17 beta-estradiol replacement cream, the screening was repeated on the same six rats, and their elicited pain behaviors were then consistent with the data collected during the prior testing period. On unblinding, this effect was not related to groups. Even baseline pre-procedure behaviors were similarly affected by the estrogen hormone replacement. All data used in this study was collected with topical estrogen applied 30 minutes prior to beginning all testing. This reaction echoes the olfactory ‘male observer’ effect of male experimenters reducing acute pain behaviors in rodents, as compared to females68; and suggests that besides their sex, the age and hormonal status of experimenters may influence the reproducibility of pain behaviors.
To control for the effects of time, it was important to compare the data for each analgesic’s screening day to a single pre-drug control day, prior to the drug’s administration. As illustrated in the top part of Figure 2, an effect on the GEL group’s ipsilateral side was apparent on individual control days when the paw withdrawals for all four allodynia measures were averaged together into one variable. For that reason, we analyzed only the composite allodynia variable and the pinprick for responses to the analgesics. The data for each analgesic drug are displayed in the figures as bars for the mean response, with the analgesic drug on a particular day (the days listed in the x-axis label) paired with the respective control data from the routine test day one to four days prior. Throughout the following analyses, the mean number of paw withdrawals in the GEL group on the ipsilateral side was significantly greater than that of the control group on all pre-drug days for both the von Frey plus brush variable and for the pinprick.
Morphine. Morphine sulfate at 3 mg/kg had an escalating loss of effectiveness bilaterally, which was not due to tolerance as each of the three doses were at least 30 days apart. Morphine at 3 mg/kg is usually a toxic dose in humans. The data for the morphine test days using the von Frey fibers and brush are presented in the top half of Figure 7. The ANOVA revealed that all main or interaction effects were significant at the .05 level including the three-way interaction (F (10, 150) = 2.322, p = .014). Morphine caused significant decreases in responding compared with pre-drug day on both the ipsilateral and contralateral side only on day 28 as denoted by asterisks in the figures. In three instances, morphine actually increased pain responses, as denoted by red plus symbols. These were the only significant increases in pain behavior resulting after an analgesic in the entire dataset for the four analgesic drugs. The data for pinprick are presented in the bottom half of Figure 7. The ANOVA revealed that all main and interaction effects were significant including the three-way interaction (F (10, 150) = 2.655, p = .005). Significant decreases in paw withdrawals are denoted by asterisks.
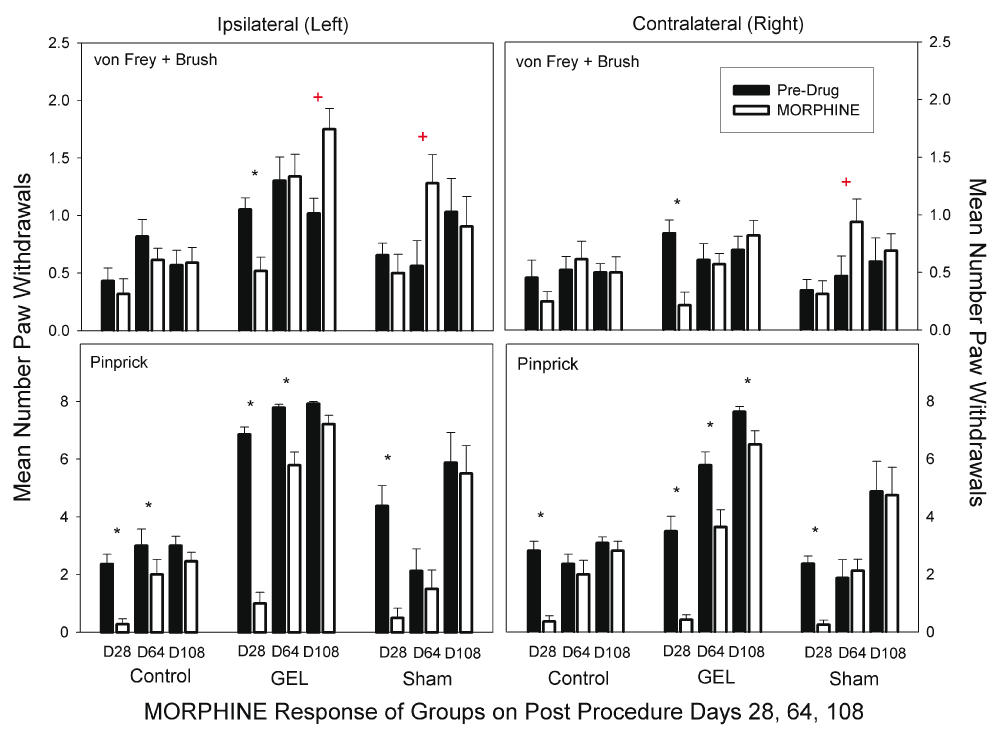
Morphine was less effective over time, not due to tolerance, since each dose is separated by weeks. The graph depicts the average of paw withdrawals on pre-drug control days (black) and on paired morphine dose days (white). Results of behavior testing show the average of all four light touch allodynia measures (three von Frey fibers and the brush, top graphs) and the mechanical hyperalgesia (pinprick, bottom graphs). Only on D28 morphine had marked analgesia with pinprick (bottom) and light touch allodynia (top) across all groups, bilaterally. The data suggest a developing opioid related hypersensitivity to stimuli. Mean and S.E.M. *Significant decrease from the paired control day, p < .05. + Significant increase from the paired control day, p < .005.
Morphine was effective early after the GEL™ procedure, but the size of the effect waned with time on both sides. For example, in the GEL group on the ipsilateral side for the allodynia measures, the standardized effect size between the control day and the morphine day changed from a positive analgesic effect of 1.30 pooled standard deviation units on day 28 to no effect on day 64 to a negative effect of -1.25 pooled standard deviation units on day 108. For the pinprick measure, effect sizes were conservatively estimated using the standard deviation for the morphine condition only instead of the pooled standard deviation because of the reduction of the variability as the responses approached a ceiling of eight paw withdrawals out of eight pinpricks. The analgesic effect size waned from 4.14 standard deviations on day 28 to 0.64 standard deviations on day 108. The shams and controls also suggest an escalating pattern of stimuli sensitivity after morphine with pinprick.
Celecoxib. There was no analgesic effect of Celecoxib at 10 mg/kg in any group on any day on either side. Celecoxib did not decrease pain behaviors, as demonstrated with a decrease in paw withdrawals. Celecoxib at 10 mg/kg is about three times a human dose. Data for the celecoxib days for the von Frey fibers and brush are presented in the top half of Figure 8. The ANOVA revealed significant main effects of groups, side, and drug response and a significant group-by-side interaction (F (2, 30) = 22.92, p = .001). None of the other interaction effects was significant. There was no effect of the celecoxib dose on either side in any group by Bonferroni-protected planned contrasts. The data for pinprick are presented in the bottom half of Figure 8. The ANOVA revealed that all main and interaction effects were significant, including the three-way interaction (F (10, 150) = 2.675, p = .005). The significance of this interaction was completely accounted for by other effects in the data that were not related to any specific pre-drug vs. drug contrast in our set of planned comparisons.
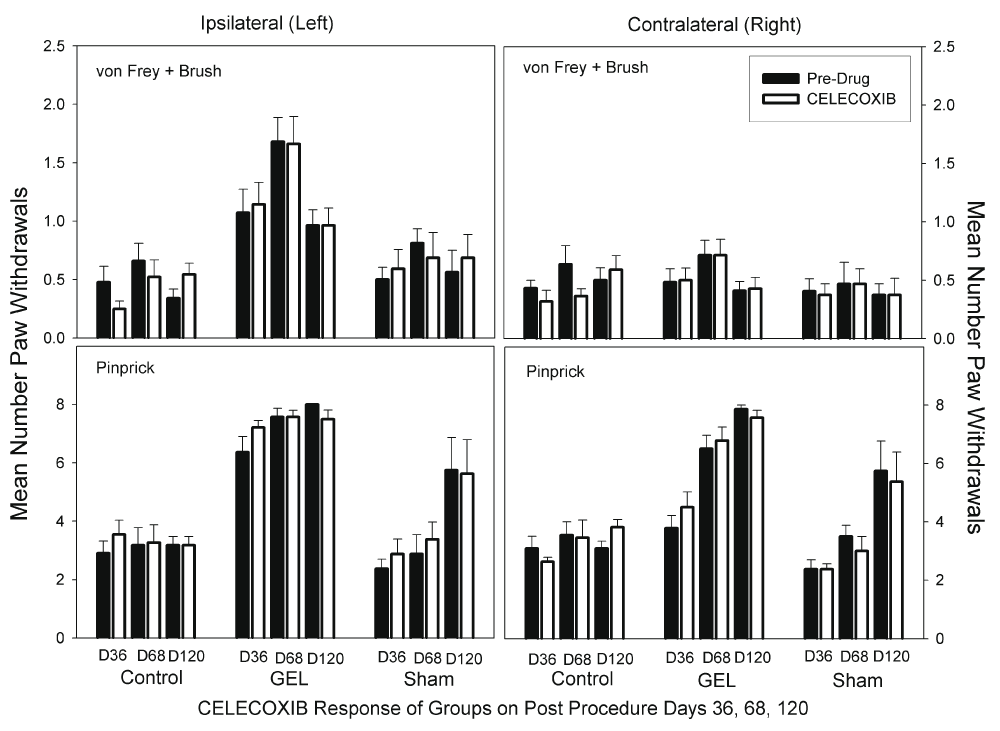
No analgesic effect of celecoxib was demonstrated; no significant change in paw withdrawals. Graph depicts average of paw withdrawals on pre-drug control days (black) and on paired celecoxib dose days (white). Results of behavior testing show the average of all four light touch allodynia measures (three von Frey fibers and the brush, top graphs) and the mechanical hyperalgesia (pinprick, bottom graphs). Mean and S.E.M. Celecoxib did not significantly reduce paw withdrawal responses on any pair of days for any groups.
Gabapentin. On all days on both sides in the GEL group, gabapentin at 25 mg/kg robustly reduced paw withdrawal responses (Figure 9). The dose of gabapentin used is nearly equivalent to a human dose. Gabapentin significantly reduced the sham pinprick responses on most days. Gabapentin also significantly reduced the level of responding in the control group on days 47 and 76 on both sides. The data for the gabapentin test days using the von Frey fibers and brush are presented in the top half of Figure 9. The ANOVA revealed significant main effects and interaction effects except for the three-way interaction. It appears that the group-by-days pattern of responding was similar on the ipsilateral and contralateral sides, therefore, the groups-by-days interaction term is the important one for analysis (F (10, 150) = 1.929, p = .045). When the data for the ipsilateral and contralateral sides were combined, we found that gabapentin robustly reduced the GEL group responding on all analgesic test days. For comparison to other figures, asterisks in the top half of Figure 9 represent significant decreases from the paired pre-drug day by Bonferroni-protected planned contrasts. By this analysis, the comparison for day 114 on the contralateral side for the allodynia measure in the GEL group was not significant. The data for pinprick are presented in the bottom half of Figure 9. With the exception of the group-by-side interaction (p = .055), all main and interaction effects were significant at p < .05 including the three-way interaction (F (10, 150) = .029, p = .03).
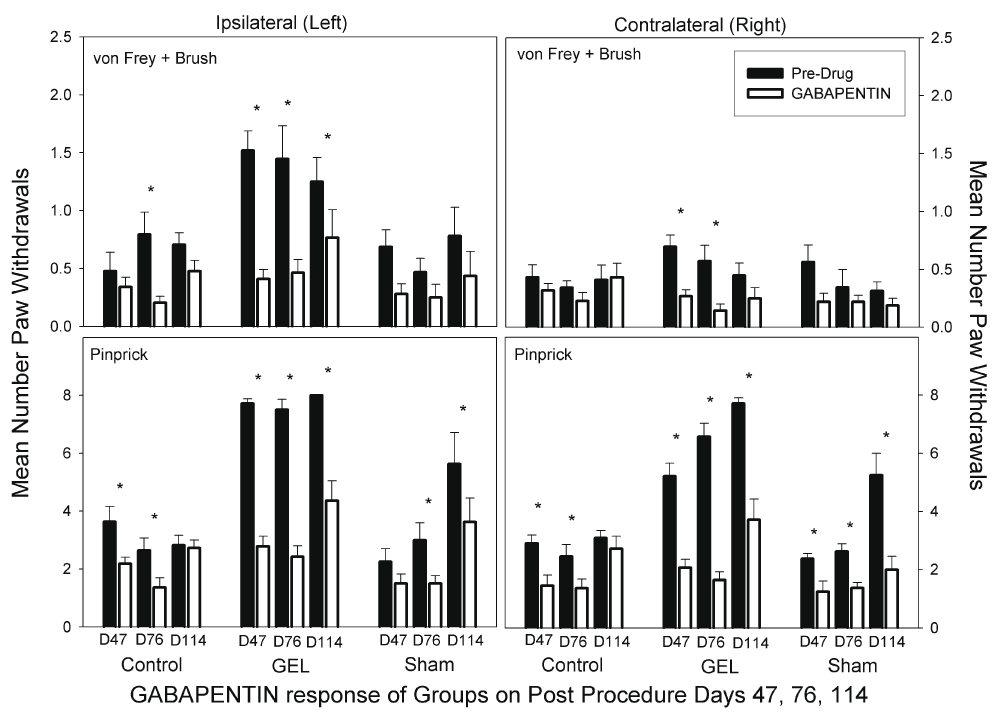
Analgesia with reduced paw withdrawals was seen in the GEL group bilaterally. Graph depicts average of paw withdrawals on pre-drug control days (black) and on paired gabapentin dose days (white). Results of behavior testing show the average of all four light touch allodynia measures (three von Frey fibers and the brush, top graphs) and the mechanical hyperalgesia (pinprick, bottom graphs). Mean and S.E.M. *Significant decrease from the paired control day, p < .05. Gabapentin also suppressed responding in the sham and control group.
Duloxetine. Duloxetine at 10 mg/kg reduced pain behaviors bilaterally in the GEL group (Bonferroni-protected contrasts). This dose is markedly less than most prior rat doses66, and more than human doses. The bilateral analgesia was similar in the sham group on D83 and D125, but emerged only after the pain behaviors in them began developing after 2 months. Interestingly, duloxetine did not suppress normal responses to pinprick stimuli in the control group as the gabapentin did. Yet the duloxetine did suppress responses of the contralateral allodynia in the control group. The von Frey fibers and brush data for duloxetine are presented in the top half of Figure 10. The ANOVA revealed a significant three-way interaction (F (10, 150) = 1.99, p = .039). The data for pinprick are presented in the bottom half of Figure 10. The ANOVA revealed that all main and interaction effects were significant except for the three-way interaction. The groups-by-days interaction was significant (F (10, 150) = 11.358, p < .001), and the pattern of responding within the groups was similar on the ipsilateral and contralateral sides.
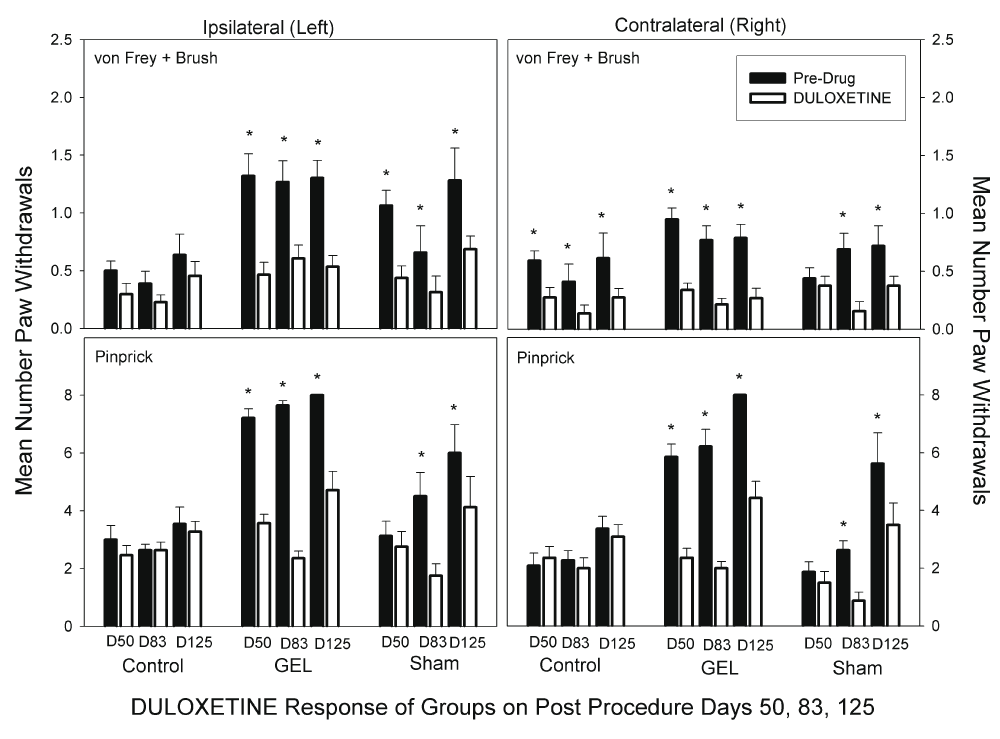
Analgesia with reduced paw withdrawals was seen in the GEL group bilaterally. A similar response was noted in the last 2 test days of the shams, D83 and D125. Graph depicts average of paw withdrawals on pre-drug control days (black) and on paired duloxetine dose days (white). Results of behavior testing show the average of all four light touch allodynia measures (three von Frey fibers and the brush, top graphs) and the mechanical hyperalgesia (pinprick, bottom graphs). Mean and S.E.M. *Significant decrease from the paired control day, p < .05. Duloxetine had less effect than gabapentin on the responses in the control group.
In general, the effects of the different analgesic drugs were similar in the GEL™ and sham groups whenever the sham group demonstrated pain behavior; five of the eight rats in the sham group eventually developed pain behaviors like the GEL group. Morphine demonstrated marked analgesia to the pinprick stimuli on both sides on day 28, but not on later days. This correlates with the waning effect of morphine in the GEL group. Celecoxib did not affect responses in the sham group. As in the GEL group, both gabapentin and duloxetine demonstrated marked analgesia in the sham group.
Morphine depicted a waning analgesic response over time not related to tolerance, with increasing pain behaviors, suggestive of a developing opioid related hypersensitivity. Celecoxib had no analgesic effect on pain behaviors at any time. By contrast, gabapentin and duloxetine both produced robust analgesia bilaterally in the GEL group during all time periods and in 5/8 shams during the last two drug testing periods. The pain behaviors, when present in the GEL group after D23 and later in the shams after D90, respond to all analgesics similarly.
The pain behavior in the GEL group that had persisted for 4 months was reversed for up to 7 days (end pilot) by the targeted perineural application of epoetin alfa (EPO) in a pilot study, at the end of the investigation (Figure 11). Two of the rats in the "EPO at site" group received a second local EPO injection with a lateral approach on day 155 (seen as a + sign on the left paw results in Figure 11), described in the Materials and Methods section on Erythropoietin treatment pilot study. Pinprick behavior data were collected on days 153, 154, 156, 159, and 160. The resulting data were analyzed using a mixed model ANOVA, with the “EPO at site” injection group as the between subjects factor (three groups), and days as one repeated measures factor (8 days), and laterality as a second repeated measures factor (left and right paws). The data are presented in Figure 11. The three-way interaction was not significant, but the groups-by-days interaction was significant (F (14, 77) = 8.208, p < .001). As can be seen in the graph, the effect of EPO was nearly identical on the right and left sides and was significant for at least 6 days, end of study. An ANOVA such as this should be interpreted with caution because of several cells with zero variance (there is a ceiling effect of eight paw withdrawals out of eight stimulus presentations of pinprick).
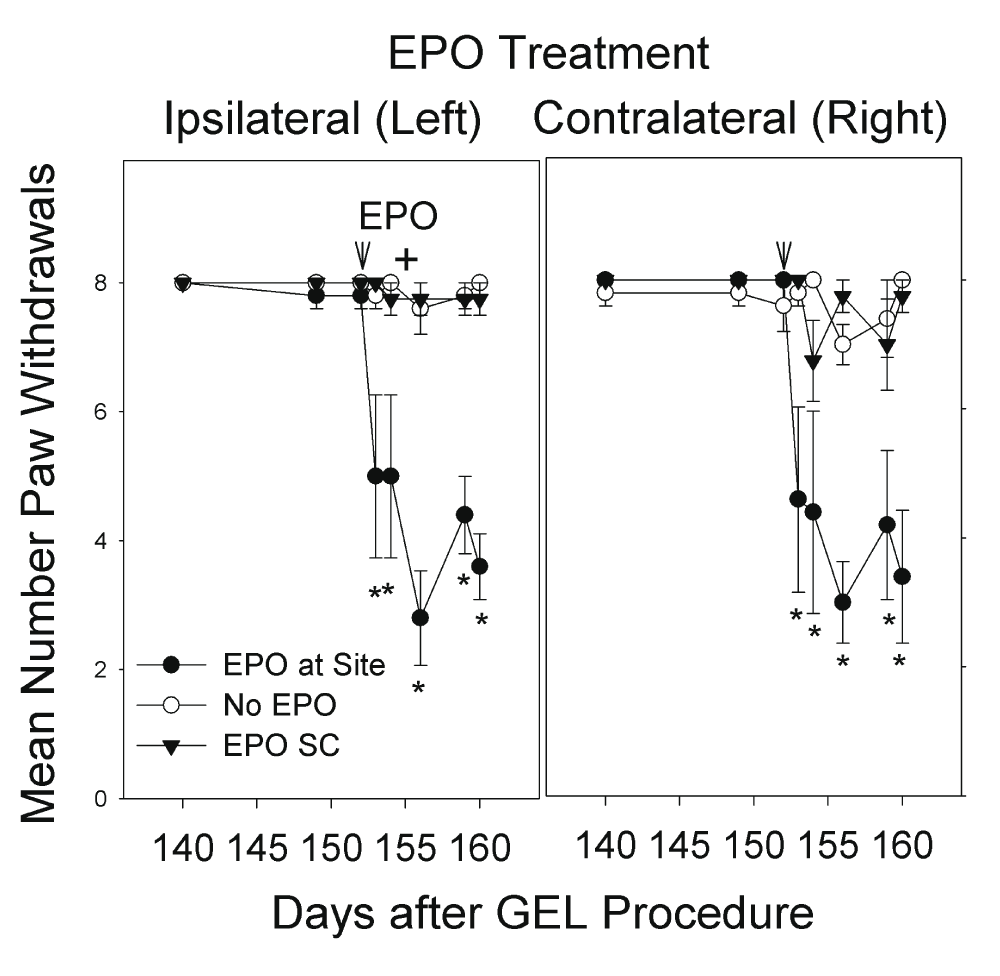
After a perineural infiltration of EPO (200 units in NS) the paw withdrawals to pinprick (hyperalgesia or hypersensitivity) decreased bilaterally to near pre-GEL procedure levels. The groups of “No EPO” control (n = 5) and “EPO SC” injected subcutaneously (n = 4) continued with robust pain behavior, bilaterally. The + on day 155 signifies two rats in the “EPO at site” group still with pain behavior that had the GEL site on left re-injected with EPO with a different anatomic technique, as described, which caused a decrease in their paw withdrawals to pinprick. *p < .001 “EPO at site” vs. “No EPO”.
The tissue sections from nine rats randomly selected from each procedure group were blinded, and observed by an independent neuropathologist. These observations were later respectively matched to each of the three groups, with n = 3 GEL procedure rats, n = 3 sham procedure rats of the 5/8 that displayed late onset robust pain behavior, and n = 3 the controls. Details are described in Histology within the Materials and Methods section. There were no differences or abnormal findings noted in the tissue sections between the control and the sham procedure animals. The structure of the nerve and surrounding tissue was completely unremarkable (Figure 12).

Longitudinal sections through the control (a.) and sham (b.) procedure groups reveal normal appearing nerves. The surrounding muscle tissue that was harvested with the nerve also appears to be within normal limits.
Within the GEL™ treated group, the histology of the nerves was in stark contrast to the sham and control groups. The gross appearance of the tissue at the time of dissection revealed a discrete area of swelling, or a bulge, along the course of the distal tibial nerve, in all specimens of the GEL group only. These discrete structures were about twice the diameter of the nerve just distal and proximal to the outcropping. Longitudinal sections through the portion of the tibial nerve that contained these bulges revealed that the swelling is the result of changes within the endoneurium, including evidence of intraneural edema with increased spacing between the neural fascicles, and axonal edema in the fibers within the bulge region (Figure 13 a and b). In addition, there were numerous profiles in which ongoing axonal fragmentation, a hallmark of Wallerian degeneration, was evident (see arrows in Figure 13 a’ and c)69.
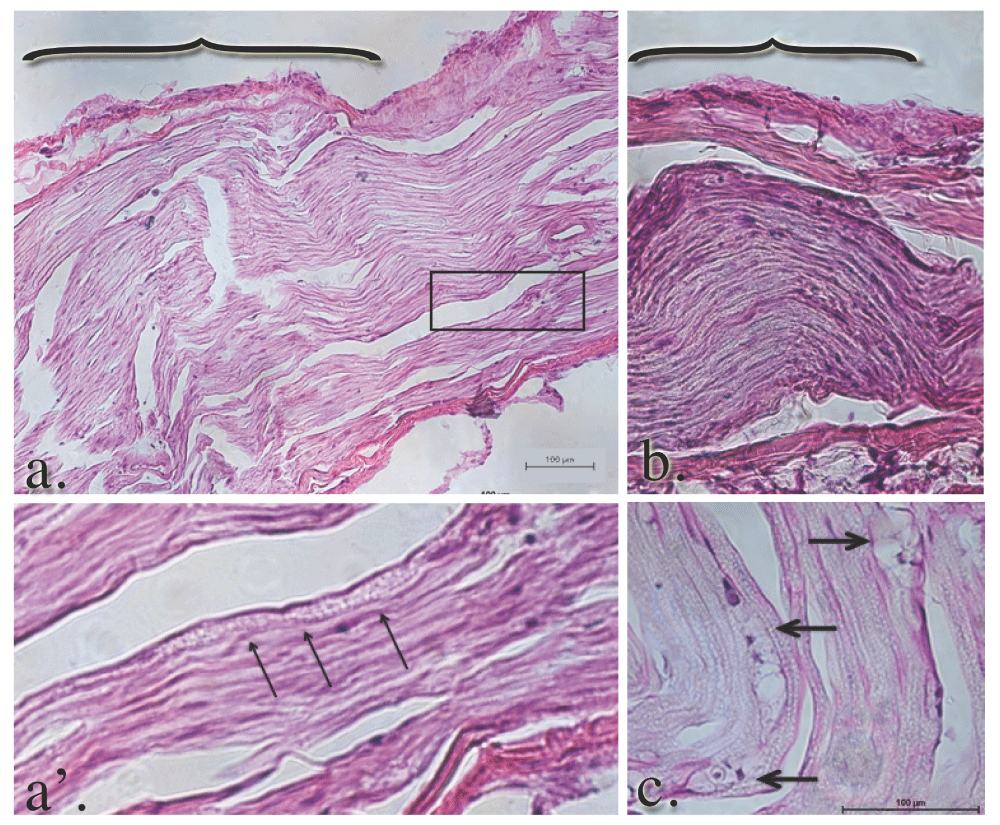
Panels a. and b. reflect the gross swelling seen in the tibial nerves upon dissection. The brackets in panels a. and b. denote the prominent areas of swelling in the GEL nerves. The axons within the swollen area are themselves swollen. The diameters of the axons in this distended area of the nerve are approximately twice the diameter of the contiguous axons proximal or distal (not shown) to it. The arrowheads point to axonal debris in panel a’, which is a magnification of the area within the box in panel a. Macrophage-engulfled myelin and axonal debris (panel c., arrows) is further evidence of ongoing Wallerian degeneration.
Consistent with ongoing Wallerian degeneration, we observed numerous macrophages within the endoneurium, which phagocytize myelin and axonal debris (Figure 14 a and b large arrows). We also noted a significant leukocyte accumulation in and around the perineurium (Figure 14 b thin arrows).
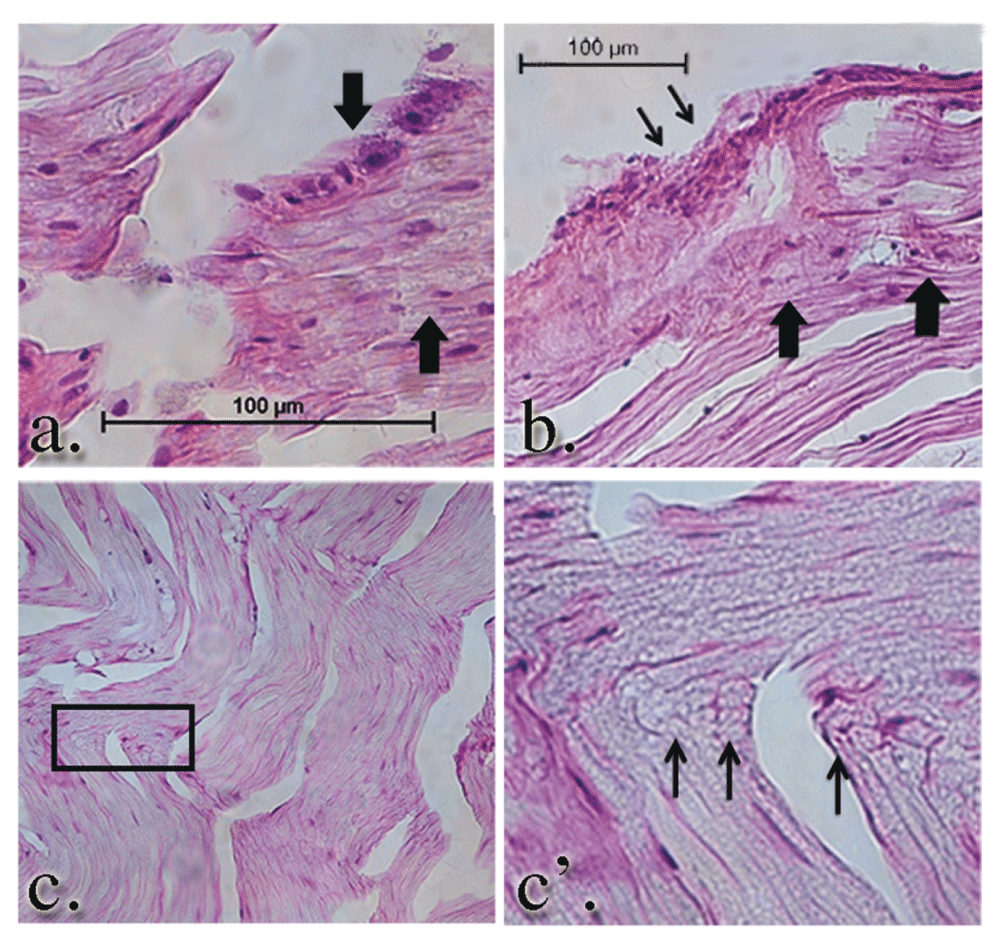
Intraneural (large arrows a. and b.) and perineural leukocytic infiltration (thin arrows, b.) is seen in the GEL group nerves. Notably, there are numerous profiles of regeneration axons in the same nerve (panel c. and c’) at the same proximal/distal level, suggesting ongoing nerve remodeling in the GEL procedure animals. Panel c’ is a higher power magnification of the clusters of small, unmyelinated axons within the box in panel c.
Findings consistent with any gel residual were not noted in the GEL procedure specimens. In addition to the ongoing Wallerian degeneration observed in the GEL animals, we also noted ongoing axonal regeneration. There were clusters of small, unmyelinated or lightly myelinated fibers growing into the nerves of the GEL cohort only. The grouping of these small fibers is consistent with regeneration, rather than the randomly single-arrayed, unmyelinated fibers that are found in the healthy, homeostatic adult nerve70.
This nonsurgical NeuroDigm GEL™ aged model appears to mimic many humans complaining of persistent neural pain after soft tissue injuries, by being of gradual onset, persisting for months and lacking deformities or antalgic gait. Two other characteristics have been suggested for relevance in a rodent neuropathic pain model: 1) an analgesic response profile similar to humans and 2) effective analgesia with doses of near human equivalent strengths (14th World Congress IASP 2012; SIG Pain in non-humans species: TW 62 “Closing the Gap between Preclinical and Clinical Studies, Jeffrey Mogil). This socially mature aged outbred rat version of this model of neurogenic pain approaches these analgesic response guidelines.
Mature adult rats59,61 were chosen to resemble more closely, human chronic pain patients1,71. The allodynia response in this aged model was weak, while the response to pinprick with hyperalgesia was robust. Younger (270 g) rats created with the NeuroDigm GEL™ method have had robust allodynia over 2 months (Supplementary file S4). Neuropathic pain models in older rats have been recognized as having less pronounced mechanical allodynia than younger ones72,73.
Central sensitivity or neural plasticity is demonstrated in this model after 2–3 weeks by the appearance of elicited pain behavior on the contralateral side in all GEL procedure rats, as well as the five sham rats that developed the late onset pain behavior. The contralateral spread of pain behaviors in this model raises the possibility that there are central changes as well. Whether this is the result of anatomic changes or the alterations in neural signaling remains to be determined. Central sensitivity with contralateral pain is known to exist in humans with originally unilateral neural pain74–77.
The sham effect with the delayed onset of neuropathic pain was not anticipated, but evaluation of the data depicted a more delayed tissue response (S1) than the GEL group. While the GEL™ was a moderately strong stimulus for tissue repair causing a pain response initially at 23 days (Figure 2), the data shows that the sham fluid was a weaker stimulus for a tissue response, with the gradual consistent onset of pain behavior after 60 days in the five out of eight shams with pain (Figure 2, Figure 6). If this experiment ended prior to 3 months the sham effect would not have been evident. Interestingly, many human neuropathic pain conditions begin months after an injury78.
An opioid related hypersensitivity79,80 and morphine tolerance is suggested by the data of neural pain behavior developing over time, as seen in the GEL and 5/8 sham animals (Figure 7). Such lack of effective analgesia with morphine over time is characteristic of many neuropathic pain patients81–83. Since each of the three doses of morphine in this study is separated by weeks, the weakening response to morphine does not reflect tolerance but a resistance. This morphine resistance may correlate to the gradual development of nerve injury84. Repeated screenings of analgesics over time may determine translational effectiveness85. The analgesic responses of this mature GEL model has negative predictive validity for morphine, and positive predictive validity for gabapentin and duloxetine.
Erythropoietin86–89, methylprednisolone90, glucocorticoids in general91, and ARA290, an erythropoietin derived tissue repair peptide92–94, as well as other biologics95, are known to have neuroprotective effects systemically and locally in nerve injury rodent models. The local erythropoietin dose at the neural lesion in this model may integrate the tissue repair ability of erythropoietin96 in alleviating pain behavior. In this model the EPO injection acts similar to a diagnostic and therapeutic peripheral nerve block.
The targeted local injection of an erythropoietin analog in this study appears to support the localized “ectopic” and “generator” theories for the persistence of neural pain. The unilateral application of erythropoietin appears to have markedly reduced, for at least 6 days (end of study), the bilateral pain behavior of mechanical hyperalgesia (pinprick). The focal neural swelling seen on the distal tibial nerve in the GEL group acts like a mid-axon nociceptive stimulus, maintaining the pain behavior until the localized erythropoietin healed the neural lesion.
An unanticipated feature suggested in our 5-month study is the evidence for habituation to the von Frey and brush stimuli. In this study, the light touch stimuli (von Frey, brush) have less painful significance than the pinprick, so their responses may be susceptible to habituation (Figure 3, Figure 4). We have not been able to locate any specific study of habituation to von Frey or brush stimuli. Ipsilateral responses to light touch stimuli in the GEL group appeared to diminish in post procedure periods 4 and 5. By contrast, the sham group tended to remain the same or increase during the same time periods, as some of them developed pain behavior. We did not observe any evidence of habituation to the pinprick stimulus in any group.
The nerve specimens used in this study were processed at end of the near 6-month study, when chronic tissue changes dominated, without evidence of acute inflammation97. The histological changes seen were restricted to the NeuroDigm GEL™ procedure group and are consistent with ongoing tissue remodeling in the area where the GEL was placed. Specifically, there was evidence of both Wallerian degeneration and axonal regeneration, hallmarks of nerve remodeling. The GEL evoked remodeling of extraneural matrix tissue may result in nerve compression98, resulting in neural remodeling with the delayed onset of pain42. Also consistent with ongoing nerve remodeling is the observed inflammation with leukocytic infiltration, seen in both the endoneurial environment and the extraneural space.
Notably, a large number of tightly packed unmyelinated fibers were within the nerves of the GEL procedure animals, consistent with regeneration. The increased number of these fibers and their unusual clustered appearance raises the issues of adequate insulation and the possibility that some of the pain behavior might be due to ephaptic transmission99–101. Neural regeneration with ephaptic transmission is likely the underlying cause of the both the Tinel’s sign102 observed in some patients at sites of neural compression due to entrapment, and also the Pinch Reflex Test found at sites of regenerating peripheral nerves in experimental rodents103,104.
The histology demonstrates that the light microscopy anatomical response to the GEL procedure is restricted to a focal area of neural and axonal edema with neuroinflammation in the tibial nerve, yet the behavioral effects are widespread. Light microscopy showed that the three shams (from the 5/8 with robust pain behavior) had no visible anatomic changes on histology, similar to the paclitaxel model105. Additional studies are needed in which the effects of the GEL™ induced distal mononeuritis are explored on the brain, spinal cord and the dorsal root ganglion.
The mechanisms that lead to the anatomic and behavioral changes are not yet determined. However, it is likely that the neural remodeling91 seen in our model’s neuritis reflects many of the ongoing changes that are seen with chronic pain following peripheral trauma106. The findings in our study are consistent with prior findings found in neural biopsies of humans with severe persistent pain due to known nerve entrapments102,107,108. The creation of this model allows for further in-depth studies to understand the events around the establishment of chronic neural pain following minimal trauma as seen in humans.
Our model simulates the gradual sequelae of a soft tissue injury with a focal matrix compression (a pinch) causing an ectopic neural site with persistent neurogenic pain109,110. Gradual perineural changes of the extracellular matrix and scarring111 can cause such focal compressions on a nerve42. Recently, a lesion of the somatosensory system, or a disease, has been needed for the definition of neuropathic pain112. This model provides an extended temporal window into an occult focal neural lesion as a naturally occurring soft tissue disease113.
The GEL method supports the 3Rs initiative for refinement in the humane use of animals, and if predictive at determining analgesia may lead to a reduction in animals used. The tissue reaction used in this refinement is an encoded response occurring after any tissue injury in all vertebrates114,115. The last stage of this repair process is tissue remodeling (S1)113,116 which may be a unifying etiology117 to target in many complex neuropathic pain syndromes.
We have used tissue repair in this model to create neuropathic pain, and also to treat it. Performing analgesic studies on a mature adult rat with a tissue matrix neural lesion may help reveal the analgesic potential of an agent for humans with neuropathic pain. The refined118 NeuroDigm GEL™ Model has an accessible neural biomimetic target for translational studies exploring cell signaling, biomarkers, analgesics, detection devices, biologic treatments and alternatives to opiates.
F1000Research: Dataset 1. Raw data of NeuroDigm Model of neuropathic pain in mature rat, 10.5256/f1000research.9544.d137472119
Conceived and designed the experiments: MRH DAF DEW JLB. Performed the experiments: MRH RMD DEW. Analyzed the data: DAF DEW MRH. Wrote the paper: MRH DAF RMD DEW JLB. All authors agreed to the final content of the article.
We are indebted to general surgeon Dale C. Rank Sr. MD (deceased February 5th 1996), who contributed to the translation from man to the preclinical method of the model. Deep gratitude is given to Gordon Munro PhD, who advised on analgesic doses and methods, and read the paper.
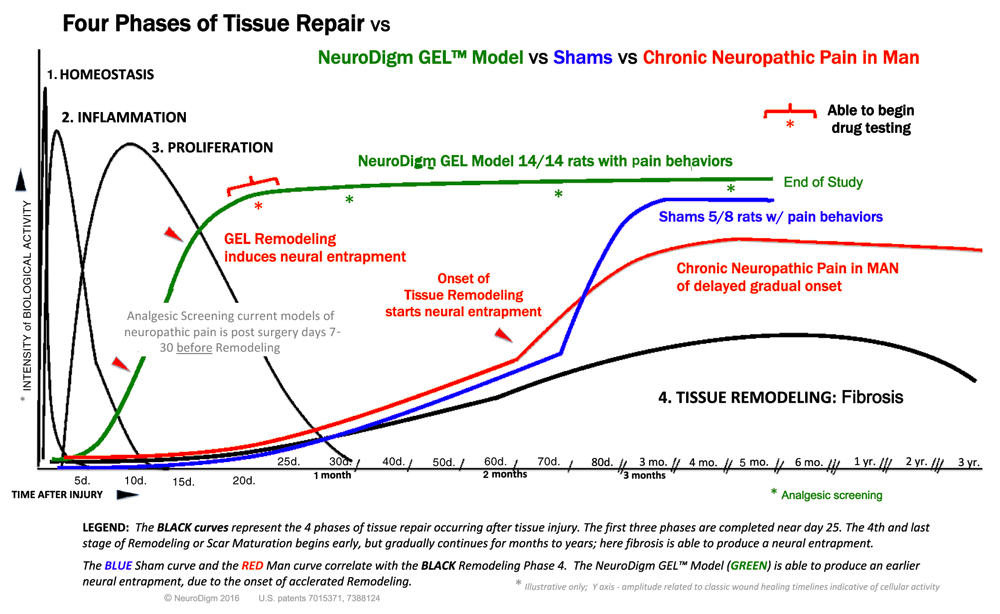
Compares the onset of pain behaviors in this study to the onset of tissue remodeling with fibrosis.
Supplementary file S2: NC3Rs ARRIVE guidelines.
Checklist of recommendations for in vivo animal experiments.
Click here to access the data.
Supplementary file S3: Basic Anova statistics on groups.
Detailed Anova Statistics on each group on the routine test days without analgesics.
Click here to access the data.
Supplementary file S4: NeuroDigm GEL™ analgesic study in young rats.
Analgesics over months in young NeuroDigm GEL rats with robust allodynia.
| Views | Downloads | |
|---|---|---|
| F1000Research | - | - |
|
PubMed Central
Data from PMC are received and updated monthly.
|
- | - |
References
1. Lang T, Altman D: Basic statistical reporting for articles published in clinical medical journals: the SAMPL Guidelines. Science Editors' Handbook, European Association of Science Editors. 2013.Competing Interests: No competing interests were disclosed.
Competing Interests: No competing interests were disclosed.
References
1. Finnerup NB, Attal N, Haroutounian S, McNicol E, et al.: Pharmacotherapy for neuropathic pain in adults: a systematic review and meta-analysis.Lancet Neurol. 2015; 14 (2): 162-73 PubMed Abstract | Publisher Full TextCompeting Interests: No competing interests were disclosed.
Alongside their report, reviewers assign a status to the article:
| Invited Reviewers | |||
|---|---|---|---|
| 1 | 2 | 3 | |
|
Version 2 (revision) 04 May 17 |
read | read | read |
|
Version 1 13 Oct 16 |
read | read | read |
Click here to access the data.
Spreadsheet data files may not format correctly if your computer is using different default delimiters (symbols used to separate values into separate cells) - a spreadsheet created in one region is sometimes misinterpreted by computers in other regions. You can change the regional settings on your computer so that the spreadsheet can be interpreted correctly.
Provide sufficient details of any financial or non-financial competing interests to enable users to assess whether your comments might lead a reasonable person to question your impartiality. Consider the following examples, but note that this is not an exhaustive list:
Sign up for content alerts and receive a weekly or monthly email with all newly published articles
Already registered? Sign in
The email address should be the one you originally registered with F1000.
You registered with F1000 via Google, so we cannot reset your password.
To sign in, please click here.
If you still need help with your Google account password, please click here.
You registered with F1000 via Facebook, so we cannot reset your password.
To sign in, please click here.
If you still need help with your Facebook account password, please click here.
If your email address is registered with us, we will email you instructions to reset your password.
If you think you should have received this email but it has not arrived, please check your spam filters and/or contact for further assistance.
Comments on this article Comments (0)