Keywords
covariate shift, model building, ChEMBL, logistic regression, k-NN
This article is included in the Cheminformatics gateway.
covariate shift, model building, ChEMBL, logistic regression, k-NN
A common prerequisite in supervised learning algorithms is that the training and prediction data arise from the same distribution and are independently and identically distributed (iid)1. Intuitively this is justified, as one should not expect to learn a classifier on one distribution of examples and apply it to accurately predict labels of examples drawn from a different distribution. Covariate shift is a machine learning technique that can be utilized in supervised learning when the training and prediction distributions are known to differ, but the concept being learned remains stationary. A recent book provides an excellent overview of the current state of the art in covariate shift methods2.
Covariate shift frequently occurs during the drug discovery process where learning systems are built to predict physiochemical properties of interest. Initially a chemistry team may focus on a particular chemical series, and information from this series is used to train a learning system. As the project progresses, the chemistry team may refocus their efforts on a new, structurally distinct series. The accuracy of prospective computational predictions on the new series may be compromised as these molecules originate from a distribution that is distinct from the molecular set used to train the learning tool.
For example one may wish to build a learning system to predict hERG activity (unwanted cardiovascular toxicity). Initially the computational tool is trained using series A but must now predict on series B. The concept “binding to hERG” is fixed, however the area of interest has transitioned from chemical series A to chemical series B. The feature vectors describing these two sets are likely related but potentially different; and as such, their covariates have shifted. Put more mathematically, the probability of observing a feature vector from the prediction set is different from the probability of observing a feature vector from the training set. That is, the training and prediction sets are non-iid. A well-constructed learning system will recognize that predictions on series B are outside the “domain of applicability” of the model and predict with low confidence. The covariate-shift method attempts to adjust the domain of applicably so that it is more aligned with the prediction set.
Covariate shift methods typically reweight instances in the training data so that the distribution of training instances is more closely aligned with the distribution of instances in the prediction set. This is accomplished by providing more weighting during model building to an instance in the training set that are similar to an instance in the prediction set. It has been shown3 that the appropriate importance weighting factor w(x) for each instance “x” in the training set is:
where pt(x) is the probability of seeing instance x in the training set and pp(x) is the probability of seeing x in the prediction set. It is important to note that only the feature vector values (not their labels) are used in reweighting. The importance weighting scheme is intuitively understandable. If the probability of seeing a particular instance from the training set in the prediction is very small, then this instance should carry little weight during the training process and consequently have little effect on the decision function.
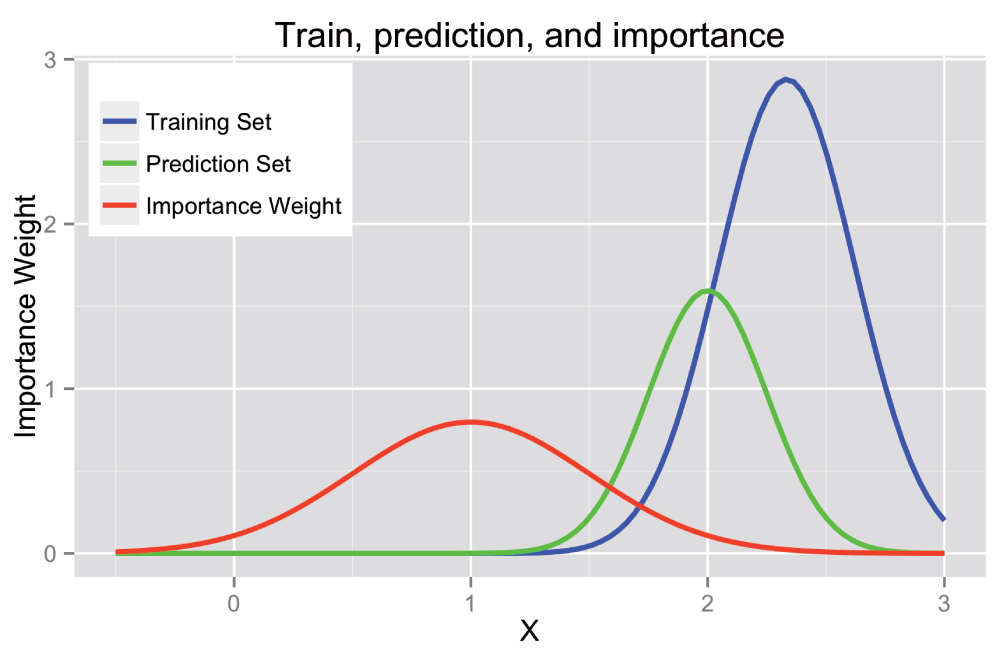
Figure 1 plots two Gaussian distributions and w(x). If instances from the red distribution are used for training a classifier to predict on an instance from the green distribution then the blue curve gives the importance of each instance. Note the increased importance for instances from the training distribution overlapping with high-density regions of the prediction distribution.
For our experiments, we use a logistic regression classifier where each training instance is weighed by its importance w(x). For the calculation of w(x) we use the Kullback-Leibler Importance Estimation Procedure (KLIEP) method developed by Sugiyama4. The KLIEP method is based on the Kullback-Leibler divergence theorem and attempts to find weights to minimize the divergence from ptrain(x) to ppredict(x). Briefly, the importance is modeled as a linear function:
The αi are the weights to be learned and φi the basis functions. The importance weight from Equation 1 can be rearranged and used to estimate the probability of observing a feature vector in the predictive set.
The KL divergence from pp(x) to its estimate can then be expressed as:
After algebraic manipulation, removing terms independent of and adding constraints to ensure proper normalization, a final objective function to be maximized can be derived as (see 4 for details):
The resulting problem is convex and can be solved using standard optimization techniques. The result is an expression for w(x) that allows calculating weights for a training instance x. These weights can then be incorporated when training a classifier to obtain a co-variate shifted version of the classifier.
To demonstrate the use of covariate shift methods, we repeated a simple toy experiment as detailed in 3. Figure 2 graphically displays the results we obtained.
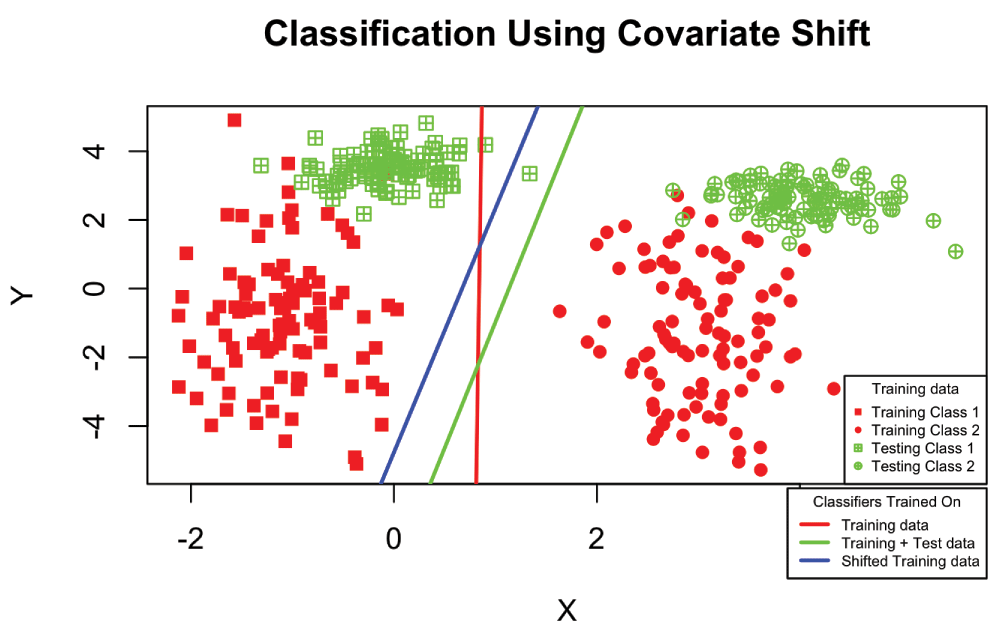
The red training points are drawn from two (2) two-dimensional Gaussian distributions representing a class 1 and a class 2. The green prediction points are drawn from a slightly rotated version of the training distributions. The red line plots the classifier obtained when training on only the training points; the green line plots the classifier trained on both the training and prediction points (the optimal classifier in this case). The blue line plots the classifier trained on the training data that was weighted by the importance factor as estimated by the KLIEP method. Note how the blue line is shifted towards the optimal classifier, demonstrating the effect of the KLIEP algorithm and covariate shift.
Using the Python programming language, we implemented the KLIEP method combined with logistic regression and applied it to five different in-house ADME (absorption, distribution, metabolism and excretion) datasets. We compare KLIEP+Logistic Regression (KL+LR) to Logistic Regression (LR) and a k-NN classifier (k=5)5.
For each dataset the molecules were sorted by compound registration date. The first 75% of the data comprised the master training set while the remainder formed the master prediction set. Temporal ordering of the data represents the evolving coverage of chemical space by drug discovery projects and consequently captures the natural “shifting” of the covariates. Classifier performance statistics are generated by performing twenty different runs, each on a random 80% of the master files. Performance statistics for each classification task are then obtained by averaging the results of the twenty individual folds. In all cases, OpenEye6 path fingerprints are used as feature vectors. We experimented with different fingerprints provided by OpenEye (MACCS 166 bit structural keys and circular fingerprints) and found that they had no significant effect on the outcome.
To ensure the data was amenable to covariate shift we generated classifiers separating “training” from “prediction” data. Figure 3 shows performance of LR on this separation task. For each dataset we are able to compute highly accurate classifiers. This indicates that the training and prediction data are drawn from different distributions and hence are appropriate for covariate shift methods. This is a necessary condition for covariate shift but does not imply model improvement over unweighted data.
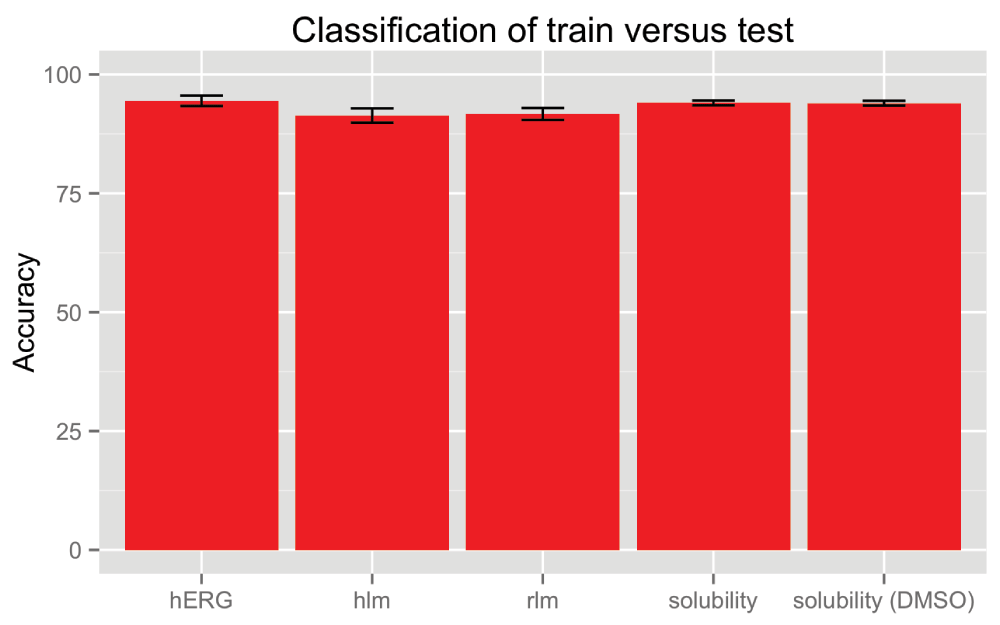
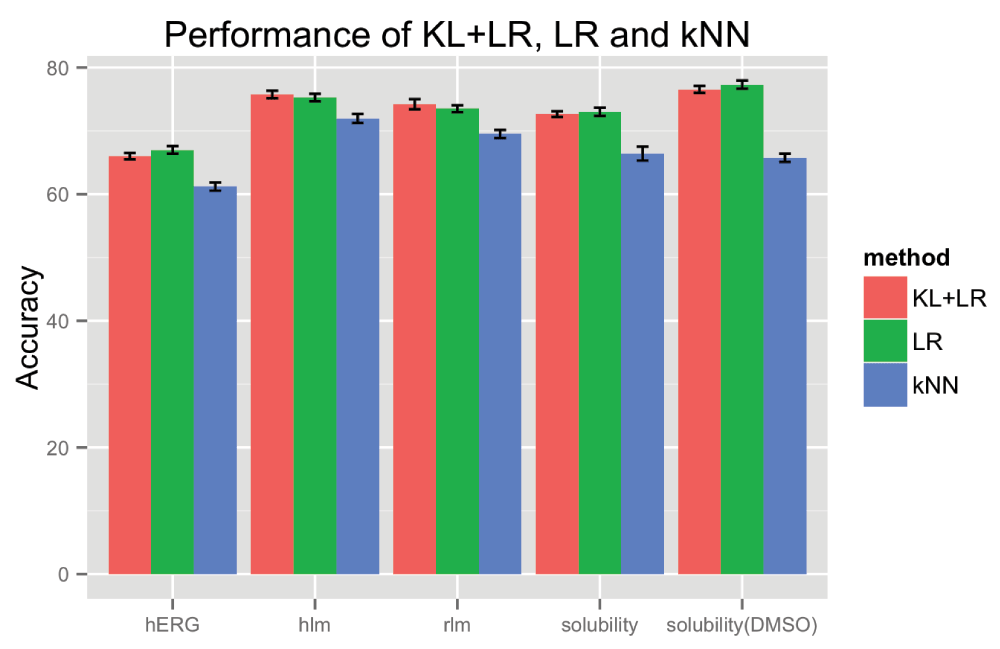
Figure 4 compares the performance of KL+LR, LR and k-NN on the five (5) datasets. One can see from the graph that KL+LR failed to provide any statistical improvement over standard LR.
We extended the study to include an external dataset provided by ChEMBL7,8 such that others could use their own fingerprints and independently support or refute our claims. We chose the beta secretase IC50 data as it is a well established biochemical screen, highly accurate and contains > 7000 data points crossing multiple orders of magnitude, which are publically available.
Analogous to the internal datasets, we were able to demonstrate that the data could be separated and thereby appropriate for application of the covariate shift algorithm. Unfortunately, the outcome was the same: that is, as measured by overall classifier accuracy, there was no statistical advantage for reweighting the training set.
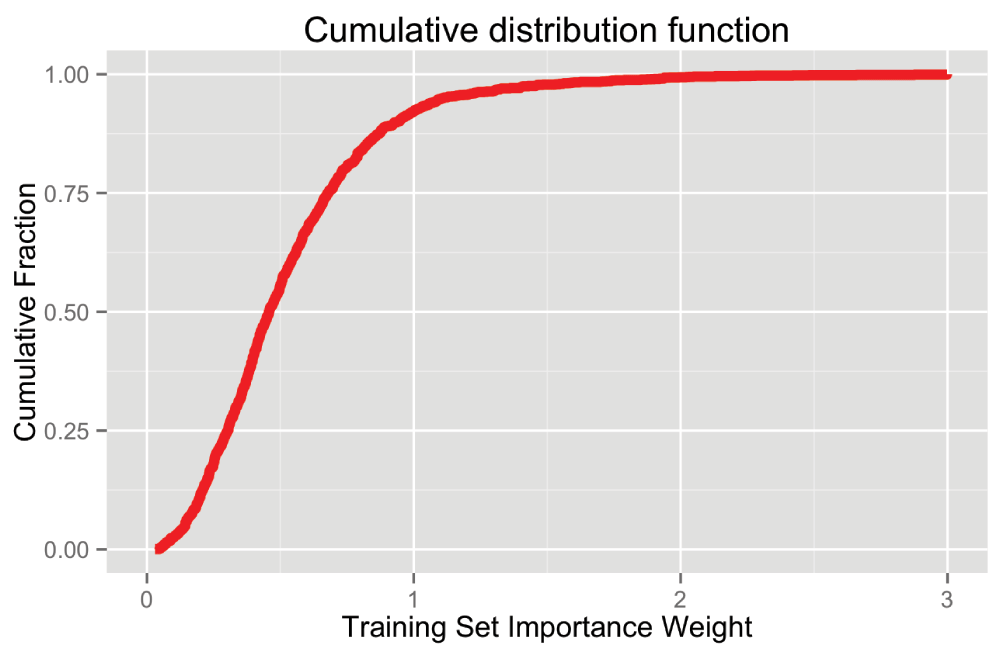
A possible explanation for the failure of the covariate shift method to provide a boost in predictive performance could be that the calculated importance weights are all similar. This would cause each training example to exert the same influence on the decision function and thus the importance weighting would have no effect. This was not the case. Figure 5 plots the cumulative distribution function of the importance weight for the training set compound. The plot demonstrates that weights are distributed across a range of classifier performance.
We have applied the KLIEP method to five (5) internal data sets and one (1) external data set where covariate shift was evident. Although KL+LR was an advantage over k-NN, there is no statistical advantage of reweighting the training dataset. We are surprised with this outcome and are currently exploring other datasets where application of covariate shift may improve the predictions.
F1000Research: Dataset 1. The BACE IC50 data derived from the ChEMBL database, 10.5256/f1000research.8317.d1178829
| Views | Downloads | |
|---|---|---|
| F1000Research | - | - |
|
PubMed Central
Data from PMC are received and updated monthly.
|
- | - |
Click here to access the data.
Spreadsheet data files may not format correctly if your computer is using different default delimiters (symbols used to separate values into separate cells) - a spreadsheet created in one region is sometimes misinterpreted by computers in other regions. You can change the regional settings on your computer so that the spreadsheet can be interpreted correctly.
Provide sufficient details of any financial or non-financial competing interests to enable users to assess whether your comments might lead a reasonable person to question your impartiality. Consider the following examples, but note that this is not an exhaustive list:
Sign up for content alerts and receive a weekly or monthly email with all newly published articles
Already registered? Sign in
The email address should be the one you originally registered with F1000.
You registered with F1000 via Google, so we cannot reset your password.
To sign in, please click here.
If you still need help with your Google account password, please click here.
You registered with F1000 via Facebook, so we cannot reset your password.
To sign in, please click here.
If you still need help with your Facebook account password, please click here.
If your email address is registered with us, we will email you instructions to reset your password.
If you think you should have received this email but it has not arrived, please check your spam filters and/or contact for further assistance.
Comments on this article Comments (0)