Keywords
Local causal neighborhood, Predictive modeling, Scleroderma, Cytokine biomarkers.
Local causal neighborhood, Predictive modeling, Scleroderma, Cytokine biomarkers.
Scleroderma, also known as systemic sclerosis (SSc), is an autoimmune disease of the connective tissues. The disease is characterized by accumulation of collagen and other connective tissue macromolecules in skin as well as internal organs. The disease is not considered heritable, although it is argued that genetic predisposition plays an important role in its development1.
The mechanisms that cause interstitial lung disease in scleroderma (SSc-ILD) remain poorly understood. It is well documented that fibrosis is associated with increased expression of the profibrotic cytokines and chemokines. Several cytokines such as transforming growth factor (TGF)2, connective tissue growth factor (CTGF)3, interleukins, tumor necrosis factor (TNF)4, oncostatin M (OSM)5 and others have been reported to be increased in bronchoalveolar lavage fluid (BALF) or serum from scleroderma patients when compared to healthy controls. It has been postulated that production of profibrotic cytokines and chemokines is likely to be key components in the pathology that leads to progressive pulmonary fibrosis in scleroderma6.
It has been suggested that T-helper (Th) cells and their associated cytokines may play a role in the pathophysiology of scleroderma7. Different subsets of Th cells play prominent roles in the progression of scleroderma7. Although heavily implicated in disease pathogenesis, immunoproteomic biomarkers do not currently provide an effective way to predict SSc-ILD8.
In this paper, we use computational local causal neighborhood (LCN) discovery techniques9,10 to identify the cytokines that have direct causal relationship to scleroderma status. Rather than reconstructing a detailed causal graph, LCN methods identify variables (cytokines) that are causally ‘close’ to a target variable (SSc-ILD). Based on theoretical results and empirical studies, this task can be achieved even from observational data under very common assumptions about the distribution of the data9,10. The causal nature of the identified variables is complemented by provably advantageous properties with respect to the predictive value of these variables. Specifically, the set of biomarkers in the LCN of a target node make all other biomarkers conditionally independent. This implies that LCN yield the most parsimonious yet maximally predictive diagnostic biomarkers. This has been demonstrated in a number of empirical studies with real biological data11,12. Therefore, we seek to develop a biomarker of SSc-ILD by discovering its LCN in cytokine data measured from the bronchoalveolar lavage fluid (BALF).
Forty patients with SSc-ILD (20 African American: 5 males, 15 females, mean age 43.7 ± 11.0; 20 Caucasian: 10 males, 10 females, mean age 53.8 ± 11.6) and 24 healthy subjects (12 African American: 5 males, 7 females, mean age 32.0 ± 9.5; 12 Caucasian: 4 males, 8 females, mean age 29.6 ± 9.9), all nonsmokers, were examined.
BALF Preparation. Bronchoalveolar lavage was performed as a part of standard care after informed consent was obtained under a protocol approved by the Institutional Review Board for Human Research of Medical University of South Carolina. Recovered BALF was centrifuged at 500 g for 10 minutes at 4°C. Pellet was removed and subjected to total and differential cell counts. Supernatant was dialyzed against sterile distilled H2O overnight at 4°C, lyophilized, and stored at -80°C until assayed.
Cytokine Array. Lyophilized BALF powder was recovered in 5 mM Tris, pH 7.4 to a protein concentration of 1 mg/ml, and analyzed using Human Cytokine Antibody Array V from RayBiotech, Inc. (Norcross, GA) according to the manufacturer’s instructions. Briefly, 500 µg of BALF samples were incubated with array support at room temperature for 2 h followed by the incubation with cocktail of biotin conjugated antibodies at 4°C overnight. The arrays were then incubated with horseradish peroxidase-conjugated streptavidin at room temperature for 2 h, and developed by using enhanced chemiluminescence-type solution. The images were scanned and analyzed with the NIH Image software. The net optical density (OD) was obtained by subtracting a background measurement of the same size negative area from the OD measurement of the signal area. Positive controls (six per membrane) were used to normalize the results from different membranes being compared. The variation between two identical cytokine spots ranged from 0 to 10% in duplicated experiments.
The final dataset consisted of 28 measured cytokines. Figure 1 shows the description of the cytokine array map.

Pos, positive; Neg, negative; ENA, epithelial cell-derived neutrophil-activating peptide; GCSF, granulocyte-colony stimulating factor; GM-CSF, granulocyte/macrophage-colony stimulating factor; GRO, growth-regulated oncogene; IL, interleukin; IFN, interferon; MCP, monocyte chemotactic protein; MCSF, macrophage colony stimulating factor; MDC, macrophage-derived chemokine; MIG, monokine induced by gamma interferon; MIP, macrophage inflammatory protein; RANTES, regulated upon activation in normal T cells, expressed, and secreted; SCF, stem cell factor; SDF, stromal cell-derived factor; TARC, thymus and activation regulated chemokine; TNF, tumor necrosis factor; EGF, epidermal growth factor; IGF, insulin-like growth factor; Ang, angiogenin; OSM, oncostatin; TPO, thrombopoietin; VEGF, vascular endothelial growth factor; PDGF, platelet-derived growth factor; BDNF, brain-derived neurotrophic factor; BLC, B-lymphocyte chemoattractant; IGFBP, insulin-like growth factor binding protein; IP-10, interferon-inducible protein 10; LIF, leukemia inhibitory factor; LIGHT, lymphotoxins, inducible expression, competes with HSV glycoprotein for HVEM, a receptor expressed on T-lymphocytes; MIF, microphage migration inhibitory factor; NAP, neutrophil activating peptide; NT, neurotrophin; PARC, pulmonary and activation regulatory chemokine; PIGF, placenta growth factor; TIMP, tissue inhibitors of metalloproteinases.
The raw cytokine measurements have been log transformed. We have imputed the missing cytokine values from their 10 nearest neighbors identified by K-nearest neighbors (KNN) algorithm using Bioconductor package impute, version 3.413. Adjustment for sex and race have been performed by fitting linear regression model to individual cytokine values and extracting the residuals for further analysis. All analyses have been performed in R, version 3.2.514.
We have performed Welch t-test15 to find cytokines univariately associated with scleroderma status. We have adjusted for multiple comparisons using False Discovery Rate correction (FDR)16 with significance threshold set at 0.05. Table 2.
We define LCN of a variable as a set of variables in its vicinity. LCNs can be constructed in such a way as to maximize their utility for biomarker development. For instance, Markov blanket (MB) of a variable is an LCN defined as the most compact set of variables (cytokines) rendering other variables independent of a target variable (SS)17. Intuitively, MB is the optimal solution of variable selection problem for predictive purposes. In practice, this means that the selected biomarkers contain all essential predictive information about the target node and are causally close to it (causal parents, children or spouses). Inference of MB requires inference of causal directionality, which is infeasible in most biomedical datasets due to their limited sample size and complexity. A closely related LCN that preserves much of the predictive utility of MB is the parent-child set (PC-set), which only consists of direct causal parents and children of the target node. As opposed to MB the PC-set does not include common confounders of the effects of the target node, and thus can be slightly less predictive. Nonetheless, PC-sets are much easier to discover computationally. Overall, the major advantage LCNs for biomarker discovery is that the size of the biomarker is typically small and has a causal interpretation.
In order to infer LCN of SS, we have used the HITON-PC algorithm18 from causal explorer toolbox19 in MATLAB Release 2016b20. This algorithm performs a series of conditional independence tests (Fisher’s Z test with 0.05 significance threshold) to infer the PC-set of the target variable (SS).
We use logistic regression model for predictive analysis. To ensure accurate and unbiased estimates of predictive power of the local causal neighborhood, we have performed 1,000 cross validation (CV) runs of the predictive analysis. First, we have randomly split the sample into training (70% of the data) and testing sets preserving case-control balance in each of the splits. Next, we have identified the PC-set of SSc-ILD using HITON-PC algorithm. The cytokines in the PC-set served as the predictors in building the logistic regression model of SSc-ILD from the training set data. Finally, we estimated the performance of the logistic regression model on the data in the test set. The performance estimates from each of the 1,000 CV runs have been used to determine the overall predictive power of the PC-set.
Our main metric of predictive performance is area under receiver operating characteristic (ROC) curve (AUC). Curve specifies the relationship between the true positive rate (TPR) and the false positive rate (FPR) of the model under all possible model parameter thresholds. The value of AUC from 0.5 (no predictive signal) to 1 (perfect prediction). We have extracted the following additional performance metrics from the ROC: (i) mean classification success rate, defined as the average rate of correctly identifying the scleroderma status on the test set, over the entire simulation runs; (ii) mean optimal sensitivity, the average value of the optimal sensitivity of the predictive model over the entire simulation runs. (ii) mean optimal specificity, the average of the optimal specificity of the predictive model over the entire simulation runs.
Cytokine arrays were utilized to explore and compare the expression levels of multiple cytokines in BALF samples. The array revealed elevated expression of 28 cytokines in BALF from scleroderma patients when compared to controls, which were selected for further analysis. Figure 2.
From the 28 cytokines measured, 8 are significantly associated with scleroderma status at p-value of 0.05 (Table 1). After correction for multiple comparisons using FDR, 3 cytokines, MIP-1delta, VEGF and Osteoprotegerin,remain significantly associated. The same cytokines are significant after adjustment for subject sex and race.
| Cases (N=40) | Controls (N=24) | |||
|---|---|---|---|---|
| Sex | Male | Female | Male | Female |
| 15 | 25 | 9 | 15 | |
| Race | African American | White | African American | White |
| 20 | 20 | 12 | 12 | |
| Mean | Unadjusted | Adjusted | ||||
|---|---|---|---|---|---|---|
| Healthy(sd) | Scleroderma(sd) | P-value* | FDR | P-value* | FDR | |
| MCP.1 | 2.002(1.85) | 3.010(1.48) | 0.029 | 0.110 | 0.028 | 0.107 |
| MIP.1delta | 2.887(1.34) | 3.833(0.74) | 0.003 | 0.030 | 0.002 | 0.022 |
| SCF | 1.184(1.14) | 1.900(0.85) | 0.011 | 0.075 | 0.010 | 0.067 |
| ANG | 3.934(0.79) | 4.390(0.50) | 0.016 | 0.080 | 0.015 | 0.077 |
| TPO | 2.286(1.03) | 2.863(1.07) | 0.038 | 0.128 | 0.035 | 0.120 |
| VEGF | 3.223(0.46) | 3.627(0.47) | 0.001 | 0.018 | 0.000 | 0.006 |
| Osteoprot | 2.439(0.91) | 3.186(0.57) | 0.001 | 0.018 | 0.000 | 0.006 |
| PARC | 4.130(0.87) | 4.588(0.24) | 0.018 | 0.080 | 0.017 | 0.077 |
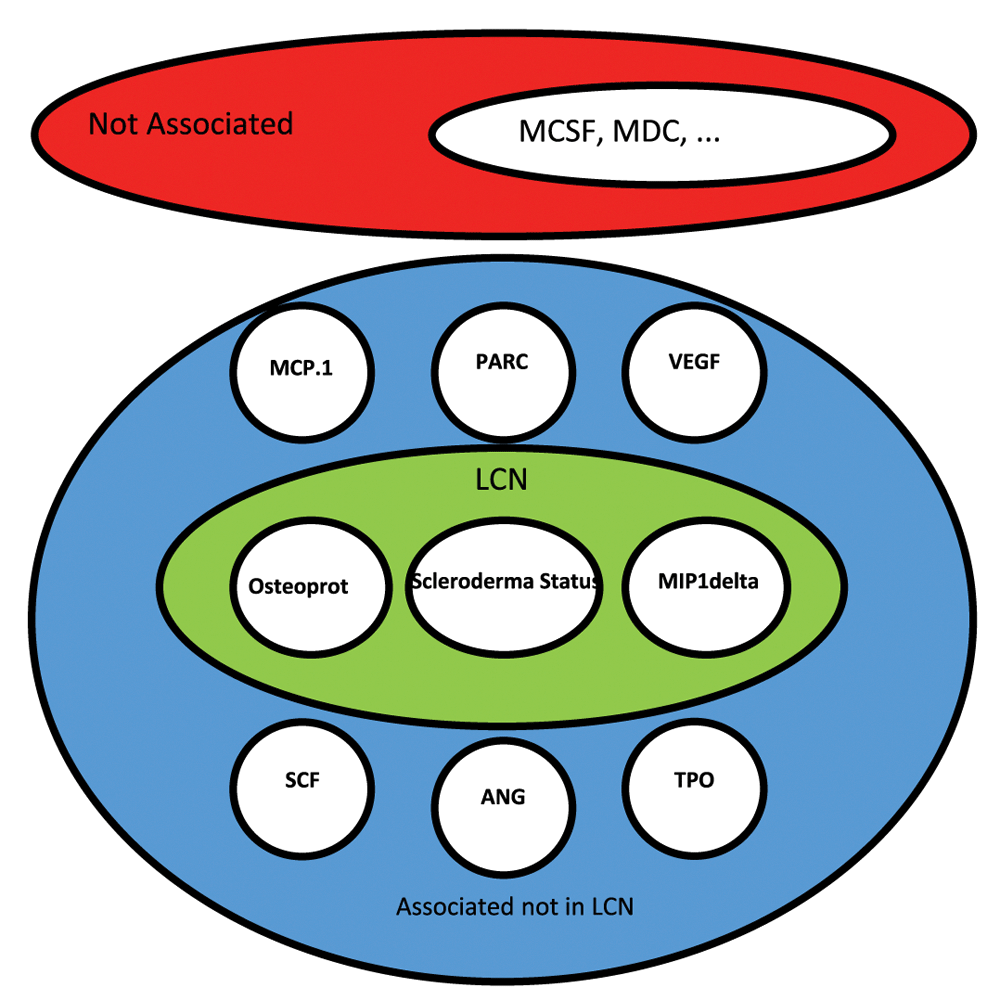
HITON-PC algorithm identifies two cytokines, OPG and MIP-1delta, as the members of the PC-set LCN of SS in both adjusted and unadjusted data. Figure 3 shows the inferred LCN for the scleroderma status.

HITON-PC algorithm identified two cytokines, Osteoprot and MIP-1delta, to be in the PC-set of the scleroderma status (SS). 6 other cytokines are found to be univariately associated with SS. These additional cytokines as well as every other cytokine not in PC-set, however, are conditionally independent of the SS, given the PC-set. The causal connectivity of the remaining cytokines with SS is unknown.
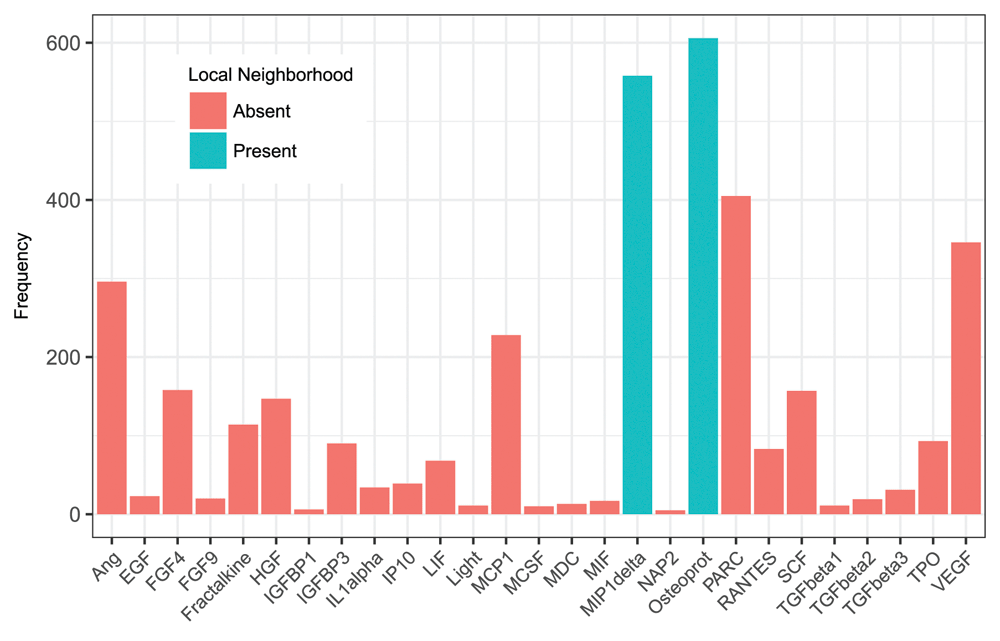
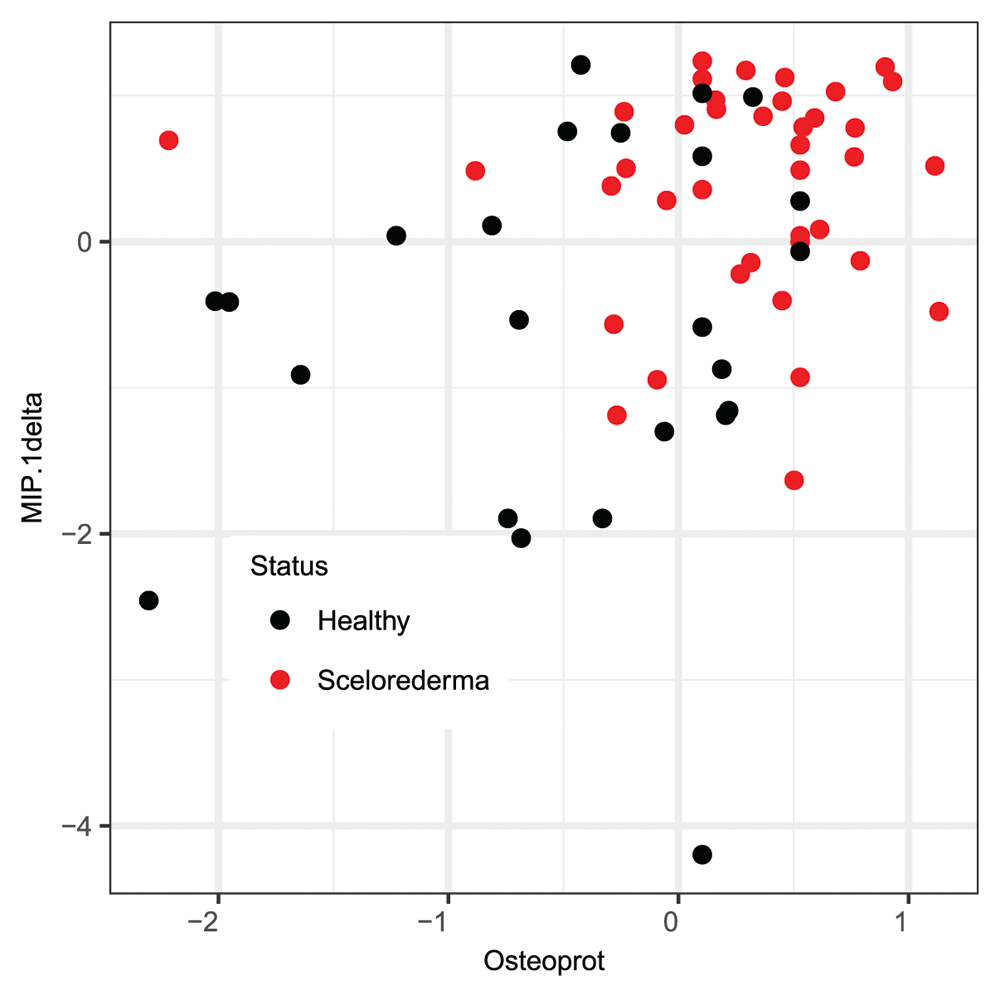
In order to assess the stability of the PC-Set estimate, we performed a re-sampling analysis as described in the methods section. The histogram of the appearance of the different cytokines in the causal neighborhood of scleroderma status is shown in Figure 4. Osteoprot and MIP-1delta appeared most frequently in the PC-set LCN of SS. In the 1000 simulation runs, either one or both cytokines appeared in the PC-set of scleroderma status 847 times. The scatterplot of MIP1-delta against Osteoprot adjusted values (Figure 5) shows apparent concentration of scleroderma cases in the top right quadrant, indicating association of higher expression values of these cytokines with disease.

We performed 1,000 iterations of repeated cross validation to determine stability of the two cytokine biomarkers. The number of times each cytokine (adjusted for sex and race) appears in the PC-set LCN of SS is depicted on this plot. Osteoprot and MIP-1delta appear in the LCN of SS with high frequency, indicating high likelihood of their causal proximity to scleroderma status. These results are similar if no adjustments for sex and race are made (data not shown).

The scatterplot shows the distribution of the two cytokines against each other in data adjusted by sex and race. Red and black points indicate cases and controls, respectively. The concentration of the red points in the upper right quadrant indicates potential presence of predictive signal towards disease status in these cytokines.
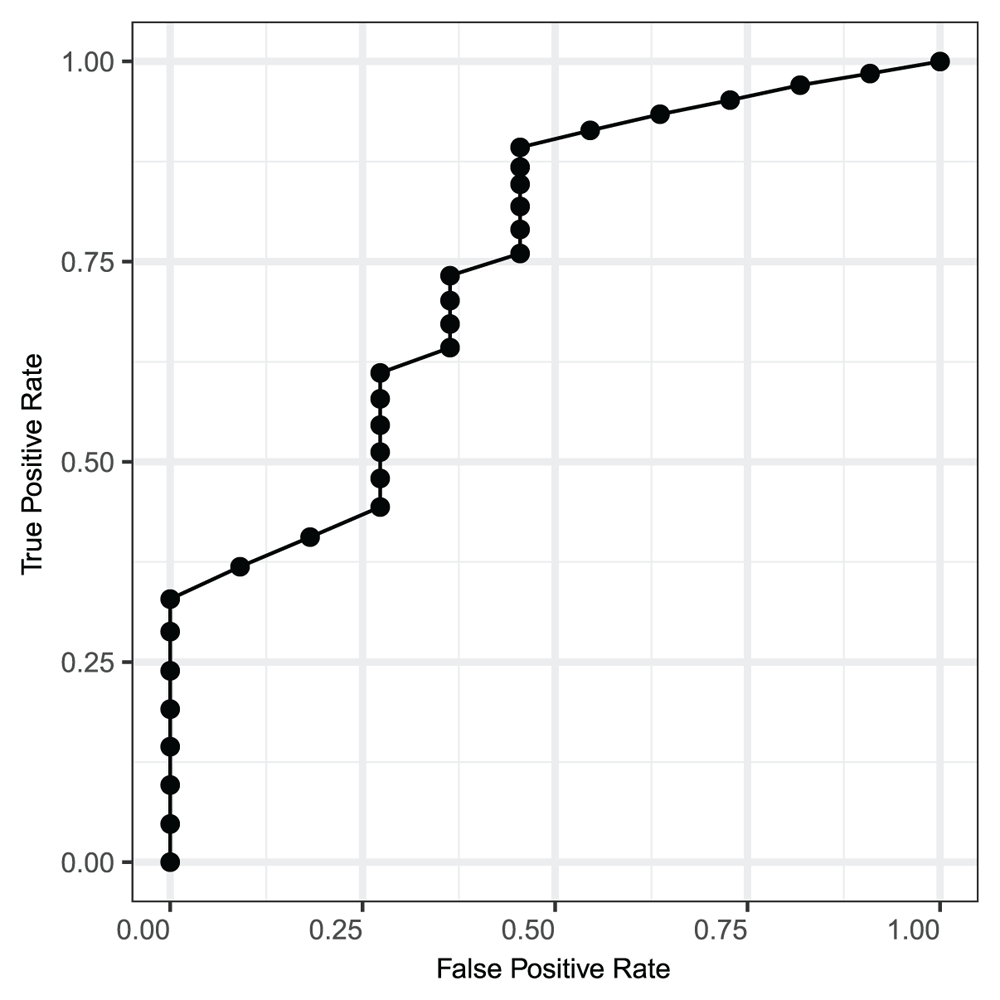
We first fit the logistic regression model using all cytokines as predictors. The resulted model attains cross-validated predictivity indistinguishable from random predictor on the testing data and almost perfect predictivity in the training data. This indicates high levels of noise in the weakly predictive data, which requires feature selection before attempting to build predictive model in order to obtain accurate models and estimates of model predictivity. To estimate the predictive utility of PC-set LCN in an unbiased way, we have performed 1,000 iterations of repeated cross-validated predictive model building using logistic regression. In data adjusted for sex and race, the mean classification success rate is 68.46% (st. dev. 6.66%). The mean optimal sensitivity of the model is 65.49%( st. dev. 11.38%). The mean optimal specificity of the model is 73.44% (± 11.88% st. dev.). We estimate the AUC of the cross-validated model to be 73% (Figure 6), indicating non-negligible power of LCN biomarker for SSc prediction.

The ROC curve shows the estimated values of true positive rate against the false positive rate for the predictive model. The estimated value for the area under curve is 73%. The significant difference of the AUC value from 0.5 confirms the strength of the identified biomarkers in predicting the SS.
ILD is the leading cause of morbidity and mortality in scleroderma patients. The mechanisms leading to SSc lung disease remain unknown. However, a variety of cytokines and growth factors have been reported to be increased in BALF from SSc patients. It is known fact that, Osteoprotegerin acts as a competitive receptor for the membrane-bound receptor activator of nuclear factor-kappaB21. It is also known that, osteoprotegerin-deficient mice exhibit osteoporosis at early stage of life span with the activation of RANK ligand (RANKL)22. Macrophage inflammatory protein (MIP) has been previously shown to be associated with scleroderma diagnosis23. OPG in primary myelofibrosis (PMF) expressed significantly higher (up to 71-fold) when compared with prefibrotic cellular PMF and control cases24.
In this paper, we present a model for inferring the cytokines predictive of SSc-ILD using local causal neighborhood framework. The model identified osteoprotegerin (OPG) and macrophage inflammatory protein-1 delta (MIP-1delta), to be closely related to the scleroderma status. We tested the hypothesis that the identified cytokines can be used as predictive biomarkers.
We compared the biomarkers selected by LCN with those resulting from LASSO regression25. In our data, the regression model selects the same features as LCN. This suggests that LCN approach can result in equivalent inference to LASSO. However, the major advantage of an LCN feature selection approach is in the theoretical causal guarantees it provides. LCN identifies features based on their causal proximity to the target variable, something that LASSO regression feature selection cannot match.
In this study, clinical disease characterization and demographic information, other than sex and race, have not been incorporated in the predictive model of SS. In practice, we maintain that combining molecular biomarkers with clinical and demographic data should improve the quality of the predictor. Such a biomarker, however, will require a larger cohort of patients to be developed.
Understanding the role of BALF’s cytokines in pathogenesis of SSc-ILD may identify new targets for the development of diagnostic biomarkers predicting the biological behavior of the disease.
ZENODO: SLE_cytokines - Identification of predictive cytokine biomarkers of scleroderma via local causal neighborhood methods data
Raw and imputed cytokine array expressions, relevant code provided in Matlab and R format, and the results of applying LASSO regression on the BALF cytokine arrays are provided in the repository. https://zenodo.org/record/1001044; DOI: 10.5281/zenodo.100104426
All procedures were performed as a part of patient standard care after informed consent was obtained under a protocol approved by the Institutional Review Board for Human Research of Medical University of South Carolina.
The project described was supported by the NIH National Center for Advancing Translational Sciences (NCATS) through Grant Number UL1 TR001450. AVA is funded by NIH/NCI R01 CA164964, NIH/NIDCR R34 DE025085, and NIH/NIAMS R21 AR067459. AVA and ASB are funded by MUSC College of Medicine Enhancing Team Science (COMETS) Pilot. GSB is funded by NIH/NIAMS P60 AR062755.
The funders had no role in study design, data collection and analysis, decision to publish, or preparation of the manuscript.
| Views | Downloads | |
|---|---|---|
| F1000Research | - | - |
|
PubMed Central
Data from PMC are received and updated monthly.
|
- | - |
Is the work clearly and accurately presented and does it cite the current literature?
Partly
Is the study design appropriate and is the work technically sound?
Yes
Are sufficient details of methods and analysis provided to allow replication by others?
Partly
If applicable, is the statistical analysis and its interpretation appropriate?
Partly
Are all the source data underlying the results available to ensure full reproducibility?
Yes
Are the conclusions drawn adequately supported by the results?
Partly
Competing Interests: No competing interests were disclosed.
Is the work clearly and accurately presented and does it cite the current literature?
Partly
Is the study design appropriate and is the work technically sound?
Partly
Are sufficient details of methods and analysis provided to allow replication by others?
No
If applicable, is the statistical analysis and its interpretation appropriate?
Partly
Are all the source data underlying the results available to ensure full reproducibility?
Yes
Are the conclusions drawn adequately supported by the results?
Partly
Competing Interests: No competing interests were disclosed.
Alongside their report, reviewers assign a status to the article:
| Invited Reviewers | ||
|---|---|---|
| 1 | 2 | |
|
Version 1 24 Oct 17 |
read | read |
Provide sufficient details of any financial or non-financial competing interests to enable users to assess whether your comments might lead a reasonable person to question your impartiality. Consider the following examples, but note that this is not an exhaustive list:
Sign up for content alerts and receive a weekly or monthly email with all newly published articles
Already registered? Sign in
The email address should be the one you originally registered with F1000.
You registered with F1000 via Google, so we cannot reset your password.
To sign in, please click here.
If you still need help with your Google account password, please click here.
You registered with F1000 via Facebook, so we cannot reset your password.
To sign in, please click here.
If you still need help with your Facebook account password, please click here.
If your email address is registered with us, we will email you instructions to reset your password.
If you think you should have received this email but it has not arrived, please check your spam filters and/or contact for further assistance.
Comments on this article Comments (0)