Keywords
erythrocytes, IPNV, birnavirus, immune response, antiviral, trout, interferon
erythrocytes, IPNV, birnavirus, immune response, antiviral, trout, interferon
Viral diseases are one of the main agents that cause loses in aquaculture. Among all the viral diseases, infectious pancreatic necrosis (IPN) is a highly transmissible viral disease with a high impact in the salmon aquaculture industry. Infectious pancreatic necrosis virus (IPNV) is the responsible agent of IPN. IPNV was the first fish virus isolated in cell culture1 and has different serotypes resulting from mutations in the VP2 gene2. IPNV outbreaks are usually related to high mortality rates in salmonid aquaculture, especially in young fish3,4, highlighting the urgent necessity for the development of efficient strategies in vaccination. IPNV belongs to the Aquabirnaviridae genera within the Birnaviridae family. Virions from this family are non-enveloped with a double stranded RNA genome. This genome consists of two segments: the A segment contains the information to encode a protein that is post-translationally cleaved into VP2, VP3 and VP4 viral proteins; the B segment encodes VP1 viral protein, which is a RNA polymerase5. VP2 and VP3 are the major structural and immunogenic proteins, as they represent 64% of the total proteins of the virions6. The VP2 epitopes are the target for antibodies against different serotypes6. The VP3 role is unknown, but it could be an internal structural protein7.
In contrast to mammals, fish, reptile and avian red blood cells (RBCs) are nucleated. This implies that nucleated RBCs can support viral replication. For example, fish RBCs are the target of some fish viruses, such as infectious salmon anemia virus (ISAV)8 and piscine orthoreovirus (PRV)9,10, where viral factories and high viral titters have been observed. Moreover, both viruses can induce immune responses in infected RBCs, characterized by the expression of genes related to IFN-1 (type I interferon) pathway and IFN-γ.
Typically, the role associated with RBCs is the transport of O2 to different tissues and gas exchange. The fact that these cells are nucleated implies that fish RBCs can respond to different stimulus and control cellular processes. At present, a whole set of biological processes related to the immune response has been reported in RBCs from different species: recognition of pathogen associated molecular patterns11,12 through expression of pattern recognition receptors, such as toll-like receptors (TLRs)13; production of cytokine-like factors8,12,14,15; phagocytosis16; and formation of complement immune complexes17. Recently, it has been shown that viral hemorrhagic septicemia virus (VHSV) can induce cytokine production and crosstalk with a spleen stromal cell line (unpublished report, Nombela I, Puente-Marin S, Chico V, Villena A, Carracedo B, Ciordia S, Mena M, Mercado L, Perez L, Coll J, Estepa A, Ortega-Villaizan M). Human RBCs have also been involved in the antiviral response, since it has been reported that RBCs could bind HIV-1 particles to their surface, forming complexes to ease the clearance of the viral particles18.
Based on this evidence, the aim of this study was to evaluate the immune response of trout RBCs against IPNV, one of the most ubiquitous viral fish pathogens. To reach this objective, we first analyzed the infectivity of IPNV in trout RBCs. Then, the RBCs’ immune responses were evaluated in ex vivo RBCs exposed to IPNV by means of gene and protein expression methods. Finally, the ability of RBCs to protect against IPNV infection in CHSE-214 (Chinook salmon embryo) cell line, which is susceptible to IPNV infection, was evaluated using conditioned medium (CM) from IPNV-exposed RBCs. Here, we report the induction of an immune response in RBCs by IPNV, a non-infecting virus on these cells, characterized by the expression of genes related with the IFN-1 pathway, Mx production and protection against IPNV infection in CHSE-214 cells.
Rainbow trout (Oncorhynchus mykiss) individuals of approximately 10 g were obtained from a commercial fish farm (PISZOLLA S.L., CIMBALLA FISH FARM, Zaragoza, Spain) with a re-circulating dechlorinated-water system, at a stocking density of 1fish/3L, and fed daily with a commercial diet (SKRETTING, Burgos, Spain) and maintained at the University Miguel Hernandez (UMH) facilities at 14°C. Fish were acclimatized to laboratory conditions over 2 weeks before experimentation.
Rainbow trout were sacrificed by overexposure to tricaine methanesulfonate (Sigma-Aldrich, Madrid, Spain) at 0.2 g/L. Peripheral blood was sampled from the caudal vein of rainbow trout using insulin syringes (NIPRO Bridgewater, NJ). Blood samples were placed in RPMI-1640 medium (Dutch modification) (Gibco, Thermo Fischer Scientific Inc., Carlsbad, CA) supplemented with 10% FBS (Cultek, Madrid, Spain), 1 mM pyruvate (Gibco), 2 mM L-glutamine (Gibco), 50 µg/mL gentamicin (Gibco), 2 µg/mL fungizone (Gibco) and 100 U/mL penicillin/streptomycin (Sigma-Aldrich). Then, RBCs were purified by two consecutive density gradient centrifugations with Histopaque 1077 (7206g, Ficoll 1.007; Sigma-Aldrich). Finally, RBCs were washed twice with RPMI 2%. Purity of RBCs of 99.9% was estimated by optical microscopy evaluation. Then, purified RBCs were cultured in the above indicated medium at a density of 107 cells/mL, in cell culture flasks, at 14°C, overnight.
Ex vivo rainbow trout (Oncorhynchus mykiss) RBCs along with CHSE-214 cell line (Chinook Salmon Embryo, ATCC CRL-1681) were infected using IPNV Sp strain19. IPNV was grown as previously described20. Ex vivo RBCs exposure to IPNV was performed by incubating RBCs with diluted IPNV at the indicated MOI (multiplicity of infection) in RPMI 2% FBS. After three hours of incubation, RBCs were centrifuged at 1600 rpm for 5 minutes and then washed with medium to completely eliminate the non-adsorbed excess of virus. Finally, RBCs were placed in 24 well plates (Corning Costar, Sigma-Aldrich, Madrid, Spain) with 500 µl of RPMI 2%. The whole process was done at 14ºC. Infection of the CHSE-214 cell line was done by incubating IPNV diluted in RPMI 2% at the desired MOI for 1 hour at 14ºC. After that, RPMI was retired and RPMI 2% was added to each well. Infected CHSE-214 cells were maintained at 14ºC20.
In time course experiments, the initial supernatant with IPNV was not removed. When each of the time points were reached, RBCs were washed with cell culture medium and CHSE-214 cells with PBS supplemented with calcium.
The virus titer in IPNV-exposed RBCs supernatants was determined by TCID50 quantification and RT-qPCR. Briefly, different dilutions of the supernatants (from 10-1 to 10-4) were added to CHSE-214 cell monolayers, and incubated at 14ºC for 90 minutes. Then, the virus was removed and infected CHSE-214 cell monolayers covered with a solution of RPMI 2% FBS. Cell plates were incubated at 14ºC for 7 days. For RT-qPCR titration, 30 µL of IPNV with known titer (109 TCID50/mL) and 30 µL of IPNV-exposed RBCs supernatants were used to extract RNA and synthetize cDNA, as explained hereafter. Ten-fold serial dilutions from 108 to 102 TCID50/mL were done to obtain IPNV cDNA and create a standard line.
The E.Z.N.A.® Total RNA Kit (Omega Bio-Tek Inc., Norcross, GA) was used for total RNA extraction, in accordance with manufacturer’s instructions. DNAse treatment was done in order to eliminate residual genomic DNA using TURBO™ DNase (Ambion, Thermo Fischer Scientific Inc.), following the manufacturer’s instructions. RNA was quantified with a NanoDrop® 377 Spectrophotometer (Nanodrop Technologies, Wilmington, DE).
cDNA was synthetized from RNA using M-MLV reverse transcriptase (Invitrogen, Thermo Fischer Scientific Inc.), as previously described21. Final concentration of cDNA was 6 ng/µL. RT-qPCR reactions were performed in a total volume of 20 μl using 12 ng of cDNA, 10 μl of TaqMan universal PCR master mix (Thermo Fischer Scientific), 900 nM final concentration of each primer (300 nM for IPNV segment A) and 300 nM of probe (150 nM for IPNV segment A). RT-qPCR was performed using the ABI PRISM 7300 System (Thermo Fischer Scientific). Cycling conditions were 50°C for 2 min and 95°C for 10 min, followed by 40 cycles at 95°C for 15 s and 60°C for 1 min.
Gene expression was analyzed by the 2-ΔΔCt method22. The eukaryotic 18S rRNA gene (Cat#4310893E, Thermo Fischer Scientific) was used as endogenous control. Primers and probes are listed in Table 1.
| Gene | Forward primer (5’ – 3‘) | Reverse primer (5’ – 3‘) | Probe (5’ – 3‘) | Reference or accession number |
|---|---|---|---|---|
| IPNV SA | TCTCCCGGGCAGTTCAAGT | CGGTTTCACGATGGGTTGTT | CCAGAACCAGGTGACGAGTATGAGGACTACAT | 20 |
| ef1α | ACCCTCCTCTTGGTCGTTTC | TGATGACACCAACAGCAACA | GCTGTGCGTGACATGAGGCA | 44 |
| tlr3 | ACTCGGTGGTGCTGGTCTTC | GAGGAGGCAATTTGGACGAA | CAAGTTGTCCCGCTGTCTGCTCCTG | NM_001124578.1 |
| irf7 | CCCAGGGTTCAGCTCCACTA | GGTCTGGCAACCCGTCAGT | TCGAGCCAAACACCAGCCCCT | AJ829673 |
| ifn1 | ACCAGATGGGAGGAGATATCACA | GTCCTCAAACTCAGCATCATCTATGT | AATGCCCCAGTCCTTTTCCCAAATC | AM489418.1 |
| mx1–3 | TGAAGCCCAGGATGAAATGG | TGGCAGGTCGATGAGTGTGA | ACCTCATCAGCCTAGAGATTGGCTCCCC | 45 |
| pkr | GACACCGCGTACCGATGTG | GGACGAACTGCTGCCTGAAT | CACCACCTCTGAGAGCGACACCACTTC | NM_001145891.1 |
| il8 | AGAGACACTGAGATCATTGCCAC | CCCTCTTCATTTGTTGTTGGC | 46 | |
| ifnγ | CAAACTGAAAGTCCACTATAAGATCTCCA | TCCTGAATTTTCCCCTTGACATATTT | 47 | |
| tnfα | AGCATGGAAGACCGTCAACGAT | ACCCTCTAAATGGATGGCTGCTT | 48 |
For intracellular staining, mouse polyclonal antibodies against trout IL1β (RRID: AB_2716269)23,24, IL8 (RRID: AB_2716272)25 and TNF-α (RRID: AB_2716270)26 were produced at the laboratory of Dr. Luis Mercado. Rabbit polyclonal antibody against trout Mx3 (RRID: AB_2716267)27,28 was produced at the laboratory of Dr. Amparo Estepa. Anti-IPNV-VP3 monoclonal antibody 2F12 (RRID: AB_2716296) was used for IPNV labelling29. Anti-rabbit IgG (H+L) CF™ 488 antibody produced in goat and anti-mouse IgG (H+L) CF™ 488 antibody produced in goat were used as secondary antibodies for proteins and anti-mouse IgG (H+L) CFTM 647 produced in goat to detect 2F12 antibody.
For western blotting, rabbit polyclonal antibody against human eIF2α-P (Cat# E2152, RRID:AB_259283) and rabbit polyclonal antibody against human α-Actin (Cat#2066, RRID:AB_476693) were purchased from Sigma-Aldrich.
Control and IPNV-exposed RBCs pellets (≈107 cells) were used for protein extraction. Cell pellets were washed 3 times with PBS and then resuspended in 30 µl of PBS with a cocktail of protease inhibitors (Sigma-Aldrich). Then, cells were frozen/thawed 3 times and lysed using an eppendorf micropistile (Eppendorf, Hamburg, Germany). Samples were loaded in Tris–Glycine sodium dodecyl sulfate 12% polyacrylamide gels under reducing conditions. Electrophoresis was performed at 200 V for 60 min. For blotting, the proteins in the gel were transferred for 80 min at 100 V in transfer buffer (2.5 mM Tris, 9 mM glycine, 20% methanol) to nitrocellulose membranes (BioRad, Madrid, Spain). Then, membranes were blocked with 8% dry milk and 1% Tween-20 in PBS and incubated with eIF2α-P or α-Actin antibodies, at the recommended dilutions in PBS containing 0.5% dry milk and 0.5% Tween-20 at 4ºC and overnight. Incubation with secondary antibody GAR-Po (Sigma-Aldrich) was done in 0.5% milk 0.5% Tween-20 in PBS for 45 min. Membranes were washed 3 times with PBS containing 1% dry milk 0.5% Tween-20 for 15 min after every antibody incubation. Finally, the membrane was washed 3 times with PBS before analysis of the peroxidase activity. Peroxidase activity was detected using ECL chemiluminescence reagents (Amersham Biosciences, Buckinghamshire, UK) and revealed by exposure to X-ray. Protein bands from western blotting were analysed by densitometry using the Scion Image 4.0.2 Software (RRID: SCR_008673) (www.scionorg.com).
RBCs were fixed with 4% paraformaldehyde (PFA; Sigma-Aldrich) and 0.08% glutaraldehyde (Sigma-Aldrich) diluted in RPMI medium for 20 minutes. Then, RBCs were incubated with permeabilization buffer containing 0.05% saponin (Sigma-Aldrich) in RPMI, for 15 minutes. Primary antibodies were used at 1/50 dilution for IL-1β, IL-8 and TNF-α, 1/300 for Mx and 1/500 for 2F12 in permeabilization buffer and incubated for 60 minutes at room temperature. Secondary antibodies were incubated for 30 minutes at 1/200 dilution. RBCs were washed with permeabilization buffer after antibody incubations. Finally, RBCs were kept in PFA 1% in PBS. For nuclear staining, RBCs were stained with 1 μg/mL of 4′-6-408 Diamidino-2-phenylindole (DAPI; Sigma-Aldrich) for 5 minutes. Flow cytometry (FC) analysis was done in a BD FACSCanto™ II (BD Biosciences) flow cytometer. Immunofluorescence (IF) images were performed in the INCell Analyzer 6000 Cell imaging system (GE Healthcare, Little Chalfont, UK).
Conditioned medium (CM) was obtained from control and IPNV-exposed RBCs at MOI 0.5, during 3 days. The CMs were clarified at 1600 rpm for 5 min. To test the antiviral activity of the CM, confluent CHSE-214 cells (7.8×10⁴ cells/well), seeded in 96 well plates were pre-treated with 100 µL of each supernatant at the indicated dilutions for 24 hours. After that, CHSE-214 cells were infected as described previously with IPNV at MOI 0.05, for 24 hours. Finally, intracellular stain of IPNV foci was carried out.
CHSE-214 cells were fixed with PFA diluted at 4% in PBS followed by a second fixation with cold methanol. Each fixation step lasted 15 minutes. Cells were washed with PBS after each fixation step. Blocking buffer containing 5% goat serum (Sigma-Aldrich) and 0.3% Triton X-100 (Sigma-Aldrich) was added to each well for 1 hour. Then, anti-VP3 2F12 antibody was diluted 1/500 in antibody dilution buffer (1% BSA (Sigma-Aldrich), 0.3% Triton X-100) and was incubated for 1 hour. FITC-labelled goat anti-rabbit was used as secondary antibody at 1/300 dilution. Cells were washed three times after each antibody incubation with PBS. IF images were taken INCell Analyzer 6000 imaging system. IN Cell Developer Toolbox 1.9.2 (RRID: SCR_015790; GE Healthcare, Little Chalfont, UK) was used to count number of IPNV foci (positive areas after image segmentation were selected when >21000 fluorescence units and >2500 µm2 criteria was reached).
Cell viability was tested using MTT (3-(4,5-dimethylthiazol-2-yl)-2,5-diphenyltetrazolium bromide) colorimetric assay30. Briefly, 25 µl of MTT at a final concentration of 1.9 mg/mL were added to previously treated CHSE-214 cells monolayers, seeded in 96 well plates. Cells were incubated for 3 hours at 21ºC with the reagent. Then, the medium was removed from the wells. Formazan crystals were dissolved in 100 µl of 100% DMSO, incubated for 30 minutes. Absorbance was read at 570 nm in the EONTM microplate spectrophotometer (Biotek, Winooski, VT).
All the figures and graphics show the mean and standard deviation of the data. P-values associated with each graphic are represented by the legends: *, p-value < 0.05; **, p-value < 0.01; ***, p-value < 0.001, ****, p-value < 0.0001. Graphpad Prism 6 (RRID: SCR_002798, www.graphpad.com) (Graphpad Software Inc., San Diego, A) was used to graphic representation and statistical calculus. FC data were analyzed using Flowing Software 2.5.1 (RRID: SCR_015781)(www.flowingsoftware.com) to obtain Mean Fluorescence Intensity (MFI) and Mean Relative Fluorescence Intensity (MRFI) (relative to control cells) values.
Methodology was carried out in accordance with the Spanish Royal Decree RD 53/2013 and EU Directive 2010/63/EU for animals used in research experimentation. All experimental protocols involving animal handling were also reviewed and approved by the Animal Welfare Body and the Research Ethics Committee at the Miguel Hernandez University (approval number 2014.205.E.OEP; 2016.221.E.OEP) and performed by qualified research personnel.
To evaluate the infectivity of IPNV in trout RBCs, RBCs were exposed to IPNV at MOI 0.5 and the viral RNA was evaluated by RT-qPCR in the cell pellet at different times post-exposure. IPNV infectivity was also evaluated in parallel in the CHSE-214 cell line, used as a positive control of infection. IPNV segment A (IPNV-A) RNA levels inside RBCs and CHSE-214 cell line were similar at 1 and 3 hours post-exposure (hpe) (Figure 1A). After 3 hpe, IPNV-A RNA level was 4 logarithms lower in RBCs in comparison with CHSE-214 cells. On the other hand, the titer of IPNV in the supernatants from IPNV-exposed RBCs at a MOI of 0.5 and 5, was evaluated by TCID50, at 3 days post-exposure (dpe), and showed a recovered titer of 5 and 4 logarithms lower, respectively (Figure 1B). Furthermore, the supernatants titrated by RT-qPCR, were below the lowest limit of detection 102 TCID50 (Table 2). Moreover, there was not significant detection of the IPNV VP3 protein inside RBCs at 3 dpe, by means of flow cytometry (FC) (Figure 1C and D).
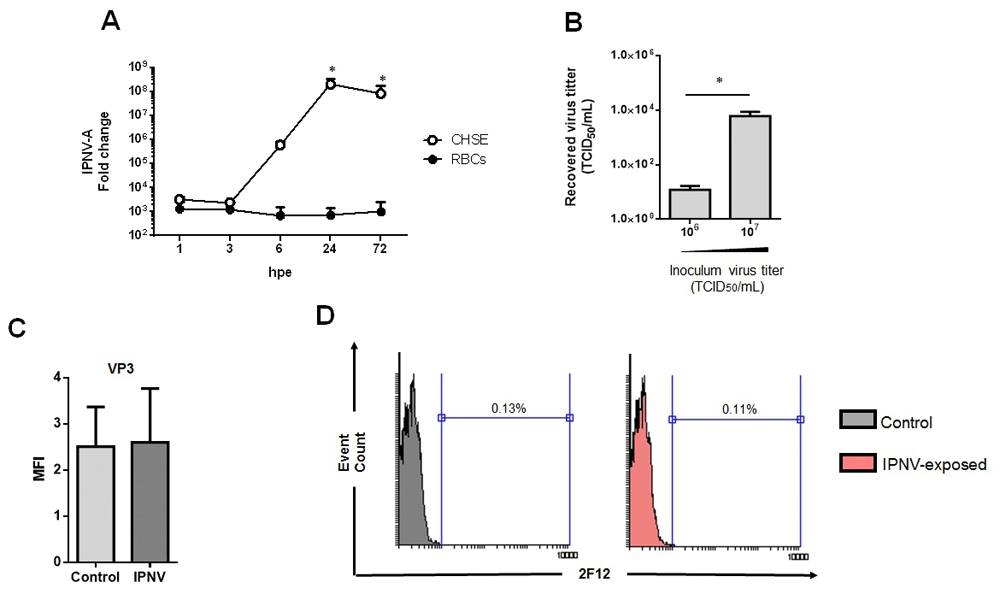
(A) Time-course experiment of the expression of IPNV segment A (IPNV-A) in RBCs (●) (n = 6) and CHSE-214 cells (◌) (n = 2) at MOI 0.5. Data is represented as mean±SD. Kruskal-Wallis Test with Dunn´s Multiple Comparison post-hoc test was performed among all time-points post-exposure in comparison with control time point (0 hpi) (*, p-value < 0.05). (B) Recovered virus titer in supernatants from IPNV-exposed RBCs with an inoculum titer of 106 (MOI 0.5) and 107 (MOI 5) TCID50/mL obtained after 72 hpe (n = 5). Data is represented as mean±SD. Mann-Whitney test was performed among both conditions (*, p-value < 0.05). (C) MFI (mean fluorescence intensity) of viral protein VP3 in control and IPNV-exposed RBCs at MOI 0.5 and 3 dpe (n = 6) Mann-Whitney test was performed among both conditions. (D) Representative flow cytometry histograms of IPNV VP3 protein detection in control and IPNV-exposed RBCs at MOI 0.5 and 3 dpi.
Ct value ± standard deviation from standard line points (108 to 102 dilutions) and supernatans from IPNV-exposed RBCs at MOI 0.5, at 3 and 6 dpe. (n=7 individuals).
The expression levels of ifn1 and the IFN-1 related genes tlr3, irf7, mx1–3 and pkr, were tested in trout RBCs to determine if they could develop an interferon-related antiviral immune response against IPNV exposure, despite IPNV did not infect trout RBCs. The results showed that mx1–3 and pkr genes were significantly expressed at 72 hpe. On the other hand, ifn1 gene presented a tendency to increase its expression after 6 hpe having a peak at 24 hpe. Also, tlr3 gene expression tended to be upregulated at 24 hpe whereas irf7 expression was upregulated at 72 hpe (Figure 2A). Three and six dpe with IPNV, RBCs were stained intracellularly with an anti-Mx antibody and analyzed by FC and immunofluorescence imaging (IF). The results showed a significant increment in the expression of Mx protein at 6 dpe by both FC an IF (Figure 2B and D). FC histograms showed, at 6 dpe, that RBCs depicted distinct peaks of Mx expression, showing that the expression of Mx in RBCs was heterogeneous in the total RBCs population (Figure 2C).
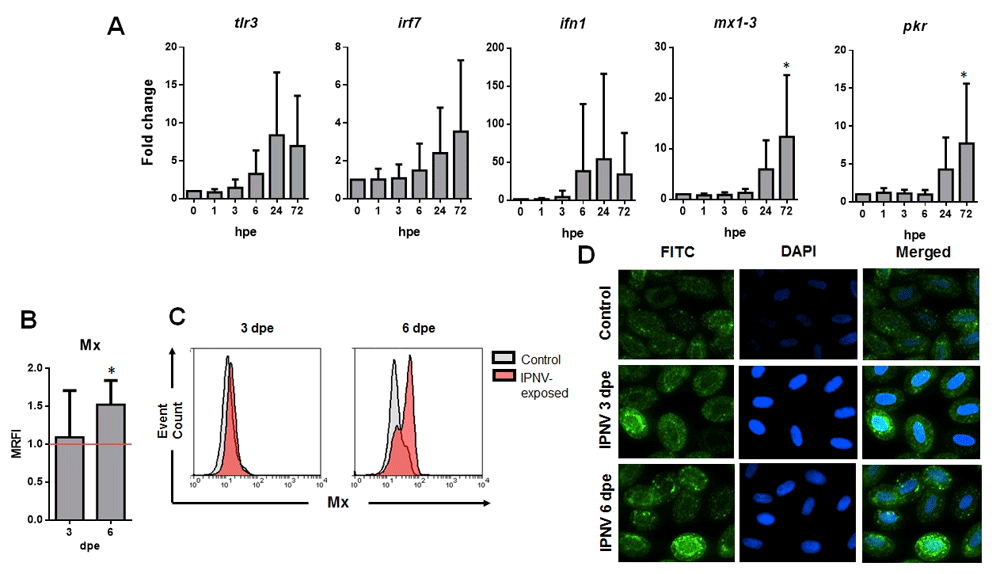
(A) Gene expression of tlr3, irf7, inf1, mx1–3 and pkr in IPNV-exposed RBCs at the indicated times post-infection and MOI 0.5, measured by RT-qPCR. Data represesent mean±SD (n = 6). Kruskal-Wallis Test with Dunn´s Multiple Comparison post-hoc test was performed among all time-points post-exposure in comparison with control time point (0 hpi) (*, p-value < 0.05). (B) Mx protein MRFI (mean relative fluorescent intensity, relative to control cells) in IPNV-exposed RBCs at MOI 0.5 (n = 5). (C) Flow cytometry histograms of Mx protein expression from control (grey) and IPNV-exposed (red) RBCs at MOI 0.5 and the indicated days post-exposure (dpe). (D) Representative immunofluorescence images of Mx protein expression in control and IPNV-exposed RBCs at MOI 0.5 (FITC – Mx protein expression, DAPI - Nuclei) (IF representative of 40 images).
To analyze if IPNV-exposed RBCs could secrete factors that were capable to protect other fish cells against IPNV infection, conditioned medium (CM) from control and IPNV-exposed RBCs (with IPNV titer <10 TCID50/mL) were added to CHSE-214 cells prior to infection. Figure 3A shows a significant decrease in the number of IPNV infective focus forming units (FFU/mL) when pre-treating with 1/5 diluted CM from IPNV-exposed RBCs. CHSE-214 cells viability, by means of an MTT colorimetric assay, was not affected by the exposure to CM (Figure 3B).
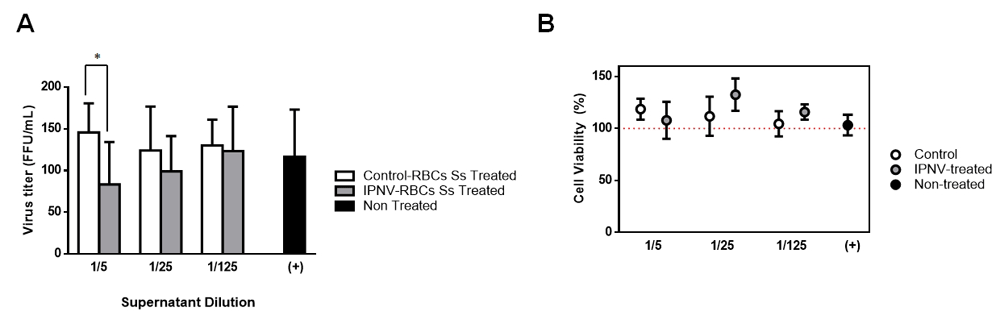
(A) Viral titers (FFU/mL) in CHSE-214 cells infected with IPNV at MOI 0.05 previously non-treated (black) or treated with either supernatans from control RBCs (white) or IPNV-exposed RBCs (grey), during 24 hours, at the indicated dilutions (n = 4, performing triplicates from each individual). Two-way ANOVA test was performed among the different dilutions and conditions to test statistical differences. (B) Percentage of viable CHSE-214 cells pre-treated with conditioned medium from control and IPNV-exposed RBCs, during 24 hours, and relative to non-treated CHSE-214 cells. Percentage of viable cells was calculated as follows: absorbance treated cells/absorbance non-treated cells) x100.
To evaluate whether ex vivo trout RBCs could produce cytokines, in response to IPNV exposure, that could be involved in the protection conferred by their supernatants, RBCs were exposed to IPNV and IL-1 β, IL-8 and TNF-α protein levels were evaluated by means of FC and IF in control and IPNV-exposed cell cultures. The results showed a decrease in the protein expression of IL-1β, IL-8 and TNFα in IPNV-exposed RBCs (Figure 4A).
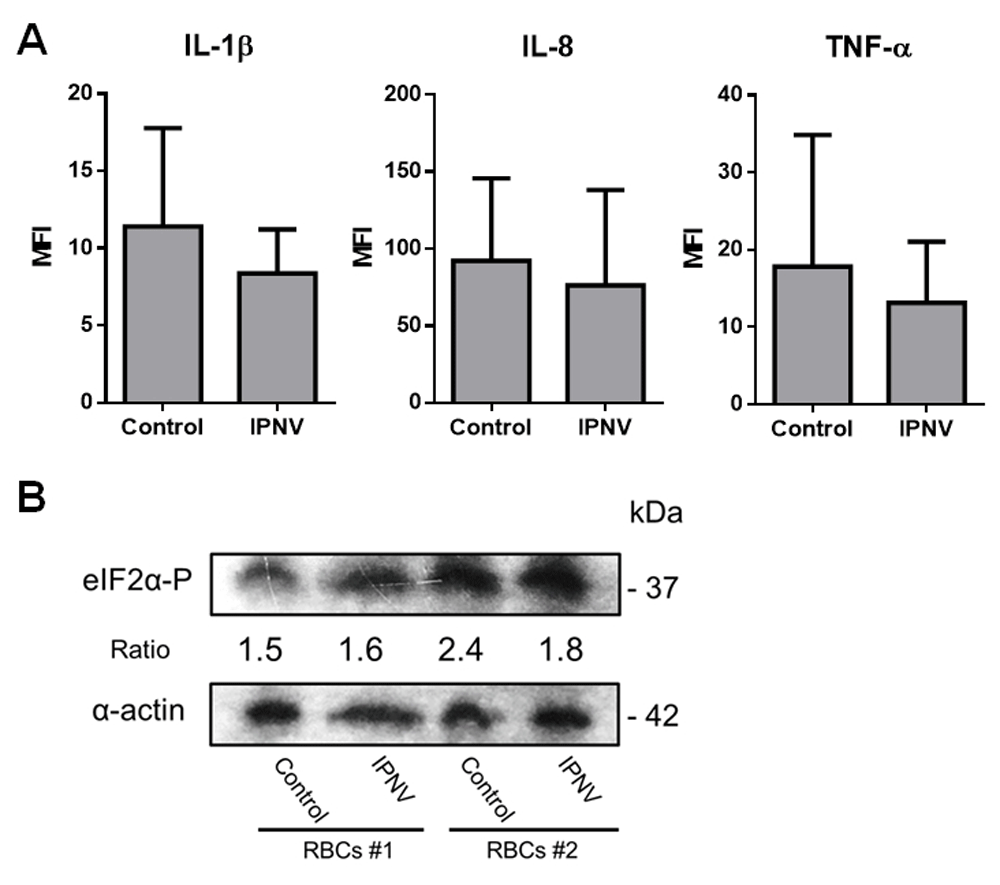
(A) Intracellular MFI values of IL-1β, IL-8 and TNFα from control and IPNV-exposed RBCs at MOI 0.5 and 3 dpe measured by FC (n = 6). Mann-Whitney test was performed among both conditions. (B) Phosphorylation of translation initiation factor eIF2α in IPNV-exposed RBCs. Representative western blot of eIF2α-P in control and IPNV-exposed RBCs from two individuals at MOI 0.5, 3 dpe. Densitometry ratios were done relativizing to α-actin. Mann-Whitney test was performed among both conditions.
The phosphorylation of the translation initiation factor eIF2α is a key mechanism of global inhibition of translational initiation31 and it has been described to happen after IPNV infection in the permissive cell line CHSE-214 cells32. In this sense, since IPNV-exposed RBCs depicted a small downregulation of the evaluated cytokines protein levels, we further investigated whether IPNV exposure could reduce protein translation in RBCs by triggering the phosphorylation of eIF2α. However, the results revealed no changes in the phosphorylation of eIF2α (Figure 4B).
Previously, we have demonstrated that trout RBCs can respond to VHSV, a ssRNA virus not targeting RBCs, halting its replication, downregulating type I interferon-related genes, showing global protein downregulation in the cell and phosphorylation of the translation initiation factor eIF2α (unpublished report, Nombela I, Puente-Marin S, Chico V, Villena A, Carracedo B, Ciordia S, Mena M, Mercado L, Perez L, Coll J, Estepa A, Ortega-Villaizan M).
It is known that IPNV primarily targets pancreatic and liver cells33. It has been also reported that IPNV was detectable in kidney hematopoietic tissue, corpuscles of Stannius, in Islets of Langherhans, in the lamina propria of the pyloric caeca, the gill arch connective tissue, the ventricle of the heart and dermis of the skin33. Our results showed that IPNV did not replicate in RBCs, although small amounts of IPNV were persistently found inside RBCs after 3 dpe (≈ 103 TCID50/mL). Similarly, IPNV has been shown to enter mammalian cells, without significant levels of replication, being this entry suggested to be receptor mediated34. From our results, the persistence of IPNV in RBCs after 72 hpe could point out the entry of the virus inside RBCs. However, we could not verify the presence of the IPNV inside RBCs
Nevertheless, despite the lack of replication of IPNV in RBCs, IPNV could induce an antiviral gene expression mediated by the IFN pathway, as it has been observed in RBCs productive infections with ISAV8 and PRV9. As shown by our results, ifn1 and IFN-1 related genes (irf7, pkr and mx) expression levels were increased time-dependently in response to IPNV-exposure. High inter-individual variability was observed, similarly to that found in the RBCs from salmons challenged with PRV35. In addition, although we could not verify the entry and uncoating of IPNV inside RBCs, we could observe an increment in the expression of the tlr3 gene in parallel to the expression of the other IFN-related genes in IPNV-exposed RBCs. This could indicate the activation of the TLR3/IFN pathway by the presence of intracellular viral dsRNA.
IFN-1 leads to the expression of interferon stimulated genes (ISGs)36. Among ISGs, the antiviral protein Mx has a well characterized antiviral role. Confirming those expectations, our results showed the significant upregulation of the Mx protein 6 dpe, after having a peak of its gene expression at 3 dpe. Previously, a positive correlation between the expression of Mx protein and the inhibition of IPNV in CHSE-214 cells has been established37. Therefore, Mx protein production in IPNV-exposed RBCs could be involved in the low IPNV titers observed. The high basal levels of Mx protein detected inside RBCs, much elevated than those for CHSE-214 cells (Figure S1), could be implicated in the early disappearance of IPNV inside RBCs. A similar hypothesis has been made in the abortive infection of VHSV in the RTS-11 cell line38 and in trout RBCs (unpublished report, Nombela I, Puente-Marin S, Chico V, Villena A, Carracedo B, Ciordia S, Mena M, Mercado L, Perez L, Coll J, Estepa A, Ortega-Villaizan M), where upregulation or high constitutive expression of mx genes was speculated to be related to the inhibition of the virus.
Moreover, our results showed that CM from RBCs exposed to IPNV could partially protect CHSE-214 cells from IPNV infection. Similar to other cell types, this antiviral activity has been also observed in CM of RTS11 and RTG-2 cells exposed to Poly (I:C) (polyinosinic:polycytidylic acid) and/or infected with chum salmon reovirus39. The fact that RBCs can secrete factors that confer protection against IPNV infection in other cell lines could indicate that RBCs, despite not being permissive to IPNV infection, may exhibit an antiviral response. To elucidate which factors could be implicated in this protection, we evaluated the production of cytokines in IPNV-exposed RBCs. Previously, the expression of IL-1β in salmon gill and head kidney tissues40, IL-8 in trout head kidney tissue41 and TNFα in zebrafish embryonic cells42 have been implicated in the immune response against IPNV; therefore, we chose these cytokines to evaluate the immune response of trout RBCs to IPNV exposure. However, our results showed a downregulation of these proteins in IPNV-exposed RBCs.
A shutdown in protein synthesis by phosphorylation of eIF2α has been reported in CHSE-214 cells infected with IPNV32. So far, in trout RBCs, although cytokine protein downregulation was observed, no phosphorylation of eIF2α was detected and Mx protein expression was increased. In contrast, in trout RBCs, VHSV rhabdovirus induced phosphorylation of eIF2α and a cell shut-off characterized by the downregulation of the proteome (unpublished report, Nombela I, Puente-Marin S, Chico V, Villena A, Carracedo B, Ciordia S, Mena M, Mercado L, Perez L, Coll J, Estepa A, Ortega-Villaizan M). On the other hand, IFN-1 has been reported to inhibit the production of IL-1β43.
Further studies are needed to completely understand the molecular mechanism through which IPNV triggers this immune response in trout RBCs. However, the lack of commercial antibodies against fish proteins involved in cell signaling networks limits the study of this area. The implication of RBCs during in vivo IPNV infection and the response against different strains of IPNV remains to be evaluated.
Finally, one of the potential applications of these results is that fish RBCs could be considered mediators of the antiviral response and therefore targets of novel DNA vaccines and of new strategies against fish viral infections.
Dataset 1. Excel file containing qPCR data. Each sheet contains the raw Ct values for the indicated figure numbers, organized by samples (rows) and genes (columns). doi, 10.5256/f1000research.12994.d18284249
Dataset 2. Excel file containing the virus titration data. Contains the virus titer (TCID50/mL) results of the indicated figure number. doi, 10.5256/f1000research.12994.d18284350
Dataset 3. Flow cytometry data. Each folder contains the Flow Cytometry Standard (.fcs) format files. Source data files are organized by figure number, and then by sample number, condition and antibody. doi, 10.5256/f1000research.12994.d18284451
Dataset 4. Excel file containing the Focus Forming Units (FFU) counting for Figure 3A. doi, 10.5256/f1000research.12994.d18284552
Dataset 5. Excel file containing MTT absorbance raw data. doi, 10.5256/f1000research.12994.d18284653
Dataset 6. Excel file containing the densitometry raw data of eIF2α-P and α-Actin western blots. Related uncropped blots are included. doi, 10.5256/f1000research.12994.d18284754
| Views | Downloads | |
|---|---|---|
| F1000Research | - | - |
|
PubMed Central
Data from PMC are received and updated monthly.
|
- | - |
Click here to access the data.
Spreadsheet data files may not format correctly if your computer is using different default delimiters (symbols used to separate values into separate cells) - a spreadsheet created in one region is sometimes misinterpreted by computers in other regions. You can change the regional settings on your computer so that the spreadsheet can be interpreted correctly.
Provide sufficient details of any financial or non-financial competing interests to enable users to assess whether your comments might lead a reasonable person to question your impartiality. Consider the following examples, but note that this is not an exhaustive list:
Sign up for content alerts and receive a weekly or monthly email with all newly published articles
Already registered? Sign in
The email address should be the one you originally registered with F1000.
You registered with F1000 via Google, so we cannot reset your password.
To sign in, please click here.
If you still need help with your Google account password, please click here.
You registered with F1000 via Facebook, so we cannot reset your password.
To sign in, please click here.
If you still need help with your Facebook account password, please click here.
If your email address is registered with us, we will email you instructions to reset your password.
If you think you should have received this email but it has not arrived, please check your spam filters and/or contact for further assistance.
Comments on this article Comments (0)