Keywords
Metabolic phenotypes, two-step cluster, metabolically unhealthy lean, metabolically healthy obese, coronary risk
Metabolic phenotypes, two-step cluster, metabolically unhealthy lean, metabolically healthy obese, coronary risk
Obesity is considered an entity with major morbi-mortality in the world since the end of the 20th century1. Multiples studies have shown its role as an independent risk factor for various cardiometabolic disorders such as hypertension (HTN), dyslipidemias, Type 2 Diabetes Mellitus (T2DM) and cardiovascular disease (CVD)2. For this reason, the actual clinical practice catalogues an obese patient as an “unhealthy” patient and a lean patient is considered “healthy”.
In spite of this, in 1980, Reuben Andresen discovered that in certain groups of individuals the obesity was not a mortality increasing factor, introducing the subtype “Healthy Obese”3. Around 20 years later, Ferranini et al. observed that a group of certain obese nondiabetic non-hypertensive subjects presented low insulin resistance (IR) prevalence, suggesting that this subtype must have a different risk of having T2DM and CVD from the IR obese; also suggesting a different management for them4.
Furthermore, in 1975, Bernstein et al. observed that 11 normal-weight men with type IV or V dyslipidemia presented higher serum glucose levels; and also carried bigger sized adipocytes with respect to their healthy counterparts5. Years later, Ruderman et al. introduced the “Metabolically Unhealthy Normal-Weight” phenotype attributed to lean individuals with metabolic alterations associated to obesity6.
The importance of these atypical metabolic phenotypes lies in the fact that their diagnosis may be challenging for clinicians delaying their detection. Because of this, in recent years, multiple studies have been dedicated to the research of accurate clinical, biochemical, and genetic elements capable to detect these atypical metabolic states, and their evolution.
In this sense, these phenotypes determinants and frequencies have not been deeply researched in Latin-American populations7. The objective of this study is to characterize, from a clinical-biological point of view, the metabolic phenotypes in the population from Maracaibo city, Venezuela.
The Maracaibo City Metabolic Syndrome Prevalence Study (MMSPS) is a cross-sectional study whose purpose is to detect metabolic syndrome and cardiovascular disease risk factors in the adult population from Maracaibo, the second largest city of Venezuela, with approximately 2,500,000 inhabitants, during the period May 2007 – December 2009. The original study included a total of 2230 individuals of both genders, aged between 18–85 years old, and the study protocol was previously reported8. This sub-analysis excluded those individuals with no measurements of serum insulin levels. Patients with past history of diabetes were also excluded because their disease control, evolution and pharmacological treatments would affect the variables in the study.
These subjects were categorized into six groups, first according to their Body Mass Index (BMI) (normal-weight, overweight and obese) and second, to their healthy/unhealthy definition. This categorization was made using the protocol from two-step cluster analysis published previously9. The metabolic variables were chosen as possible metabolic predictors based on their physiological function and biological plausibility. These variables were: mean arterial pressure (MAP), triglycerides (TAG), total cholesterol, HDL-C, HOMA2-IR, HOMA2-βcell, HOMA2-S, fasting blood glucose, non-HDL-C cholesterol, TAG/HDL-C ratio, and high-sensitivity C-Reactive Protein (hs-CRP) levels; waist circumference (WC) was excluded and was assessed as a dependent variable. The predictive strength of these variables was analyzed in accordance to cluster ability and quality, ranging from 0.0 to 1.0. The most appropriate predictive variables selected for each group were: (a) HOMA2-IR and HOMA2-βcell for normal-weight women; (b) HOMA2-IR, HOMA2-βcell and TAG for normal-weight men; (c) HOMA2-IR and HOMA2-βcell for overweight women; (d) HOMA2-IR, HOMA2-βcell, and TAG for overweight men; and (e) HOMA2-IR for male and female obese patients. The two-step cluster analysis with SPSS was conducted in two phases: during the first step (called “precluster”), the subjects were divided into several small subclusters. Then, the obtained subclusters were grouped in preferred number of clusters; if the desired number of clusters was unknown, the SPSS two-step cluster component would find the proper number of clusters automatically. Once the program analyzed the subclusters with the characteristics of each BMI category (as described previously), the subjects were categorized into 6 phenotypes: healthy normal-weight (HNW), metabolically unhealthy normal-weight (MUNW), healthy and metabolically disturbed overweight, metabolically unhealthy obese (MUO), and metabolically healthy obese (MHO). Overweight subjects were excluded from this secondary analysis since they represent a non-conventional group outside the metabolic phenotypes and require separate analysis. The final sample included 1226 subjects (Figure 1).
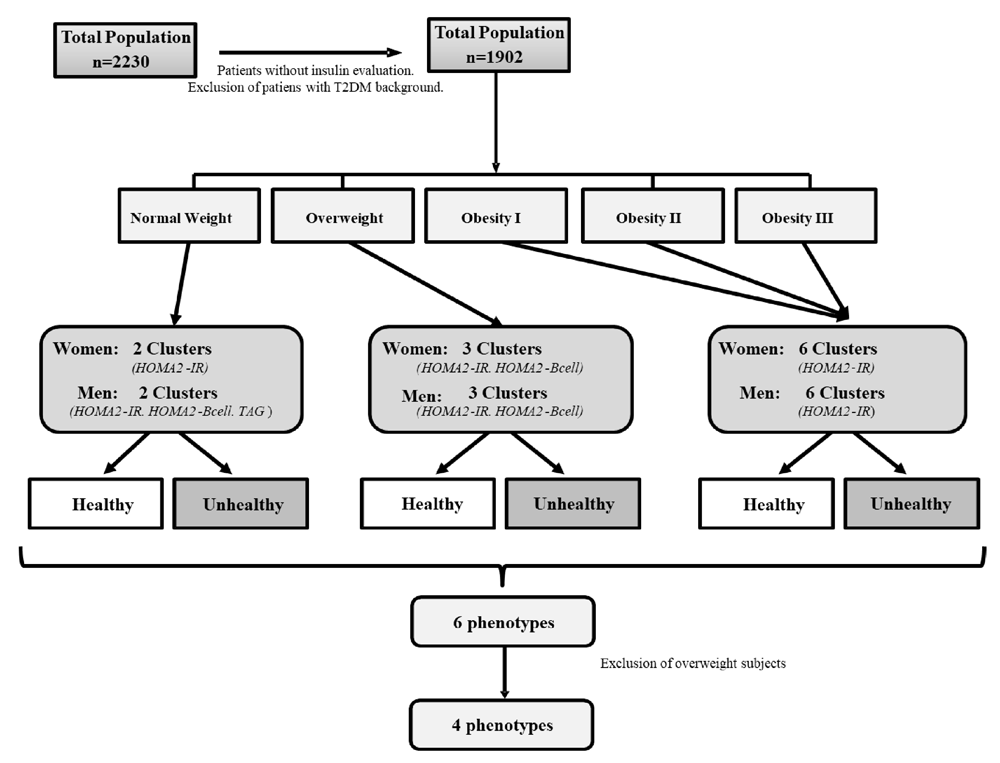
During simple selection, subjects with no measurements of serum insulin levels and patients with past history of diabetes were excluded. These subjects were categorized into six groups, first according to their BMI and second to their healthy/unhealthy definition, using two-step cluster analysis.
Data was collected through completion of a full clinical record carried out by trained personnel, which included interrogation regarding ethnic origin and socioeconomic status by the Graffar scale according to Méndez-Castellano10. The assessment of blood pressure was done by applying the auscultatory technique, and HTN classification was made using the criteria proposed in the VII Joint National Committee on Prevention, Detection, Evaluation, and Treatment of High Blood Pressure11.
For Anthropometric Analysis, an electrical bioelectric scale was used to obtain weight (Tanita, TBF-310 GS Body Composition Analyzer, Tokyo – Japan). Height was measured using a calibrated metric measurement tape, with the subject standing up barefoot. BMI formula (weight/height2) was applied, expressing the results as kg/m2. Obesity was classified applying the WHO criteria12 based on the BMI value. Finally, WC was measured using calibrated measuring tape in accordance to the anatomical landmarks proposed by the USA National Institutes of Health protocol13.
Physical activity. Physical activity (PA) was assessed with the International Physical Activity Questionnaire (IPAQ). For statistical analysis, PA was evaluated in 4 domains: occupational, household, transport, and leisure. In each of these domains, subjects were categorized as follows: (a) inactive, MET/week = 0, or (b) active, MET/week > 0. The latter were then subcategorized by gender-specific MET/week quintiles in each domain (Table 1), which were published previously14.
Maracaibo city, Venezuela.
| MET Quintiles* | Females | Males | ||
|---|---|---|---|---|
| Work Domain | Lower Limit | Upper Limit | Lower Limit | Upper Limit |
| Very Low | 33.00 | 385.99 | 33.00 | 714.99 |
| Low | 386.00 | 1201.49 | 715.00 | 2042.09 |
| Moderate | 1201.50 | 2751.59 | 2042.10 | 3578.39 |
| High | 2751.60 | 4546.79 | 3578.40 | 6495.59 |
| Very High | 4546.80 | 6495.60 | ||
| Transport Domain | Lower Limit | Upper Limit | Lower Limit | Upper Limit |
| Very Low | 33.00 | 131.99 | 33.00 | 164.99 |
| Low | 132.00 | 230.99 | 165.00 | 257.49 |
| Moderate | 231.50 | 346.49 | 247.50 | 521.09 |
| High | 346.50 | 700.79 | 521.10 | 1385.99 |
| Very High | 700.80 | 1386.00 | ||
| Household Domain | Lower Limit | Upper Limit | Lower Limit | Upper Limit |
| Very Low | 30.00 | 539.99 | 30.00 | 269.99 |
| Low | 540.00 | 1139.99 | 270.00 | 629.99 |
| Moderate | 1140.00 | 1919.99 | 630.00 | 1084.99 |
| High | 1920.00 | 3779.99 | 1085.00 | 2429.99 |
| Very High | 3780.00 | 2430.00 | ||
| Leisure Domain | Lower Limit | Upper Limit | Lower Limit | Upper Limit |
| Very Low | 33.00 | 230.99 | 33.00 | 296.99 |
| Low | 321.00 | 445.49 | 297.00 | 791.99 |
| Moderate | 445.50 | 742.49 | 792.00 | 1532.39 |
| High | 742.50 | 1798.79 | 1532.40 | 2879.99 |
| Very High | 1798.80 | 2880.00 | ||
Fasting levels of glucose, cholesterol, TAG, HDL-C, and hs-CRP were assessed in our clinical laboratory using an automatized computer analyzer (Human Gesellschaft fur Biochemica und Diagnostica mbH). LDL-C and VLDL-C levels were calculated applying the Friedewald formulas15. When TAG were over 400 mg/dL measurement was done using lipoprotein electrophoresis and optical densitometry (BioRad GS-800 densitometer, USA). Lipoprotein (a) [Lp(a)] was estimated through the latex turbidimetric method, Human Gesellschaft für Biochemica and Diagnostica, Germany. Likewise, serum hs-CRP levels were quantified employing immunoturbidimetric essays (Human Gesellschaft für Biochemica and Diagnostica MBH). Insulin was determined using an ultrasensitive ELISA method (DRG Instruments GmbH, Germany, International DRG Division, Inc.). For the evaluation of insulin resistance (IR), the HOMA2-IR model proposed by Levy et al. was utilized16 determined through the HOMA-Calculator v2.2.2 program. Visceral Adiposity Index (VAI) calculation was performed with the gender-specific equations proposed by Amato et al.17. The Metabolic Syndrome (MS) diagnosis was done using the Harmonizing-2009 consensus criteria18.
For proper equation calibration, the constants in the formula regarding major cumulative coronary events (lethal and non-lethal myocardial infarction, symptomatic and no symptomatic angina) were substituted with the local statistics obtained from the Vital Statistics Yearbook of the State of Zulia from 2008, where the morbidity and mortality for cardiovascular diseases is registered, the calibration process has been detailed previously19. The coronary risk was classified in 2 categories: <5% in 10 years, and ≥5% in 10 years.
Normal distribution of continuous variables was assessed using Geary’s test; for normally distributed variables, the results were expressed as arithmetic mean ± SD (standard deviation). Variables without normal distribution were logarithmically transformed, and normal distribution subsequently corroborated. When normalization could not be achieved, these variables were expressed as medians (25th percentile–75th percentile). Student’s –test/One-way ANOVA or Mann-Whitney/Kruskal Wallis’s tests were applied to evaluate differences between means or medians, respectively. Qualitative variables were expressed as absolute and relative frequencies, assessed through the χ2 test and the Z test for Proportions.
A logistic regression model was constructed with coronary risk as dependent variable and independent variables: gender, age groups, ethnicity, socioeconomic status, smoking habit, physical activity in leisure time, elevated TAG, and metabolic phenotypes. Database construction and statistical analysis were done using the Statistical Package for the Social Sciences (SPSS) v22 for Windows (IBM Inc., Chicago, IL), results were considered statistically significant when p<0.05.
A total of 1226 individuals were studied, 55.1% (n=676) corresponded to females and 44.9% (n=550) to males. The mean age (years) of the general population was 37.94±14.99. Subjects distribution according to their metabolic phenotype is shown in Figure 2 where the 5.2% (n=64) of the individuals were classified as MUNW, and 17.4% (n=213) as MHO, representing 34.13% from the total of obese subjects, while sociodemographic and metabolic characteristics from the studied simple are shown in Table 2.
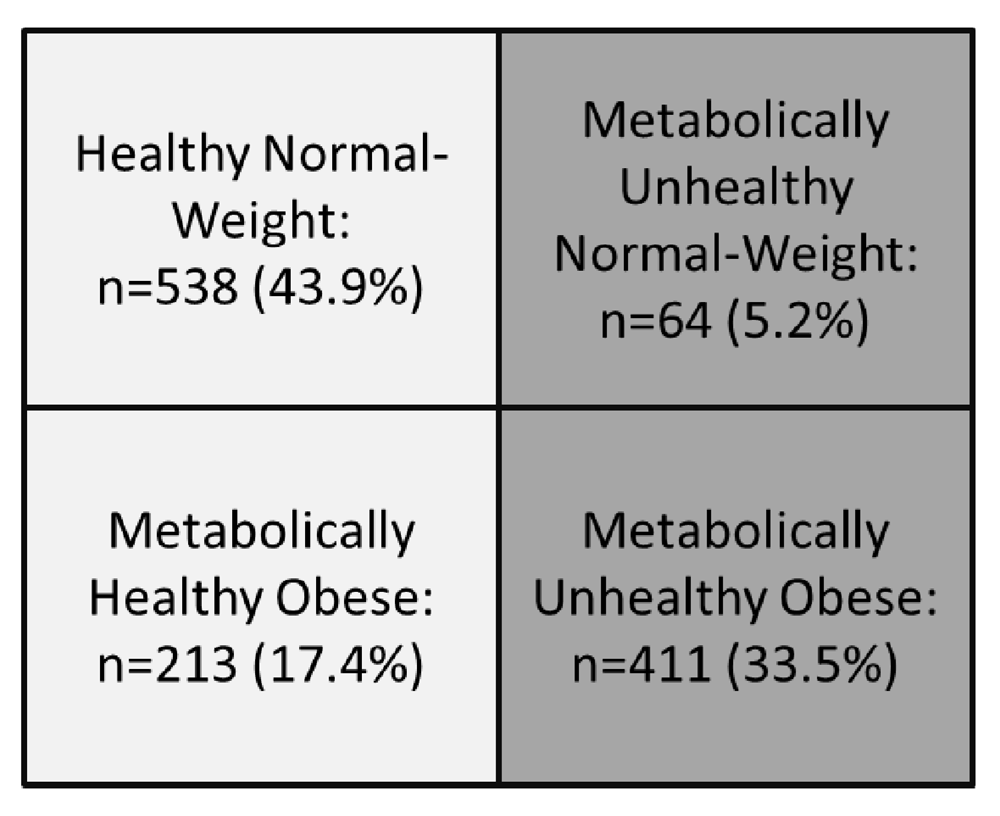
For this sub-analysis overweight subjects were excluded, evaluating only the typical obesity phenotypes with 4 groups.
Maracaibo city, Venezuela.
| Female | Male | Total | ||||
|---|---|---|---|---|---|---|
| n | % | n | % | n | % | |
| Age Group (years) | ||||||
| <30 | 235 | 34.8 | 228 | 41.5 | 463 | 37.8 |
| 30–49 | 253 | 37.4 | 220 | 40.0 | 473 | 38.6 |
| ≥50 | 188 | 27.8 | 102 | 18.5 | 290 | 23.7 |
| Ethnic Groups | ||||||
| Mixed | 512 | 75.7 | 427 | 77.6 | 939 | 76.6 |
| White Hispanic | 111 | 16.4 | 80 | 14.5 | 191 | 15.6 |
| Afrodescendant | 15 | 2.2 | 21 | 3.8 | 36 | 2.9 |
| Indian-American | 30 | 4.4 | 21 | 3.8 | 51 | 4.2 |
| Other | 8 | 1.2 | 1 | 0.2 | 9 | 0.7 |
| Socioeconomic Status | ||||||
| Class I | 15 | 2.2 | 9 | 1.6 | 24 | 2.0 |
| Class II | 116 | 17.2 | 113 | 20.5 | 229 | 18.7 |
| Class III | 253 | 37.4 | 237 | 43.1 | 490 | 40.0 |
| Class IV | 251 | 37.1 | 172 | 31.3 | 423 | 34.5 |
| Class V | 41 | 6.1 | 19 | 3.5 | 60 | 4.9 |
| Smoking Habit | ||||||
| No Smoker | 523 | 77.5 | 351 | 64.3 | 874 | 71.6 |
| Smoker | 76 | 11.3 | 105 | 19.2 | 181 | 14.8 |
| Past Smoker | 76 | 11.3 | 90 | 16.5 | 166 | 13.6 |
| Hypertension‡ | 126 | 18.6 | 144 | 26.2 | 270 | 22.0 |
| Elevated Triglycerides | 139 | 20.6 | 170 | 30.9 | 309 | 25.2 |
| Low HDL-C | 429 | 63.5 | 270 | 49.1 | 699 | 57.0 |
| Metabolic Syndrome* | 250 | 37.0 | 233 | 42.4 | 483 | 39.4 |
| Insulin Resistance† | 317 | 46.9 | 257 | 46.7 | 574 | 46.8 |
| Total | 676 | 100.0 | 550 | 100.0 | 1226 | 100.0 |
In the evaluation of the epidemiologic behavior of the metabolic phenotypes according to sex, we found that HNW and MUO individuals were predominately females (62.5%, n=336; 51.3%, n=211 respectively), while the atypical phenotypes were predominately males (MUNW: 56.3%, n=36; MHO: 52.6%, n=112. χ2=22.53, p<0.001). Likewise, a statistically significant association was found between age groups and metabolic phenotypes (χ2= 211.91, p<0.001), observing a predominance in the < 30 years age group in the normal-weight phenotype (HNW: 56.1%, n=302; MUNW: 57.8%, n=37), whereas the 30–49 age group was predominately obese phenotypes (MHO: 47.9%, n=102; MUO: 50.1%, n=106). There was no statistically significant association between metabolic phenotypes, ethnic groups (χ2= 20.96, p=0.05) and socioeconomic status (χ2= 14.56, p=0.27) (Table 3).
Maracaibo city, Venezuela.
| (HNW) A | (MUNW) B | (MHO) C | (MUO) D | A vs. B | A vs. C | A vs. D | B vs. C | B vs. D | C vs. D | ||||||
|---|---|---|---|---|---|---|---|---|---|---|---|---|---|---|---|
| n | % | n | % | n | % | n | % | χ2 (p)* | p** | p** | p** | p** | p** | p** | |
| Gender | 22.53 (<0.001) | ||||||||||||||
| Female | 336 | 62.5 | 28 | 43.8 | 101 | 47.4 | 211 | 51.3 | <0.05 | <0.05 | <0.05 | NS | NS | NS | |
| Male | 202 | 37.5 | 36 | 56.3 | 112 | 52.6 | 200 | 48.7 | <0.05 | <0.05 | <0.05 | NS | NS | NS | |
| Age Group (years) | 176.63 (<0.001) | ||||||||||||||
| <30 | 302 | 56.1 | 37 | 57.8 | 46 | 21.6 | 78 | 19.0 | NS | <0.05 | <0.05 | <0.05 | <0.05 | NS | |
| 30–49 | 153 | 28.4 | 12 | 18.8 | 102 | 47.9 | 206 | 50.1 | NS | <0.05 | <0.05 | <0.05 | <0.05 | NS | |
| ≥50 | 83 | 15.5 | 15 | 23.4 | 65 | 30.5 | 127 | 30.9 | NS | <0.05 | <0.05 | NS | NS | NS | |
| Ethnic Group | 20.96 (0.05) | ||||||||||||||
| Mixed | 412 | 76.6 | 50 | 78.1 | 169 | 79.3 | 308 | 74.9 | NS | NS | NS | NS | NS | NS | |
| White Hispanic | 74 | 13.8 | 6 | 9.4 | 31 | 14.6 | 80 | 19.5 | NS | NS | NS | NS | NS | NS | |
| Afrodescendant | 16 | 3.0 | 3 | 4.7 | 6 | 2.8 | 11 | 2.7 | NS | NS | NS | NS | NS | NS | |
| Indian-American | 32 | 5.9 | 5 | 7.8 | 6 | 2.8 | 8 | 1.9 | NS | NS | <0.05 | NS | <0.05 | NS | |
| Others | 4 | 0.7 | 0 | 0.0 | 1 | 0.5 | 4 | 1.0 | NS | NS | NS | NS | NS | NS | |
| Socioeconomic Status | 14.56 (0.27) | ||||||||||||||
| Class I | 12 | 2.2 | 0 | 0.0 | 2 | 0.9 | 10 | 2.4 | NS | NS | NS | NS | NS | NS | |
| Class II | 96 | 17.8 | 15 | 23.4 | 35 | 16.4 | 83 | 20.2 | NS | NS | NS | NS | NS | NS | |
| Class III | 213 | 39.6 | 21 | 32.8 | 102 | 47.9 | 154 | 37.5 | NS | NS | NS | NS | NS | NS | |
| Class IV | 187 | 34.8 | 25 | 39.1 | 62 | 29.1 | 149 | 36.3 | NS | NS | NS | NS | NS | NS | |
| Class V | 30 | 5.6 | 3 | 4.7 | 12 | 5.6 | 15 | 3.6 | NS | NS | NS | NS | NS | NS | |
| Total | 538 | 100 | 64 | 100 | 213 | 100 | 411 | 100 | |||||||
Initially, in relation to the smoking habit, the non-smokers were the most frequent group (χ2=30.91; p<0.001), despite the fact MUNW phenotype consisted of the highest percentage of smoking individuals (18.8%, n=12), whereas MUO subjects consisted of the highest proportion of past smoking subjects (20.2%, n=83). On the other side, in the evaluation of the metabolic phenotypes according to PA there was a statistically significant association in the transport-related physical activity (χ2=43.39; p<0.001) and leisure activities (χ2=50.48; p<0.001) (Table 4).
Maracaibo city, Venezuela.
| (HNW) A | (MUNW) B | (MHO) C | (MUO) D | A vs. B | A vs. C | A vs. D | B vs. C | B vs. D | C vs. D | ||||||
|---|---|---|---|---|---|---|---|---|---|---|---|---|---|---|---|
| n | % | n | % | n | % | n | % | χ2 (p)* | p** | p** | p** | p** | p** | p** | |
| Smoking Habit | 30.91 (<0.001) | ||||||||||||||
| No Smoker | 415 | 77.7 | 44 | 68.8 | 154 | 72.6 | 261 | 63.5 | NS | NS | <0.05 | NS | NS | NS | |
| Smoker | 72 | 13.5 | 12 | 18.8 | 30 | 14.2 | 67 | 16.3 | NS | NS | NS | NS | NS | NS | |
| Past Smoker | 47 | 8.8 | 8 | 12.5 | 28 | 13.2 | 83 | 20.2 | NS | NS | <0.05 | NS | NS | NS | |
| Physical Activity Work Sphere | 14.17 (0.51) | ||||||||||||||
| Inactive | 408 | 75.8 | 50 | 78.1 | 159 | 74.6 | 307 | 74.7 | NS | NS | NS | NS | NS | NS | |
| Very Low | 30 | 5.6 | 3 | 4.7 | 10 | 4.7 | 18 | 4.4 | NS | NS | NS | NS | NS | NS | |
| Low | 32 | 5.9 | 5 | 7.8 | 12 | 5.6 | 17 | 4.1 | NS | NS | NS | NS | NS | NS | |
| Moderate | 25 | 4.6 | 2 | 3.1 | 7 | 3.3 | 21 | 5.1 | NS | NS | NS | NS | NS | NS | |
| High | 26 | 4.8 | 3 | 4.7 | 9 | 4.2 | 26 | 6.3 | NS | NS | NS | NS | NS | NS | |
| Very High | 17 | 3.2 | 1 | 1.6 | 16 | 7.5 | 22 | 5.4 | NS | NS | NS | NS | NS | NS | |
| Physical Activity Transport Sphere | 43.39 (<0.001) | ||||||||||||||
| Inactive | 163 | 30.6 | 19 | 30.2 | 87 | 41.0 | 188 | 46.4 | NS | <0.05 | <0.05 | NS | NS | NS | |
| Very Low | 58 | 10.9 | 3 | 4.8 | 32 | 15.1 | 31 | 7.7 | NS | NS | NS | NS | NS | <0.05 | |
| Low | 70 | 13.2 | 7 | 11.1 | 25 | 11.8 | 47 | 11.6 | NS | NS | NS | NS | NS | NS | |
| Moderate | 73 | 13.7 | 9 | 14.3 | 26 | 12.3 | 44 | 10.9 | NS | NS | NS | NS | NS | NS | |
| High | 90 | 16.9 | 14 | 22.2 | 25 | 11.8 | 47 | 11.6 | NS | NS | NS | NS | NS | NS | |
| Very High | 78 | 14.7 | 11 | 17.5 | 17 | 8.0 | 48 | 11.9 | NS | NS | NS | NS | NS | NS | |
| Physical Activity Household Sphere | 24.33 (0.06) | ||||||||||||||
| Inactive | 125 | 23.2 | 15 | 23.4 | 75 | 35.2 | 126 | 30.7 | NS | <0.05 | NS | NS | NS | NS | |
| Very Low | 95 | 17.7 | 11 | 17.2 | 22 | 10.3 | 48 | 11.7 | NS | NS | NS | NS | NS | NS | |
| Low | 86 | 16.0 | 9 | 14.1 | 24 | 11.3 | 60 | 14.6 | NS | NS | NS | NS | NS | NS | |
| Moderate | 83 | 15.4 | 11 | 17.2 | 38 | 17.8 | 63 | 15.3 | NS | NS | NS | NS | NS | NS | |
| High | 73 | 13.6 | 10 | 15.6 | 21 | 9.9 | 54 | 13.1 | NS | NS | NS | NS | NS | NS | |
| Very High | 76 | 14.1 | 8 | 12.5 | 33 | 15.5 | 60 | 14.6 | NS | NS | NS | NS | NS | NS | |
| Physical Activity Leisure Sphere | 50.48 (<0.001) | ||||||||||||||
| Inactive | 305 | 56.7 | 37 | 57.8 | 134 | 62.9 | 290 | 70.6 | NS | NS | NS | NS | NS | NS | |
| Very Low | 42 | 7.8 | 7 | 10.9 | 10 | 4.7 | 27 | 6.6 | NS | NS | NS | NS | NS | NS | |
| Low | 43 | 8.0 | 2 | 3.1 | 23 | 10.8 | 26 | 6.3 | NS | NS | NS | NS | NS | NS | |
| Moderate | 43 | 8.0 | 3 | 4.7 | 19 | 8.9 | 31 | 7.5 | NS | NS | NS | NS | NS | NS | |
| High | 41 | 7.6 | 6 | 9.4 | 20 | 9.4 | 21 | 5.1 | NS | NS | NS | NS | NS | NS | |
| Very High | 64 | 11.9 | 9 | 14.1 | 7 | 3.3 | 16 | 3.9 | NS | <0.05 | <0.05 | <0.05 | <0.05 | NS | |
| Total | 538 | 100 | 64 | 100 | 213 | 100 | 411 | 100 | |||||||
Distribution of subjects according to phenotypes and endocrine-metabolic alterations are shown in Table 5. A high percentage of MUNW and MUO individuals with insulin resistance was found in contrast to healthy subjects (79.7%, n=51 and 97.1%, n=399, respectively). On the other side, a higher percentage of MUNW with high TAG was found (34.4% n=22 vs 9.5% n=51 HNW; p<0.05) and also a higher prevalence of MS (29.7% n=19 vs 12.3% n=66; p<0.05 HNW); similar findings were observed in the obese phenotypes, where a minor prevalence of these alterations were found in the MHO subjects (high TAG levels: 28.8% n=60 vs 42.8% n=176, p<0.05; MS: 53.1% n=113 vs 69.3% n=285, p<0.05). Finally, a significant association was found between the metabolic phenotypes with low HDL-C (χ2=44.08; p<0.0001) and HTN (χ2= 182.22, p<0.0001).
| (HNW) A | (MUNW) B | (MHO) C | (MUO) D | A vs. B | A vs. C | A vs. D | B vs. C | B vs. D | C vs. D | ||||||
|---|---|---|---|---|---|---|---|---|---|---|---|---|---|---|---|
| n | % | n | % | n | % | n | % | χ2 (p)* | p** | p** | p** | p** | p** | p** | |
| HOMA2-IR | 727.9 (<0.0001) | ||||||||||||||
| <2 | 434 | 80.7 | 13 | 20.3 | 193 | 90.6 | 12 | 2.9 | <0.05 | NS | <0.05 | NS | <0.05 | <0.05 | |
| ≥2 | 104 | 19.3 | 51 | 79.7 | 20 | 9.4 | 399 | 97.1 | <0.05 | <0.05 | <0.05 | <0.05 | <0.05 | <0.05 | |
| Hypertension | 182.22 (<0.0001) | ||||||||||||||
| Absent | 331 | 87.3 | 32 | 82.1 | 53 | 43.1 | 96 | 39.8 | NS | <0.05 | <0.05 | <0.05 | <0.05 | NS | |
| Present‡ | 48 | 12.7 | 7 | 17.9 | 70 | 56.9 | 145 | 60.2 | NS | <0.05 | <0.05 | <0.05 | <0.05 | NS | |
| Triglycerides | 142.09 (<0.0001) | ||||||||||||||
| Normal | 487 | 90.5 | 42 | 65.6 | 153 | 71.8 | 235 | 57.2 | <0.05 | <0.05 | <0.05 | NS | NS | <0.05 | |
| High | 51 | 9.5 | 22 | 34.4 | 60 | 28.2 | 176 | 42.8 | <0.05 | <0.05 | <0.05 | NS | NS | <0.05 | |
| HDL-C | 44.08 (<0.0001) | ||||||||||||||
| Normal | 283 | 52.6 | 30 | 46.9 | 85 | 39.9 | 129 | 31.4 | NS | <0.05 | <0.05 | NS | NS | NS | |
| Low | 255 | 47.4 | 34 | 53.1 | 128 | 60.1 | 282 | 68.6 | NS | <0.05 | <0.05 | NS | NS | NS | |
| Metabolic Syndrome | 339.38 (<0.0001) | ||||||||||||||
| Absent | 472 | 87.7 | 45 | 70.3 | 100 | 46.9 | 126 | 30.7 | <0.05 | <0.05 | <0.05 | <0.05 | <0.05 | <0.05 | |
| Present | 66 | 12.3 | 19 | 29.7 | 113 | 53.1 | 285 | 69.3 | <0.05 | <0.05 | <0.05 | <0.05 | <0.05 | <0.05 | |
| Total | 538 | 100 | 64 | 100 | 213 | 100 | 411 | 100 | |||||||
Biochemical and clinical characteristics according to metabolic phenotypes are shown in Table 6. An increasing tendency of their variable levels was observed, except on HOMA2-IR, HOMA2-βcell, HOMA2-S, insulin y glucose levels.
Maracaibo city, Venezuela.
| HNW | MUNW | MHO | MUO | ||||||
|---|---|---|---|---|---|---|---|---|---|
| Mean | SD | Mean | SD | Mean | SD | Mean | SD | p* | |
| Age (years) | 32,5 | 14,7 | 34,1 | 16,5 | 42,9 | 13,5 | 43,1 | 13,2 | <0.001 |
| Body Mass Index (Kg/m2) | 21,9 | 2,1 | 22,9 | 1,7 | 34,5 | 4,7 | 35,4 | 5,6 | <0.001 |
| Waist Circunference (cm) | |||||||||
| Female | 79,3 | 8,2 | 77,2 | 7,1 | 104,4 | 10,6 | 105,5 | 10,1 | <0.001 |
| Male | 81,5 | 6,9 | 86,9 | 7,6 | 109,2 | 11,9 | 116,0 | 15,3 | <0.001 |
| HOMA2-βcell | 127,2 | 40,4 | 204,5 | 88,2 | 118,9 | 37,0 | 188,7 | 80,8 | <0.001 |
| HOMA2-S | 81,9 | 44,6 | 41,0 | 27,3 | 80,6 | 36,9 | 32,8 | 10,5 | <0.001 |
| HOMA2-IR | 1,5 | 0,5 | 3,2 | 1,6 | 1,4 | 0,4 | 3,5 | 1,6 | <0.001 |
| Insulin (µU/mL) | 9,9 | 3,6 | 22,3 | 11,9 | 9,6 | 2,9 | 23,7 | 11,8 | <0.001 |
| Glucose (mg/dL) | 89,3 | 10,1 | 94,9 | 22,7 | 91,9 | 11,3 | 103,2 | 28,9 | <0.001 |
| Total Cholesterol (mg/dL) | 174,9 | 38,8 | 180,1 | 44,9 | 196,5 | 52,3 | 200,8 | 45,4 | <0.001 |
| Triglycerides (mg/dL) ¶ | 73.4 | 53.0–106.0 | 99.1 | 67.9–209.0 | 107.7 | 75.0–164.0 | 135.2 | 97.0–193.0 | <0.001 |
| HDL-C (mg/dL) | |||||||||
| Female | 49,3 | 11,8 | 51,6 | 11,5 | 45,6 | 13,0 | 44,1 | 11,5 | <0.001 |
| Male | 46,0 | 11,2 | 39,5 | 11,8 | 40,2 | 9,9 | 36,7 | 8,5 | <0.001 |
| VLDL-C (mg/dL) | 17,1 | 9,3 | 31,0 | 28,5 | 26,7 | 20,4 | 32,5 | 21,5 | <0.001 |
| LDL-C (mg/dL) | 109,8 | 34,5 | 106,4 | 40,2 | 126,3 | 35,1 | 128,0 | 37,2 | <0.001 |
| Lipoprotein(a) (mg/dL) | 26,1 | 14,0 | 22,2 | 14,7 | 28,7 | 13,4 | 29,3 | 14,1 | <0.001 |
| hs-C Reactive Protein (mg/L) ¶ | 0.297 | 0.070–0.598 | 0.235 | 0.099–0.580 | 0.435 | 0.177–0.814 | 0.562 | 0.195–1.222 | <0.001 |
| Non HDL Cholesterol | 126,9 | 38,6 | 135,3 | 45,5 | 153,8 | 51,9 | 160,3 | 45,1 | <0.001 |
| Triacylglicerides/ HDL-C Index¶ | 1.5 | 1.0–2.4 | 2.4 | 1.4–5.5 | 2.8 | 1.7–4.1 | 3.5 | 2.3–5.5 | <0.001 |
| Visceral Adiposity Index¶ | 1.7 | 0.7–1.8 | 1.6 | 0.9–3.3 | 1.8 | 1.2–2.9 | 2.4 | 1.7–3.9 | <0.001 |
| Systolic Blood Pressure (mmHg) | 111,9 | 13,3 | 115,2 | 15,3 | 125,3 | 18,4 | 125,6 | 17,3 | <0.001 |
| Diastolic Blood Pressure (mmHg) | 71,7 | 9,4 | 73,9 | 10,9 | 81,5 | 12,3 | 81,9 | 11,2 | <0.001 |
An association between metabolically unhealthy phenotypes and a higher risk of a coronary event was found. This association was stronger for unhealthy phenotypes than for their healthy counterparts. However, results were statistically significant for obese individuals (MHO: OR=1.85 CI95%: 1.11-3.09; p=0.02 and MUO: OR=2.09 CI95%: 1.34-3.28; p<0.01) (Table 7).
Maracaibo city, Venezuela.
| Crude Odds Ratio (IC 95%a) | pb | Adjusted Odds Ratio* (IC 95%a) | pb | |
|---|---|---|---|---|
| Metabolic Phenotypes | ||||
| Metabolically Healthy Normal Weight | 1,00 | - | 1,00 | - |
| Metabolically Unhealthy Normal Weight | 3,41 (1,46 - 7,98) | < 0,01 | 2.24 (0,89 - 5.56) | 0,08 |
| Metabolically Healthy Obese | 2,26 (1,40 - 3,64) | < 0,01 | 1.85 (1.11 - 3.09) | 0,02 |
| Metabolically Unhealthy Obese | 2,85 (1,89 - 4,29) | < 0,01 | 2.09 (1.34 - 3.28) | < 0,01 |
Obesity is a prioritized area for the world health systems because of its increasing prevalence, incidence, and associated costs in the last decade20. This disease has been defined classically as “excessive presence of adipose tissue that is injurious for health” and given its association to other chronic-degenerative diseases3,21 has been stereotyped as “more adiposity, more risk”. All the classic methods employed for obesity diagnosis, even central and global, are indirect measurements. For different populations they do not allow to determine the adipose tissue functioning from individuals, even though they have high sensitivity, specificity, and predictive values. Based on this, multiple epidemiologic studies have detected a considerable percentage of individuals who did not enter in the classic “HNW” and “MUO” phenotypes, showing the existence of atypical metabolic phenotypes called “MUNW” and “MHO”3. The defining criteria of these metabolic states differ significantly between studies and are defined under highly subjectivity levels, nonetheless insulin sensitivity and lipid profile are often used to define healthy and unhealthy phenotypes22–24.
Giving this criteria and methods discrepancy, such as the psychobiologic, sociodemographic, and genetic patterns according to latitudes, the phenotype frequency presents high variability25. This could bias the study by selecting predetermined variables and cut-off points to consider an individual as healthy or unhealthy. In this sense, data mining techniques were proposed to avoid potential bias. The program would group subjects according to spontaneous tendencies and biologic behavior of related variables.
Applied studies in Asia reported a prevalence of 8.7%–13.07% and 3.9%–15.5% for MUNW and MHO phenotypes, respectively26,27. Likewise, studies conducted in Europe reported frequencies ranging between 18.9% and 45.8% for the MUNW phenotype, and between 2.1% and 18.5% for the MHO phenotype28–30; a similar variability was observed in American research studies31,32. Latin American reports are scant, however Fanghanel et al.33 showed a 5.8% prevalence of the MUNW phenotype for the Mexico City, similar to the one showed in the present study, whereas contrasting the obese phenotypes the Maracaibo population exhibited the highest prevalence of MHO subjects (17% vs 10.8% of the Mexican population).
The atypical metabolic phenotypes, as MUNW and MHO, tend to be observed in females with more frequency32,34. However, the present study reported these phenotypes were more frequent in males. Significant difference between sexes was found in the MUNW group, similar to the study by Hinnouko et al.35. Smoking habit, age, and physical activity values, were discovered as influencing factors in these findings.
In the same manner, multiple studies have reported that healthy phenotype prevalence decreases with age27,29, but in our population an increase was observed in the frequency of MHO individuals older than 30 years old. Yoo et al.36 did not report differences in this phenotype prevalence between subjects older and younger than 35 years. Regarding the MUNW phenotype in the Maracaibo population, a higher frequency was found in subjects younger than 30 years. A considerable part of epidemiologic studies that evaluate this association possessed samples conformed by subjects older than 35 years. This may limit the establishment of a tendency in frequency of healthy phenotypes according to age. Similarly, factors such as ethnicity from African descendants37 and socioeconomical status38 have been related to the presence of atypical phenotypes, but no relationship was found between these variables in Maracaibo population.
One of the greatest enigmas formulated in relation to the atypical metabolic phenotypes, is focused on its conditioning factors. Psychobiologic habits have been considered key elements in comprehension of its biology and behavior related to time. Diniz et al.39 found a significant association between healthy metabolic phenotypes with absence of smoking habit, also with increased PA levels, such as the present study. Ortega et al.40 reported that MHO subjects present with better cardiorespiratory fitness profiles than their unhealthy counterpart, and by adjusting for this variable the MHO individuals showed less mortality. Other studies report that the phenotypes progression from health to unhealthiness is not related to the smoking habit, alcohol, or quantified PA through indirect methods30 and depends fundamentally on abdominal circumference and visceral adiposity increment.
Regarding to cardiometabolic profiles, our study showed evidence of significantly higher HOMA2-βcell values in all of the unhealthy phenotypes, described previously by the NHANES study41 and by Madeira et al.42. Also higher HOMA2-IR and a lower HOMA2-S demonstrate again the importance to define metabolic states in lean and obese individuals. They could also elevate the risk of developing T2DM and CVD in the unhealthy phenotypes, given their hyper functioning pancreatic beta cell and hyperinsulinemia43.
MHO subjects present with lower HOMA2-IR and higher TAG, LDL-C, PAS, PAD, and hs-CRP levels. In contrast to lean subjects, MHO has higher VAI. The latter constitutes an initial obesity state, without a significant risk of T2DM and CVD in the short term (7–11 years)44, but there is in the long term (>16–30 years)45. The natural history of the MHO is variable, only 16% of MHO individuals stay on that status without alteration for the following 7–8 years46. Those who progress to an unhealthy state present a higher risk of high blood pressure, low-grade inflammation, bad metabolic control and high TAG30. In spite of the metabolic “benign” state of the MHO adipose tissue, non-metabolic complications of obesity, do not exclude these subjects from getting T2DM, CVD, and chronic diseases associated with obesity in the future34,35.
Healthy obese individuals must be classified in categories with higher risk of a coronary event compared to lean subjects. This is consistent with previous reports related to metabolic phenotypes and CVD, suggesting that healthy obese subjects have a higher risk profile in comparison to those with lower BMI36; as well as an increased risk for CVD47 and metabolic disorders such as fatty liver and low-grade inflammation48. Given the above, a profound evaluation of these patients is recommended. This includes not only obese subjects but also those who are overweight, which can go unnoticed in a routine consultation and CVD could be subclinical; as it has been demonstrated by Khan et al. in 475 women from the SWAN study49.
Finally, despite the fact that our report presents a novel method to classify healthy and unhealthy subjects, it is important to mention the difficulty to follow-up these individuals. The latter would show the atypical phenotype stability related to time, as well as the incidence of T2DM and CVD. This was the main limitation of our study. In addition our study lacks nutritional data. For this reason, a thorough and constant evaluation of subjects with atypical metabolic phenotypes is recommended, given their demonstrated unsteadiness in time, and associated non metabolic comorbidities observed especially in the MHO individuals.
Dataset 1: MMSPS metabolic phenotype dataset. BMI: Body Mass Index, WaistC: Waist Circumference, HDL-C: High Density Lipoprotein Cholesterol, VLDL-C: Very Low Density Lipoprotein Cholesterol, LDL-C: Low Density Lipoprotein Cholesterol, Lp(a): Lipoprotein (a), hs-CRP: high Sensitivity C Reactive Protein, Non-HDL-Col: Non-High Density Lipoprotein Cholesterol, TAG/HDL ratio: Triglycerides/High Density Lipoprotein ratio VAI: Visceral Adiposity Index, BP: Blood Pressure, HNW: Healthy Normal-Weight, MUNW: Metabolically Unhealthy Normal-Weight, MUO: Metabolically Unhealthy Obese, MHO: Metabolically Healthy Obese. 10.5256/f1000research.13897.d19335150
The study was approved by the Bioethics Committee of the Endocrine and Metabolic Research Center – University of Zulia (approval number: BEC-006-0305). This ethical approval included all future studies that used the data from the Maracaibo City Metabolic Syndrome Prevalence Study (MMSPS). All participants signed written a informed consent for participation in the study before being questioned and physically examined by a trained team.
CVD: cardiovascular disease
HDL-C: High Density Lipoprotein - Cholesterol
HNW: healthy normal-weight
HOMA: Homeostasis Model Assesment
HTN: hypertension
hs-CRP: high-sensitivity C-Reactive Protein
IR: insulin resistance
LDL-C: Low Density Lipoprotein – Cholesterol
MAP: mean arterial pressure
MET: Metabolic Equivalent
MMSPS: Maracaibo City Metabolic Syndrome Prevalence Study
MHO: metabolically healthy obese
MS: Metabolic Syndrome
MUNW: metabolically unhealthy normal-weight
MUO: metabolically unhealthy obese
PA: Physical activity
SD: standard deviation
TAG: triglycerides
T2DM: Type 2 Diabetes Mellitus
VAI: Visceral Adiposity Index
| Views | Downloads | |
|---|---|---|
| F1000Research | - | - |
|
PubMed Central
Data from PMC are received and updated monthly.
|
- | - |
Click here to access the data.
Spreadsheet data files may not format correctly if your computer is using different default delimiters (symbols used to separate values into separate cells) - a spreadsheet created in one region is sometimes misinterpreted by computers in other regions. You can change the regional settings on your computer so that the spreadsheet can be interpreted correctly.
Provide sufficient details of any financial or non-financial competing interests to enable users to assess whether your comments might lead a reasonable person to question your impartiality. Consider the following examples, but note that this is not an exhaustive list:
Sign up for content alerts and receive a weekly or monthly email with all newly published articles
Already registered? Sign in
The email address should be the one you originally registered with F1000.
You registered with F1000 via Google, so we cannot reset your password.
To sign in, please click here.
If you still need help with your Google account password, please click here.
You registered with F1000 via Facebook, so we cannot reset your password.
To sign in, please click here.
If you still need help with your Facebook account password, please click here.
If your email address is registered with us, we will email you instructions to reset your password.
If you think you should have received this email but it has not arrived, please check your spam filters and/or contact for further assistance.
Comments on this article Comments (0)