Keywords
TCGA, cancer, genomics, epigenomics, bioinformatics
This article is included in the Bioinformatics gateway.
This article is included in the Bioconductor gateway.
This article is included in the RPackage gateway.
TCGA, cancer, genomics, epigenomics, bioinformatics
The National Cancer Institute’s (NCI) Genomic Data Commons (GDC), a data sharing platform that promotes precision medicine in oncology, provides a rich resource of molecular and clinical data. As of 2018, almost 13,000 tumor patient samples across 38 different cancer types and subtypes are freely available for download and analysis. Currently, the platform includes data from The Cancer Genome Atlas (TCGA) and Therapeutically Applicable Research to Generate Effective Treatments (TARGET), with the expectation that many other cancer genomic repositories to be incorporated into GDC over the next few years. The publicly available data have been utilized by researchers for novel discoveries and/or validate important findings related to tumorigenesis, improvements in treatment diagnosis and refinement of tumor classifications. To enhance these findings, several important bioinformatics tools to harness genomics cancer data were developed, many of them belonging to the Bioconductor project1.
TCGAbiolinks2, an R/Bioconductor package, was developed to facilitate the analysis of cancer genomics data by incorporating the query, download and processing steps directly from GDC. This tool allows users to advance their data analysis of cancer genomics by harnessing additional Bioconductor packages thereby allowing users access to a wealth of statistical methodologies. In addition, it can perform integrative data analysis across different types of experimental data types, such as DNA methylation and Gene expression data. A detailed comparison between TCGAbiolinks and other bioinformatics tools to analyze cancer genomics data was previously described2. Although TCGAbiolinks is a suitable R package for most data analysts with a strong knowledge and familiarity with R, specifically those who can comfortably write strings of common R commands, we developed TCGAbiolinksGUI to enable user access to the methodologies offered in TCGAbiolinks and to give users the flexibility of point-and-click style analysis without the need to enter specific arguments. TCGAbiolinksGUI takes in all the important features of TCGAbiolinks and offers a graphics user interface (GUI) thereby eliminating any need to be familiar with TCGAbiolinks’ key functions and arguments. In addition, we added new functions to import users’ own raw data for further integrative analysis with GDC data. Tutorials via online documents and YouTube video instructions are available from the website to assist end-users in taking full advantage of TCGAbiolinks.
Here we present TCGAbiolinksGUI, an R/Bioconductor package which uses the R web application framework Shiny3 to provide a GUI to process, query, download, and perform integrative analyses of GDC data.
The TCGAbiolinksGUI was created using Shiny, a Web Application Framework for R. TCGAbiolinksGUI incorporates several packages, that provide advanced features to enhance Shiny apps, such as shinyjs to add JavaScript actions4, shinydashboard to add dashboards5 and shinyFiles6 to provide access to the server file system. The following R/Bioconductor packages are used as back-ends for the data retrieval and analysis:
• TCGAbiolinks2 which allows to search, download and prepare data from the NCI’s Genomic Data Commons (GDC) data portal into an R object and perform several downstream analysis;
• ELMER (Enhancer Linking by Methylation/Expression Relationship)7,8 which identifies DNA methylation changes in distal regulatory regions and correlate these signatures with the expression of nearby genes to identify transcriptional targets associated with cancer;
• ComplexHeatmap9 to visualize data as oncoprint and heatmaps;
• pathview10 which offers pathway based data integration and visualization;
• maftools11 to analyze, visualize and summarize genomics MAF (Mutation Annotation Format) files.
The user interface has been divided into three main GUI menus. The first menu defines the acquisition of GDC data. The second, the ’Analysis’ menu, is subdivided according to the molecular data types. And the third is dedicated to harnessing integrative analyses. Each menu is described below (see Figure 1):
• Data: Provides a guided approach to search for published molecular subtype information, clinical and molecular data available in GDC. In addition, it downloads and processes the molecular data into an R object that can be used for further analysis. For raw DNA methylation data obtained in the form of Intensity Data (IDAT) files, we provide a pipeline using the R/Bioconductor minfi package to prepare the data for subsequent bioinformatics analysis12 performing a background and dye-bias correction with the preprocessnoob function followed by a detection P-value quality masking (sample-specific)13 and probes overlapping repeats or single nucleotide polymorphisms masking (non-sample specific)14 (Figure 3).
• Clinical analysis: Performs survival analysis to quantify and test survival differences between two or more groups of patients and draws survival curves with the ’number at risk’ table, the cumulative number of events table and the cumulative number of censored subjects table using the R/CRAN package survminer15.
• Epigenetic analysis: Performs a differentially methylated regions (DMR) analysis, visualizes the results through both volcano and heatmap plots, and visualizes the mean DNA methylation level by groups or subtypes. For certain tumor types like Glioma, we have added a function to classify non TCGA derived DNA methylation data into one of the 7 published epigenomic subtypes16 using a RandomForest (RF) trained model derived from DNA methylation signatures available from the Cancer Genome Atlas (Figure 4). Description of how the RF models were created can be found in TCGAbiolinksGUI.data vignette.
• Transcriptomic analysis: Performs a differential expression analysis (DEA), and visualizes the results as either volcano or heatmap plots. Pathway analysis can be performed on a list of differentially expressed genes10.
• Genomic analysis: Visualize and summarize the mutations from MAF (Mutation Annotation Format) files through summary plots and oncoplots using the R/Bioconductor maftools package9,11 (Figure 2 and Figure 6).
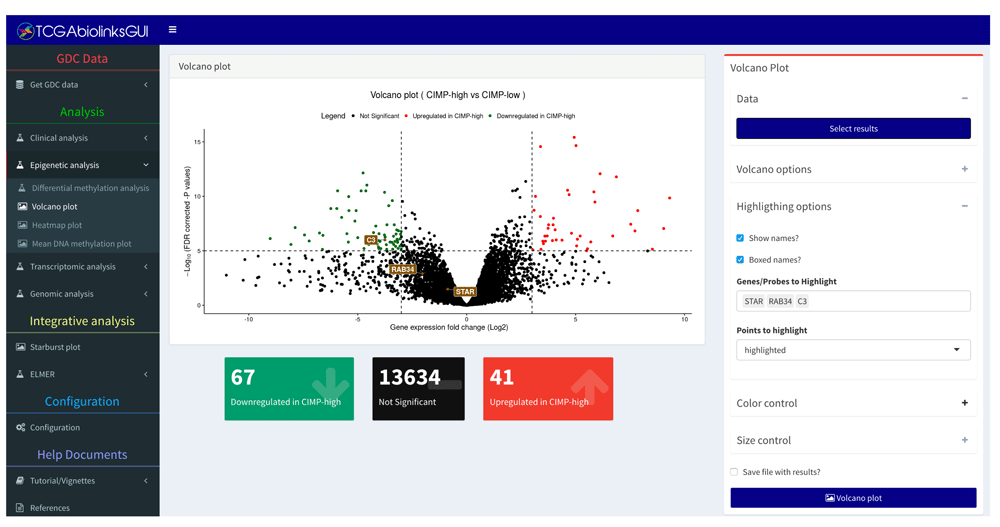
The panel on the left shows the menus divided into different analyses, the panel on the right shows the controls available for the selected menu. In the center is a volcano plot window from the analysis menu. It is possible to control the colors, to change cut-offs, to export results into a CSV document and to export the plot.
• Integrative analysis: Integrate the DMR and DEA results through a starburst plot. Integrate clinical and mutation data by way of a Kaplan-Meier survival analysis for groups of mutated samples vs non-mutated for a given gene (Figure 5). DNA methylation and gene expression data can be further analyzed using the R/Bioconductor ELMER package to discover functionally relevant genomic regions associated with cancer7,8.
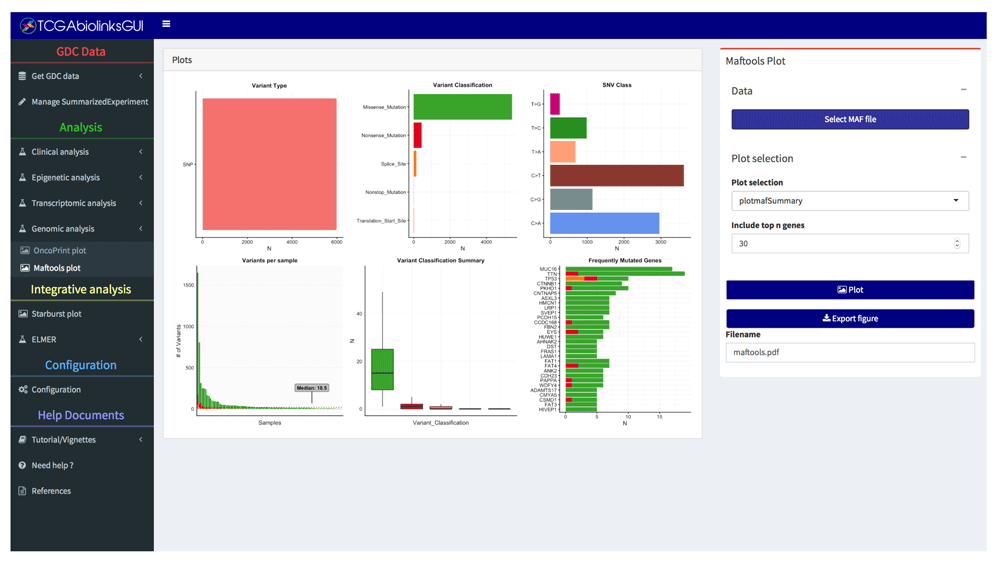
This maftools plot shows a summary of the MAF file. Highlighting the most mutated genes, SNV class, and variant classification distributions within a tumor type.
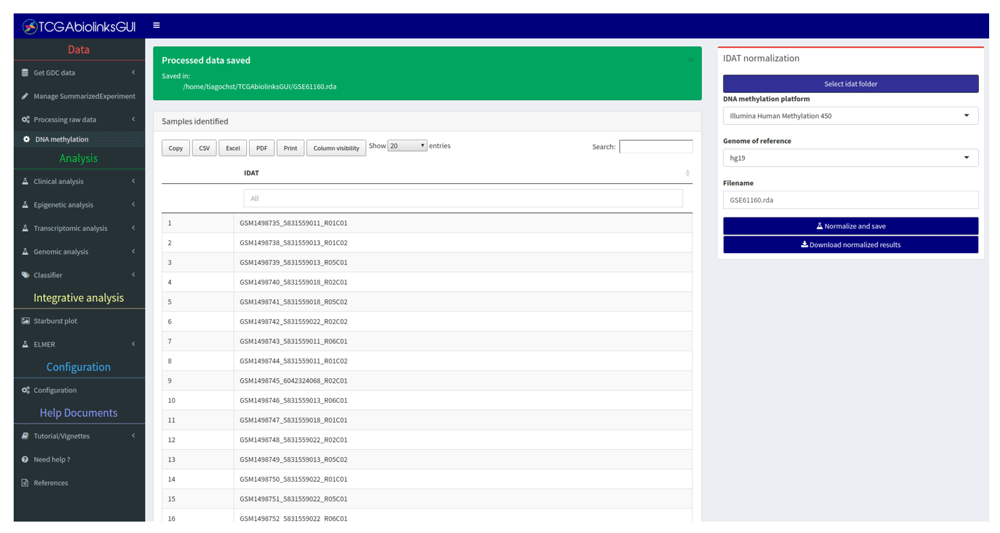
Table lists all files which will be processed. Data retrieved from GEO (accession GSE61160).
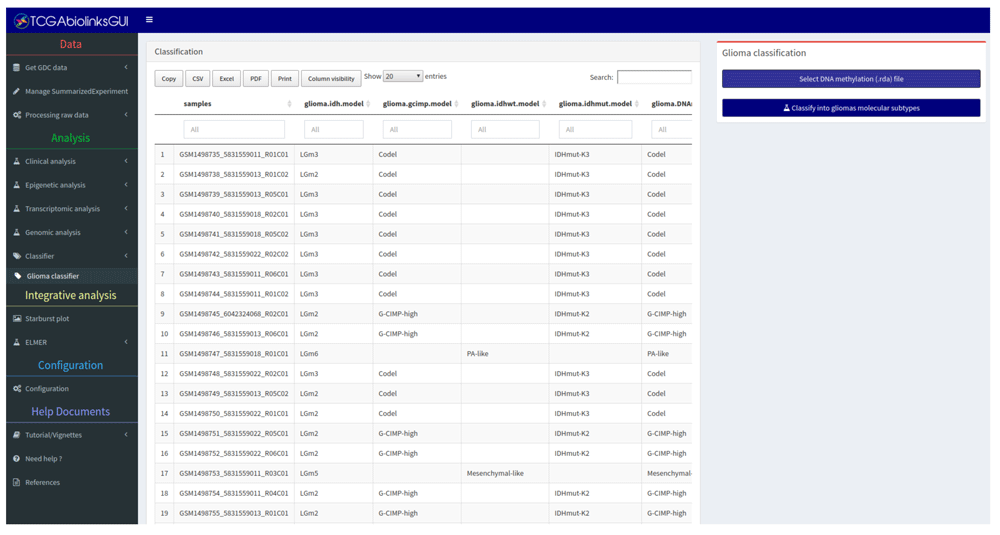
Predicting glioma epigenomic molecular subtypes based on DNA methylation using data from GEO (accession GSE61160).
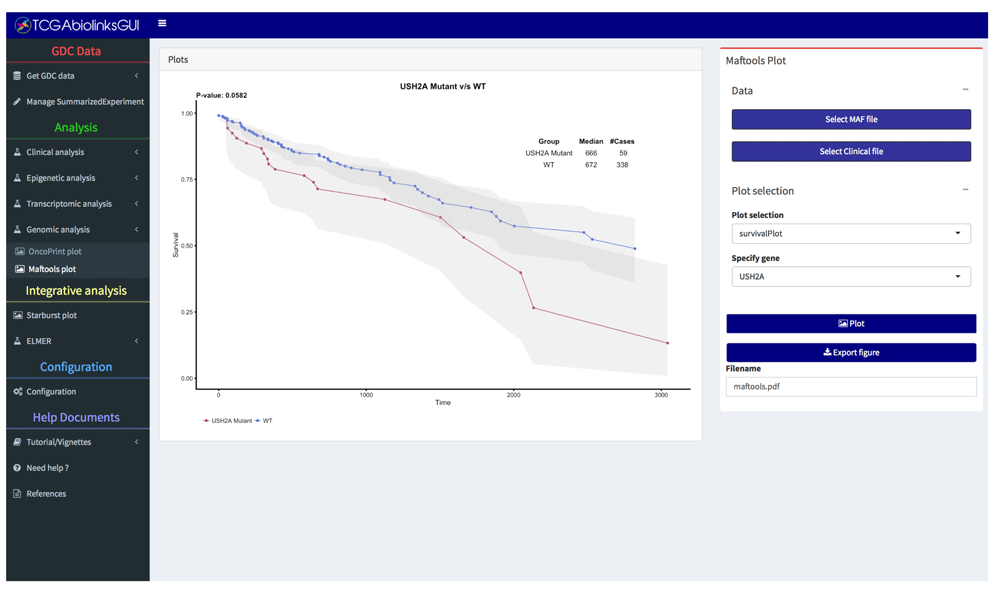
Performing Kaplan-Meier survival analysis for groups of samples with a mutation in gene USH2A vs WT.
We provide a guided tutorial for users via an online vignette document which details each step and menu function. Printable PDF and YouTube video instructions (http://bit.ly/TCGAbiolinksGUI_videoTutorials) are provided to help users utilize TCGAbiolinksGUI. A demonstration version of the tool is available at TCGAbiolinksGUI. To help improve and expand our tool over time, users are encouraged to report and file bug reports or feature requests via our GitHub repository.
We recognize that one of the possible drawbacks of using our tool is the arduous process of installing the R/Bioconductor environment and all of the required dependencies. One solution would be to host the tool on a server, however the high demand for space, computational processing, and access for multiple users would make this approach financially challenging; instead, we encourage users to use it on their own computers. However, to further simplify the usability and accessibility of our tool, we provide a Docker image file that contains the complete R/Bioconductor environment configured to use TCGAbiolinksGUI. This file is compatible with most popular operating systems and it is available online. This image can be easily downloaded and deployed through the Kitematic tool, a simple application for managing Docker containers for Mac, Linux, and Windows. A detailed documentation of how to obtain and use the docker image via the Kitematic application is available at TCGAbiolinksGUI help document. The Docker image will be updated to coincide with any regular updates of TCGAbiolinksGUI. We believe this will provide several types of access for end-users interested in analyzing cancer genomics data stored at GDC.
The package can run on any platform with a R version ≥ 3.4 or higher and Bioconductor version ≥ 3.6 and higher.
To provide end-users with insights and application of TCGAbiolinksGUI; 1) we compare TCGAbiolinksGUI with other published bioinformatics tools and 2) we provide a use-case that allows users a step-bystep guide to analyzing their own cancer molecular data alongside TCGA data.
Web tools used for cancer data analysis might be classified into two broad groups. The first group only provides an interface to existing software analysis tools. The Galaxy project, which is an open, web-based platform for accessible, reproducible, and transparent computational biomedical research, is an example of such a tool that belongs to this group. The other group is composed of exploratory tools mainly focused on the visualization of processed data and pre-computed results. The cBioPortal project17,18, by providing several visualizations for mining the TCGA data, is an example of a tool that falls within this category.
If one were to classify TCGAbiolinksGUI, it would belong to the first group. Compared to the Galaxy project, TCGAbiolinksGUI offers an open platform which improves the accessibility of R/Bioconductor packages, allowing users an advantage to integrate their features with existing Bioconductor packages. Unlike the Galaxy project, which requires the interface elements to be structured through XML files19, TCGAbiolinksGUI can resolve this simply because it was built within the R/Shiny framework. cBioPortal and TCGAbiolinksGUI provide users with access to raw and processed data, however TCGAbiolinksGUI allows users to perform in-depth integrative analysis, a functionality which cBioPortal currently lacks. For example, if a user is interested in defining differentially expressed genes or DNA methylation events between two populations of tumors (i.e. FOXA1 mutants and FOXA1 wildtypes), by using cBioPortal, a user would have to download the gene expression, DNA methylation and mutation data, define the samples per group, and import the data into their favorite statistical tool to identify their list of differentially expressed or methylated genes. Whereas, with TCGAbiolinksGUI, we developed the platform so that the user can define the sample groups based on their mutation spectrum, perform supervised analysis that can then define differentially expressed or methylated gene list and this can be directly ported into pathway analysis. In addition, if the user is interested in observing survival differences between the groups, this can also be done within TCGAbiolinksGUI and thereby reducing the need to exit a specific data platform or having to transform the downloaded data to fit some other statistical platform to achieve the same goals.
In order to illustrate an integrative analysis using TCGAbiolinksGUI, we provide a use case available at https://bioinformaticsfmrp.github.io/Bioc2017.TCGAbiolinks.ELMER/index.html. This use case highlights a step by step guide for one to perform an integrative analysis using TCGA-LUSC (Lung Squamous Cell Carcinoma) data retrieved directly from GDC server20.
TCGAbiolinksGUI was developed to provide a user-friendly interface of our TCGAbiolinks package. TCGAbiolinksGUI is designed specifically for the least experienced R user to import GDC data and perform R/Bioconductor analysis as well as for the most experienced R user, who could execute several of the R/Bioconductor functions without the need to write several lines of R code. For the R/Bioconductor developers, the package has an extensible design feature that allows users 1) to add new features by modifying a few lines of the main code, 2) to add a file with user interface elements on the client side, and 3) add a file with their control on the server side.
Also, TCGAbiolinksGUI supports the most updated R/Bioconductor data structures (i.e. SummarizedExperiment and MultiAssayExperiment) which allow handling data and metadata into one single object and validates several integrity requirements. Thereby, TCGAbiolinksGUI package allows data handling to be as efficient as possible and thereby limits and avoids user errors in data manipulation such as sample removal that involves also metadata deletion.
Finally, several efforts to understand genomic and epigenomic alterations associated with tumor development has been made over the last few years, which presents several bioinformatics challenges, such as data retrieval and integration with clinical data and other molecular data types. By creating a graphical interface to tools like TCGAbiolinks whose relevance is seen in various articles21–23, this package will allow end-users to facilitate the mining of cancer data deposited in GDC, in hopes to aid in analyzing and discovering new functional genomic elements and potential therapeutic targets for cancer.
TCGAbiolinksGUI is a platform independent R package (R ≥ 3.4) available at: https://doi.org/10.18129/B9.bioc.TCGAbiolinksGUI.
Source code TCGAbiolinksGUI is available at: https://github.com/BioinformaticsFMRP/TCGAbiolinksGUI.
License: GNU General Public License version 3 (GNU GPL3)
Complementary data required to execute the package is available at: https://github.com/BioinformaticsFMRP/TCGAbiolinksGUI.data or at https://doi.org/doi:10.18129/B9.bioc.TCGAbiolinksGUI.data24.
Software documentation is available at: https://bioconductor.org/packages/devel/bioc/vignettes/TCGAbiolinksGUI/inst/doc/index.html
Detailed steps of the use case are available at: https://bioinformaticsfmrp.github.io/Bioc2017.TCGAbiolinks.ELMER/index.html.
To install the stable version from the Bioconductor repository http://bioconductor.org/packages/TCGAbiolinksGUI/ please use the following code.
source("https://bioconductor.org/biocLite.R")
biocLite("TCGAbiolinksGUI", dependencies = TRUE)
And to install the development version of the package via GitHub:
source("https://bioconductor.org/biocLite.R")
deps <- c("devtools")
for(pkg in deps) if (!pkg %in% installed.packages()) biocLite(pkg, dependencies = TRUE)
devtools::install_github("tiagochst/ELMER.data")
devtools::install_github("tiagochst/ELMER")
devtools::install_github("BioinformaticsFMRP/TCGAbiolinksGUI.data",ref = "R_3.4")
devtools::install_github("BioinformaticsFMRP/TCGAbiolinksGUI")
This installation process has been tested on a Debian 9.1 machine (the following libraries had to be installed: libpng-dev and libmariadb-client-lgpl-dev (command: sudo apt-get install libpng-dev libmariadbclient-lgpl-dev).
Also, due to the number of libraries loaded we had to increase the maximum number of DLL R can load, for more information please check the vignette section "Increasing loaded DLL".
> sessionInfo()
R version 3.4.1 (2017-06-30)
Platform: x86_64-pc-linux-gnu (64-bit)
Running under: Debian GNU/Linux 9 (stretch)

Matrix products: default
BLAS/LAPACK: /usr/lib/libopenblasp-r0.2.19.so

locale:
 [1] LC_CTYPE=en_US.UTF-8        LC_NUMERIC=C
 [3] LC_TIME=en_US.UTF-8         LC_COLLATE=en_US.UTF-8
 [5] LC_MONETARY=en_US.UTF-8     LC_MESSAGES=C
 [7] LC_PAPER=en_US.UTF-8        LC_NAME=C
 [9] LC_ADDRESS=C              LC_TELEPHONE=C
[11] LC_MEASUREMENT=en_US.UTF-8 LC_IDENTIFICATION=C

attached base packages:
[1] stats     graphics  grDevices utils     datasets  methods  base

other attached packages:
[1] TCGAbiolinksGUI.data_0.99.4 shinydashboard_0.6.1
[3] BiocInstaller_1.28.0
loaded via a namespace (and not attached):
  [1] R.utils_2.6.0                    tidyselect_0.2.3
  [3] RSQLite_2.0                      AnnotationDbi_1.40.0
  [5] htmlwidgets_0.9                  grid_3.4.1
  [7] BiocParallel_1.12.0             ELMER_2.2.7
  [9] devtools_1.13.4                  DESeq_1.30.0
 [11] munsell_0.4.3                    codetools_0.2-15
 [13] withr_2.1.1                      colorspace_1.3-2
 [15] Biobase_2.38.0                   knitr_1.18
 [17] rstudioapi_0.7                   stats4_3.4.1
 [19] robustbase_0.92-8               dimRed_0.1.0
 [21] git2r_0.20.0                     GenomeInfoDbData_1.0.0
 [23] mnormt_1.5-5                     hwriter_1.3.2
 [25] KMsurv_0.1-5                     bit64_0.9-7
 [27] downloader_0.4                   ipred_0.9-6
 [29] biovizBase_1.26.0               ggthemes_3.4.0
 [31] EDASeq_2.12.0                    ELMER.data_2.2.2
 [33] R6_2.2.2                         doParallel_1.0.11
 [35] GenomeInfoDb_1.14.0             locfit_1.5-9.1
 [37] DRR_0.0.2                        AnnotationFilter_1.2.0
 [39] bitops_1.0-6                     reshape_0.8.7
 [41] DelayedArray_0.4.1              assertthat_0.2.0
 [43] scales_0.5.0                     nnet_7.3-12
 [45] gtable_0.2.0                     ddalpha_1.3.1
 [47] sva_3.26.0                       ensembldb_2.2.0
 [49] timeDate_3042.101               rlang_0.1.6
 [51] CVST_0.2-1                       genefilter_1.60.0
 [53] cmprsk_2.2-7                     RcppRoll_0.2.2
 [55] GlobalOptions_0.0.12            splines_3.4.1
 [57] rtracklayer_1.38.2              lazyeval_0.2.1
 [59] ModelMetrics_1.1.0              acepack_1.4.1
 [61] dichromat_2.0-0                   selectr_0.3-1
 [63] broom_0.4.3                     checkmate_1.8.5
 [65] yaml_2.1.16                     reshape2_1.4.3
 [67] GenomicFeatures_1.30.0          backports_1.1.2
 [69] httpuv_1.3.5                    Hmisc_4.1-1
 [71] RMySQL_0.10.13                  caret_6.0-78
 [73] lava_1.5.1                      tools_3.4.1
 [75] psych_1.7.8                     ggplot2_2.2.1
 [77] RColorBrewer_1.1-2                BiocGenerics_0.24.0
 [79] MultiAssayExperiment_1.4.4      Rcpp_0.12.14
 [81] plyr_1.8.4                      base64enc_0.1-3
 [83] progress_1.1.2                  zlibbioc_1.24.0
 [85] purrr_0.2.4                     RCurl_1.95-4.9
 [87] prettyunits_1.0.2               ggpubr_0.1.6
 [89] rpart_4.1-11                      GetoptLong_0.1.6
 [91] sfsmisc_1.1-1                     S4Vectors_0.16.0
 [93] zoo_1.8-0                          SummarizedExperiment_1.8.1
 [95] ggrepel_0.7.0                   cluster_2.0.6
 [97] magrittr_1.5                    data.table_1.10.4-3
 [99] circlize_0.4.3                  survminer_0.4.1
[101] ProtGenerics_1.10.0             matrixStats_0.52.2
[103] aroma.light_3.8.0               hms_0.4.0
[105] mime_0.5                        xtable_1.8-2
[107] XML_3.98-1.9                      IRanges_2.12.0
[109] gridExtra_2.3                   shape_1.4.3
[111] compiler_3.4.1                  biomaRt_2.34.1
[113] tibble_1.4.1                    R.oo_1.21.0
[115] htmltools_0.3.6                 mgcv_1.8-22
[117] Formula_1.2-2                   tidyr_0.7.2
[119] geneplotter_1.56.0              lubridate_1.7.1
[121] DBI_0.7                         matlab_1.0.2
[123] ComplexHeatmap_1.17.1           MASS_7.3-48
[125] ShortRead_1.36.0                Matrix_1.2-12
[127] readr_1.1.1                     R.methodsS3_1.7.1
[129] gower_0.1.2                     parallel_3.4.1
[131] Gviz_1.22.2                     bindr_0.1
[133] GenomicRanges_1.30.1            pkgconfig_2.0.1
[135] km.ci_0.5-2                       GenomicAlignments_1.14.1
[137] foreign_0.8-69                    plotly_4.7.1
[139] recipes_0.1.1                   xml2_1.1.1
[141] foreach_1.4.4                   annotate_1.56.1
[143] XVector_0.18.0                  prodlim_1.6.1
[145] rvest_0.3.2                     stringr_1.2.0
[147] VariantAnnotation_1.24.2        digest_0.6.13
[149] ConsensusClusterPlus_1.42.0     Biostrings_2.46.0
[151] TCGAbiolinks_2.6.9              survMisc_0.5.4
[153] htmlTable_1.11.1                edgeR_3.20.5
[155] kernlab_0.9-25                    curl_3.1
[157] shiny_1.0.5                     Rsamtools_1.30.0
[159] rjson_0.2.15                    nlme_3.1-131
[161] jsonlite_1.5                    bindrcpp_0.2
[163] viridisLite_0.2.0               limma_3.34.5
[165] BSgenome_1.46.0                 pillar_1.0.1
[167] lattice_0.20-35                   DEoptimR_1.0-8
[169] httr_1.3.1                      survival_2.41-3
[171] interactiveDisplayBase_1.16.0   glue_1.2.0
[173] iterators_1.0.9                 bit_1.1-12
[175] class_7.3-14                      stringi_1.1.6
[177] blob_1.1.0                      AnnotationHub_2.10.1
[179] latticeExtra_0.6-28               memoise_1.1.0
[181] dplyr_0.7.4
This work has been supported by a grant from Henry Ford Hospital (H.N.) and by the São Paulo Research Foundation (FAPESP) (2016/01389-7 to T.C.S. & H.N. and 2015/07925-5 to H.N.) the BridgeIRIS project, funded by INNOVIRIS, Region de Bruxelles Capitale, Brussels, Belgium, and by GENomic profiling of Gastrointestinal Inflammatory-Sensitive CANcers (GENGISCAN), Belgian FNRS PDR (T100914F to A.C., C.O.& G.B.). T.C.S. and B.P.B. were supported by the NCI Informatics Technology for Cancer Research program, NIH/NCI grant 1U01CA184826 and Genomic Data Analysis Network NIH/NCI grant 1U24CA210969.
The funders had no role in study design, data collection and analysis, decision to publish, or preparation of the manuscript.
We are grateful to the OMICs lab and the GDC team for suggestions in the design of TCGAbiolinksGUI interface. We are also grateful for Susan MacPhee for critical review of the manuscript and vignettes.
| Views | Downloads | |
|---|---|---|
| F1000Research | - | - |
|
PubMed Central
Data from PMC are received and updated monthly.
|
- | - |
Is the rationale for developing the new software tool clearly explained?
Yes
Is the description of the software tool technically sound?
Yes
Are sufficient details of the code, methods and analysis (if applicable) provided to allow replication of the software development and its use by others?
Yes
Is sufficient information provided to allow interpretation of the expected output datasets and any results generated using the tool?
Yes
Are the conclusions about the tool and its performance adequately supported by the findings presented in the article?
Yes
Competing Interests: No competing interests were disclosed.
Is the rationale for developing the new software tool clearly explained?
Yes
Is the description of the software tool technically sound?
Yes
Are sufficient details of the code, methods and analysis (if applicable) provided to allow replication of the software development and its use by others?
Yes
Is sufficient information provided to allow interpretation of the expected output datasets and any results generated using the tool?
No
Are the conclusions about the tool and its performance adequately supported by the findings presented in the article?
Yes
Competing Interests: No competing interests were disclosed.
Reviewer Expertise: Bioinformaitcs, next generation sequencing, R packages development, visualization
Alongside their report, reviewers assign a status to the article:
| Invited Reviewers | ||
|---|---|---|
| 1 | 2 | |
|
Version 1 10 Apr 18 |
read | read |
Provide sufficient details of any financial or non-financial competing interests to enable users to assess whether your comments might lead a reasonable person to question your impartiality. Consider the following examples, but note that this is not an exhaustive list:
Sign up for content alerts and receive a weekly or monthly email with all newly published articles
Already registered? Sign in
The email address should be the one you originally registered with F1000.
You registered with F1000 via Google, so we cannot reset your password.
To sign in, please click here.
If you still need help with your Google account password, please click here.
You registered with F1000 via Facebook, so we cannot reset your password.
To sign in, please click here.
If you still need help with your Facebook account password, please click here.
If your email address is registered with us, we will email you instructions to reset your password.
If you think you should have received this email but it has not arrived, please check your spam filters and/or contact for further assistance.
Comments on this article Comments (0)