Keywords
decimal places, meta-research, readability, statistics
This article is included in the Research on Research, Policy & Culture gateway.
decimal places, meta-research, readability, statistics
“Everything should be made as simple as possible, but not simpler.” Albert Einstein (paraphrased).
Scientists read papers in order to keep up with the latest developments in their field and improve their research. However, the ever-increasing number of papers is placing greater demands on scientists’ time. In 2010 there were an estimated 75 trials and 11 systematic reviews published per day in the field of health and medicine1, and by 2012 the number of systematic reviews had more than doubled to 26 per day2. Papers have also become less readable over time, with an increase in the use of scientific jargon3.
Poorly presented numbers can decrease readability and can distort or even hide important information. Statistical software packages show results to many decimal places, but this level of accuracy may be spurious, and authors may overcrowd a paper with numbers if they copy the results from software without considering what level of accuracy is appropriate. Papers have been criticised for using too many decimal places, for example, a recent study of just 27 patients that displayed odds ratios to two decimal places4. Journal impact factors have also been frequently criticised for spurious accuracy, as they are quoted to three decimal places5.
Authors may also over-simplify numbers by rounding and losing important information. For example, a review of the gender bias in funding peer review reported in a results table that 20% of applicants were female in a study of 41,727 applications6, so from these results we only know that the number of female applicants was somewhere between 8,137 and 8,554, a range of 417. To use these results in a meta-analysis it would be better to know the actual number of applicants. The large sample size in this example means that potentially useful information is lost by rounding the percent to an integer.
Authors must strike a balance between presenting numbers with too little or too much detail. The abstract and discussion are a summary of the findings, and here numbers can be rounded to make sentences easier to read. Numbers in the results section and tables can be presented with more detail, because they can be an accurate record of the data (e.g., for meta-analysis) and the reader is usually not expected to read every number in a table, especially a large table. Of course, tables can be made clearer by reducing unnecessary numbers, and so allowing the reader to easily comprehend the key information. There is a similar balance to consider when using acronyms in papers, as an overuse of acronyms can make a paper hard to understand because readers need to retrieve additional information, whereas using established acronyms can speed up reading.
There are guidelines by Cole7 for presenting numerical data, including means, standard deviations, percentages and p-values. These guidelines are part of the wider EQUATOR guidelines for “Enhancing the QUAlity and Transparency Of health Research” http://www.equator-network.org/8. Cole’s guidelines for percentages are:
Integers or one decimal place for values under 10%, e.g., 1.1%
Integers for values above 10%, e.g., 22% not 22.2%
One decimal place may be needed for values between 90% to 100% when 100% is a natural upper bound, for example the sensitivity of a test, e.g., 99.9% not 100%
Use two or more decimal places only if the range of percents being compared is less than 0.1%, e.g., 50.50% versus 50.55%
There are also guidelines from journals and style guides. For example, the instructions to authors for the journal Australian Zoologist state that, “Numbers should have a reasonable and consistent number of decimal places.” The Australian style guide also recommends a consistent number of decimal places when comparing numbers, so “1.23 vs 4.56” not “1.23 vs 4.5”9. The Economist style guide recommends, “resisting the precision of more than one decimal place, and generally favouring rounding off. Beware of phoney over-precision.”10
It is not clear whether Cole’s guidelines on presenting numerical data are being adhered to, or if there is generally too little or too much rounding in published papers. An audit of 1,250 risk ratios and associated confidence intervals from the abstracts of BMJ papers between 2011 to 2013 found that one quarter of confidence intervals and an eighth of estimates could have been presented better11.
This paper examines a large sample of percents in recent abstracts for multiple journals to examine how they are being presented.
I extracted percentages from abstracts available in PubMed using the “rentrez” R package (version 1.1.0)12. Example abstracts are referred to using their PubMed ID number rather than citing the paper, and readers can find the paper’s details by putting the number into a PubMed search with the search term “[PMID]”.
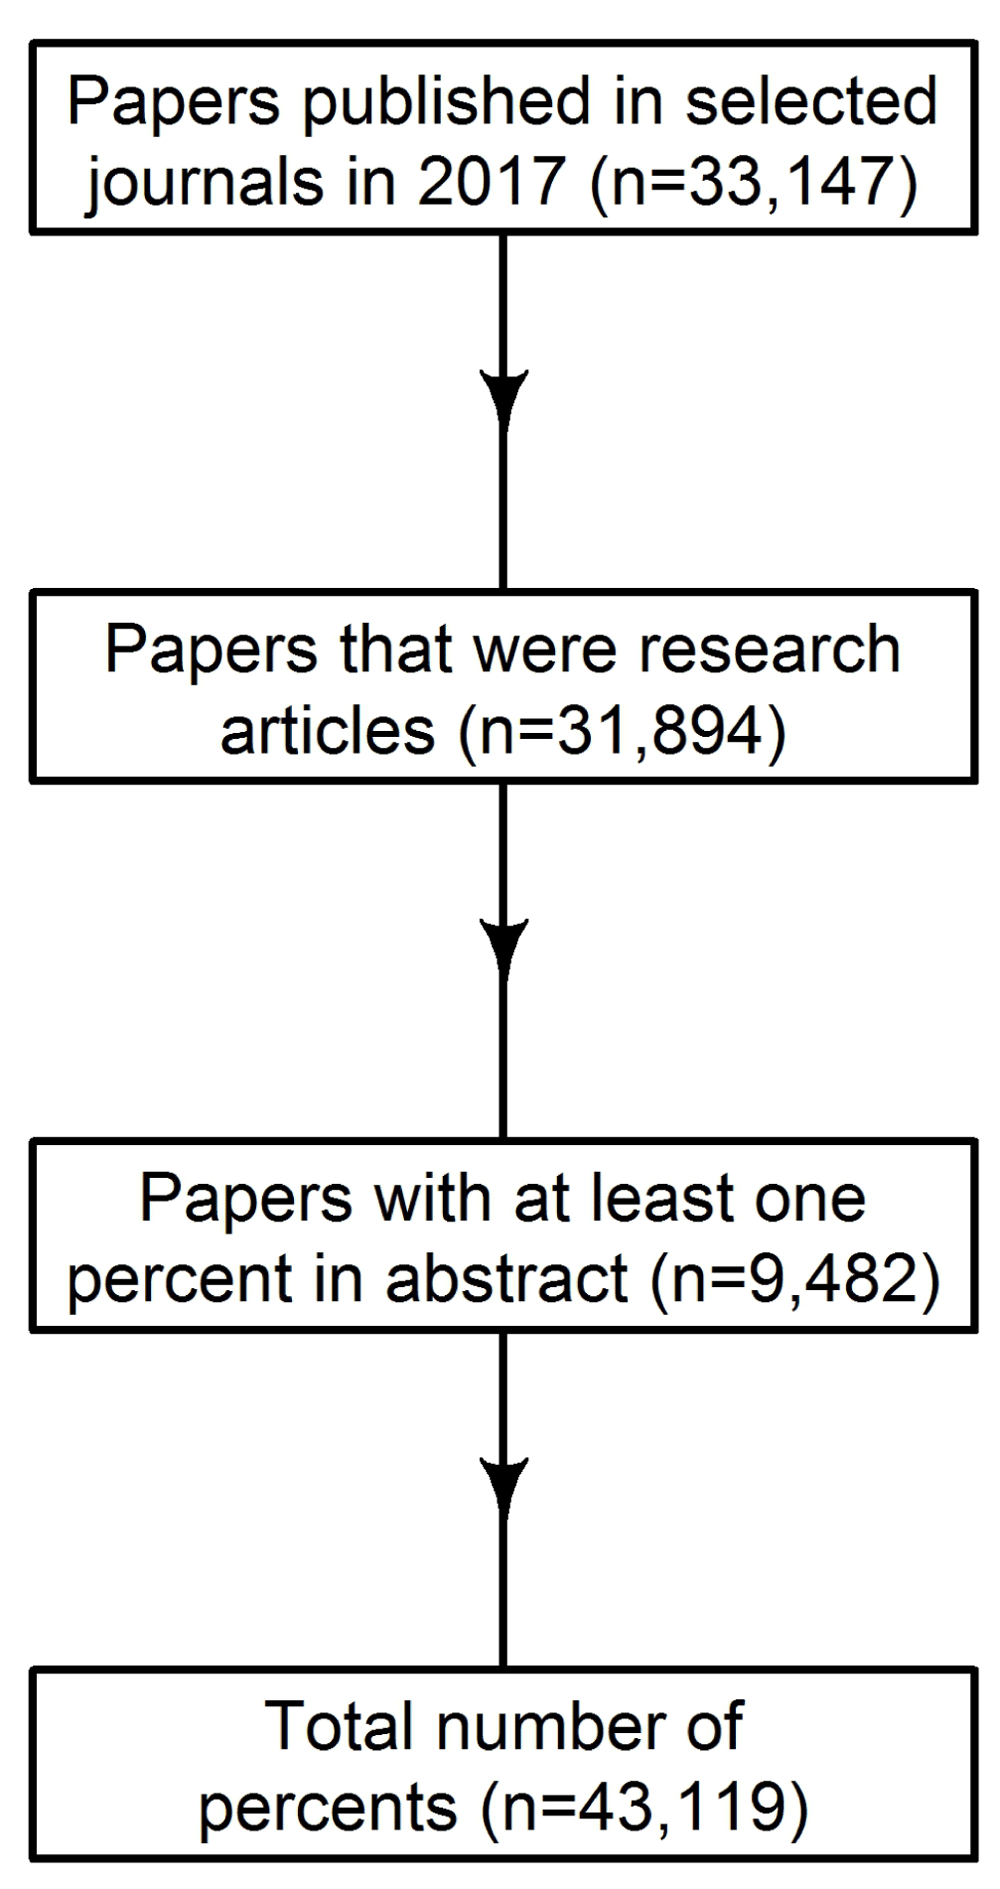
I searched for papers in the following journals: The BMJ, BMJ Open, Environmental Health Perspectives, F1000Research, JAMA, The Lancet, The Medical Journal of Australia, Nature, NEJM, PLOS ONE and PLOS Medicine. These journals were selected to give a range of journals that publish articles in health and medicine, including some high profile journals and some large open access journals. To look at recent papers, I restricted the search to 2017. To focus on research papers, I restricted the search to article types of: Journal Article, Clinical Trial, Meta-Analysis, Review, Randomized Controlled Trial and Multicenter Study. The search returned 33,147 papers across 23 journals (searching for “The Lancet” included all journals in the Lancet stable).
Despite the initial restriction on article type, the search results included non-research papers that had multiple types, e.g., a retraction of a clinical trial. Hence I excluded any papers that included an article type of: Biography, Conference, Comment, Corrected, Editorial, Erratum, Guideline, Historical, News, Lectures, Letter or Retraction.
A flow diagram outlining the selection of papers is shown in Figure 1.
I examined only percents because they are a widely used and important statistic, and are relatively easy to extract using text mining compared with other important statistics, such as the mean or rate ratio. I extracted all percentages from the text of the abstract by searching for all numbers suffixed with a “%”. The key steps for extracting the percents from the abstract were:
1. Simplify the text by removing the “±” symbol and other symbols such as non-separating spaces
2. Find all the percents
3. Exclude percents that refer to statistical intervals or statistical significance, e.g, “95% confidence interval”
4. Record the remaining percents as well as the number of decimal places and significant figures
The complete steps are detailed in the R code available here:https://github.com/agbarnett/decimal.places. Based on Cole’s guidelines7, I defined the ideal number of decimal places as:
0 for percents between 10 and 90, and percents over 100
1 for percents between 0.1 and 10, and percents between 90 and 100, and percents of exactly 0
2 for percents under 0.1
3 for percents under 0.01
4 for percents under 0.001 but greater than 0
Preferably I would have also considered a greater number of ideal decimal places when the aim was to compare a small difference in two percents. For example, 10.5% compared with 10.6% in the same sentence (PubMed ID 28949973) would both be considered as having one decimal place too many using the above guidelines, but the additional decimal place may be warranted if the small difference of 0.1% is clinically meaningful. However, accurately calculating a small difference of less than 0.1% requires all percents to be displayed using two or more decimal places. Ultimately I ignored this issue because it applied to so few abstracts.
I removed percents that referred to statistical intervals (e.g., “95% CI”) as these were labels not results. I searched for common interval percents of 80%, 90%, 95% and 99%. I combined these four percents with the words: “confidence interval”, “credible interval”, “Bayesian credible interval”, “uncertainty interval”, “prediction interval”, “posterior interval” and “range”. I included versions using capital and non-capital letters, and the standard acronyms including “CI” and “PI”. I also removed references to statistical significance percents using the common percents of 1%, 5% and 10% combined with the words: “significance”, “statistical significance” and “alpha level”.
I verified that the percents were correctly recorded for 50 randomly selected articles which contained 198 percents. There were no errors in the recorded percents, but there were 5 percents that were labels rather than results (e.g., “the prevalence of pretreatment NNRTI resistance was near WHO’s 10% threshold” PubMed ID 29198909), and there was an error with the ideal number of decimal places being 4 for a percent of 0% which led to a change in my ideal number of decimal places. There was also a “95% fixed kernel density estimator” which is a statistical interval and illustrates the difficulty of removing every type of statistical interval. I also checked the percentages for the abstract with the largest number of percents and the abstracts with the largest number of decimal places and significant figures. I also checked some abstracts that included percents of exactly 95% to check for any missing interval definitions. These checks led to additional definitions of intervals including the non-standard arrangements of “95% IC”, "CI 95%" (PubMed ID 28228447) and the typo "uncertainly interval" (PubMed ID 29171811).
I only extracted percents that were suffixed with the percent symbol. For example, the only extracted percent for the text “5–10%” or “5 to 10%” would be 10%. Any percents written in words were also not extracted. I also did not extract numbers immediately before the word “percent” or “per cent” as I assumed that these would be rare. I ignored the sign of the percent as I was primarily interested in presentation, so for example “–10%” was extracted as 10%. Similarly “<10%” was extracted as 10%. I only used the abstracts, rather than the main text, because: 1) abstracts are freely available on PubMed for a wide range of journals, whereas the full text can only be easily mined for open access journals such as PLOS ONE, 2) the abstract is a summary of the results and so percentages should be presented according to Cole’s guidelines, whereas percents may be presented with more decimal places in the results in order to give an accurate and reusable record of the data.
I calculated the difference between the observed number of decimal places and the ideal number as defined above. Because most differences were within ±1, I categorised the data into: too few, just right, and too many. I plotted the three categories by journal. I estimated confidence intervals for the percents in these three categories using a Bayesian Multinomial Dirichlet model13. The large sample size meant all confidence intervals had a width of 2% or less when using the complete sample, hence I did not present these intervals as they were not useful. The intervals are used to summarise the uncertainty for the results from journals. I did not adjust for the clustering of multiple percents within the same abstract.
In a sensitivity analysis I excluded percents that could be due to digit preferences, which were those with no decimal places that were a multiple of 10, as well as 75%. I also excluded percents between 90% and 100% because these may or may not have had a natural upper bound at 100%, and so it is difficult to automatically judge whether they should be presented with one or no decimal places. The data extraction and analyses were made using R (version 3.4.3)14. All the data and code are available here: https://github.com/agbarnett/decimal.places.
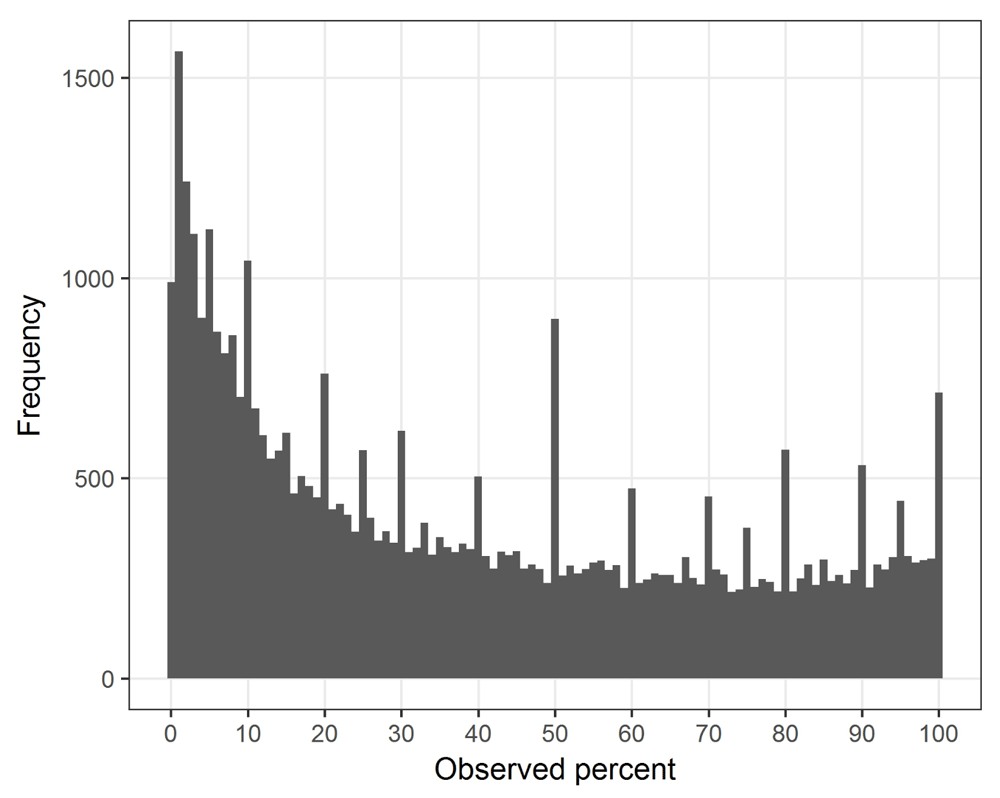
There were 43,119 percents from 9,482 abstracts. Over half the percents were from PLOS ONE (Supplementary Table 1). The median number of percents per abstract was 3 with an inter-quartile range from 2 to 6. A histogram of all percents between 0 and 100 is shown in Figure 2, this excludes the 195 percents (0.05%) that were greater than 100%. There are spikes in the histogram at multiples of 10% and at 1%, 5%, 75% and 95%, these are likely due to digit preferences where percents have been rounded to commonly used values.
The percent and number of percents meeting the guidelines are in Table 1. The recommended number of decimal places were used just over half the time. When the number of decimal places differed from the guidelines, it was more likely to be too many decimals (33%) rather than too few (12%). Only 21% of abstracts (1,947 out of 9,482) used the ideal number of decimal places for every percent. After excluding the digit preference percents, as many of these were not results, the recommended number of decimal places were used just 50% of the time and the percent of time that too many decimal places were used increased to 40%.
| Decimal places | All percents % (number) | Excluding digit preferences % (number) |
|---|---|---|
| Too few | 12 (4,981) | 10 (3,574) |
| Just right | 55 (23,872) | 50 (17,408) |
| Too many | 33 (14,266) | 40 (14,047) |
| Total | 100 (43,119) | 100 (35,029) |
An example where too many decimal places were used is, “True retentions of α-tocopherol in cooked foods were as follows: boiling (77.74-242.73%), baking (85.99-212.39%), stir-frying (83.12-957.08%), deep-frying (162.48-4214.53%)” (PubMed ID 28459863).
An example where too few decimal places were used is, “263 [3%] of 8313 vs 158 [2%] of 8261” (PubMed ID 29132879). As the numerators and denominators are given, we can recalculate the two percents using the recommended one decimal place, which are 3.2% and 1.9%, respectively, a difference of 1.3%. Without the reader working out these percents, the implied difference could be smaller than 0.1% because 3% could be as little as 2.5% (rounded up to 3%) and 2% could be as large as 2.4% (rounded down to 2%).
There were abstracts where the number of decimal places varied within the same sentence, for example, “pre-2010 vs post-2010 31.69% vs 64%” (PubMed ID 29138196).
Some percents which I judged as having too few decimal places, were potentially harshly judged because the sentence aimed to give general percents, for example the following sentence probably did not need the percents to one decimal place, “it is a common, chronic condition, affecting 2–3% of the population in Europe and the USA and requiring 1–3% of health-care expenditure” (PubMed ID 28460828). Some percents with too few decimal places according to Cole’s guidelines were presented using a consistent number of decimal places, for example, “we noted reductions in genotypes 6 and 11 (from 12% [95% CI 6-21%], to 3% [1-7%]” (PubMed ID 28460828); using the guidelines all the percents under 10% should have had one decimal place. Some percents with too few decimal places were correctly presented with no decimal places because the sample size was under 100, for example, “with a specimen obtained at 13 to 15 months, in 1 of 25 (4%)” (PubMed ID 26465681). I could not adjust for this correct presentation because I did not extract sample sizes.
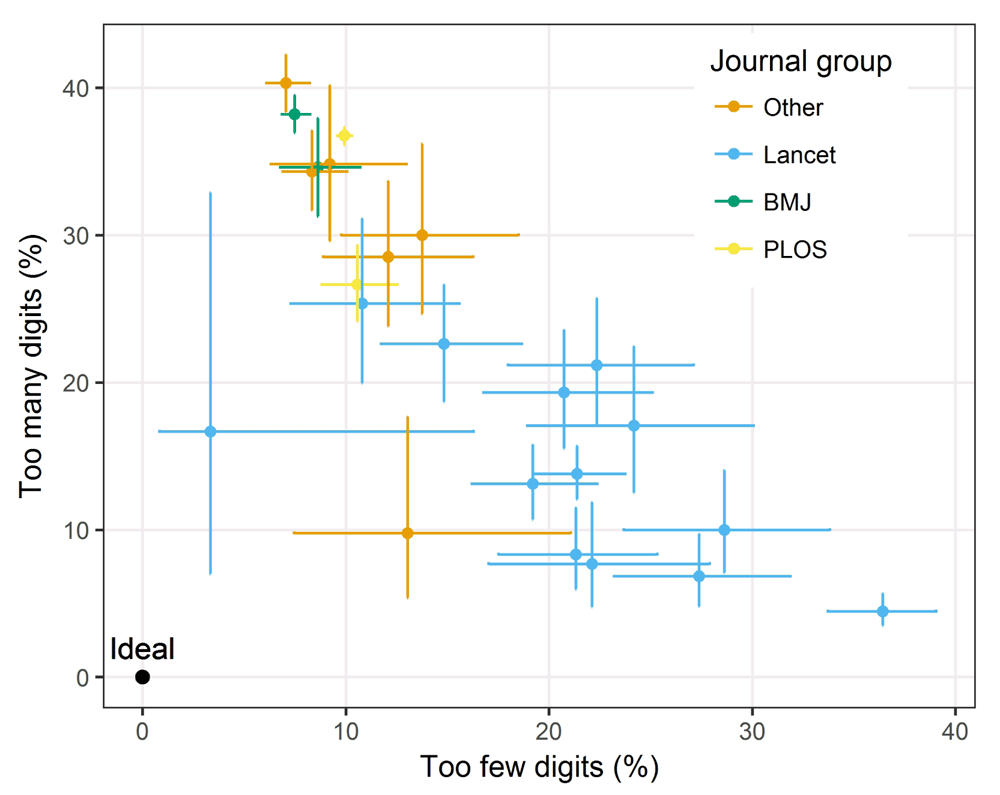
There were large differences between some journals in the number of decimal places used (Figure 3). There is some grouping of Lancet journals, which collectively leaned towards using too few decimal places. The two journals with means closest to the ideal were Lancet Planetary Health and Nature, although the sample size for Lancet Planetary Health is just 30 (Supplementary Table 1). There was a negative correlation between using too few and too many decimal places, so journals that used too many decimals places were less likely to use too few, and vice versa.
Only two journals had specific guidelines about decimal places in their online instructions to authors (Supplementary Table 2) and these both concerned not using decimal places where the sample size was under 100 (sensible advice which I did not consider here). Some instructions to authors did encourage the use of the EQUATOR guidelines, from where Cole’s guidelines for decimal places are available.
Numerical results are vitally important for quantitative research papers. Presenting numbers with too many decimal places can unnecessarily tax the reader and obscure important differences, whereas too much rounding makes it hard to compare results and can make differences appear too small. Overall, I found that only around half of all percents were presented according to the guidelines for decimal places, and the most common problem was using too many decimals. The overuse of decimals may stem from a belief that more numbers reflect greater accuracy. It is also likely that most researchers are not aware of the guidelines for presenting percents and other statistics.
The guidelines are not written in stone and good arguments can be made for not using them in some circumstances, for example, using no decimal places where all the percents are just above and below 10%, or where the differences are large enough to clearly show importance (e.g., a 1% versus 9% difference in mortality instead of 1.0% versus 9.0%). Hence the “around half” estimate for imperfect presentations found here likely overstates the problem. Additionally, there are far more serious mistakes that can be made with numbers, such as using the wrong data15 or mislabelling statistics.
I found large differences between journals in the number of decimal places used. These differences could be due to editorial policy and also differences in the training and experience of the journals’ author cohorts. Nature had one of the best results in terms of ideal presentation, and they published relatively few papers, which may mean they have more time to edit papers for clarity and presentation. PLOS ONE had the most amount of papers in the sample and did relatively badly compared with the guidelines, perhaps because there is no time for editors to fix issues with presenting numbers given the large volume of papers and other important tasks, for example, checking for plagiarism and undeclared competing interests.
The difference in standards between journals likely adds to the confusion for authors about how to present numbers. Greater consistency and better presentation might be improved by having an automated checking procedure similar to the statcheck program that checks for errors in statistical reporting16. This could be used to flag numbers that may need changing and could be part of an automated submission process for journals through online writing tools such as Overleaf17. Automating the process would reduce the burden on journal staff.
I only examined percents, but it is likely that other statistics, such as means and risk ratios, are also being imperfectly presented. In fact, using percents may underestimate the problem of spurious accuracy because percents are almost always between –100 and 100, whereas means can take on a far wider range depending on the unit of measurement and a wider range of numbers creates more opportunity for poor display. I only examined percents because these are the easiest numbers to automatically extract from text, thanks to the “%” suffix.
Many percents in abstracts did not adhere to the guidelines on using decimal places. A more considered use of decimal places would increase readability and potentially improve comprehension.
All the data and code are available here: https:// github.com/agbarnett/decimal.places.
Archived data and code as at time of publication: http://doi.org/10.5281/zenodo.121357418.
| Views | Downloads | |
|---|---|---|
| F1000Research | - | - |
|
PubMed Central
Data from PMC are received and updated monthly.
|
- | - |
Provide sufficient details of any financial or non-financial competing interests to enable users to assess whether your comments might lead a reasonable person to question your impartiality. Consider the following examples, but note that this is not an exhaustive list:
Sign up for content alerts and receive a weekly or monthly email with all newly published articles
Already registered? Sign in
The email address should be the one you originally registered with F1000.
You registered with F1000 via Google, so we cannot reset your password.
To sign in, please click here.
If you still need help with your Google account password, please click here.
You registered with F1000 via Facebook, so we cannot reset your password.
To sign in, please click here.
If you still need help with your Facebook account password, please click here.
If your email address is registered with us, we will email you instructions to reset your password.
If you think you should have received this email but it has not arrived, please check your spam filters and/or contact for further assistance.
Comments on this article Comments (0)