Keywords
animal, ecology methods, field, image analyses, image processing, vegetation patterns
This article is included in the RPackage gateway.
animal, ecology methods, field, image analyses, image processing, vegetation patterns
Typos were fixed, and Dr. Roy Francis was included in the Acknowledgments section.
See the authors' detailed response to the review by Francesco Chianucci
The facility to obtain high quality digital images creates the opportunity to measure natural variables using image analyses. Black and white pictures have frequently been used to understand patterns in field ecology, especially in plant biology studies1. However, the use of plant image analyses software is not easily extended to other biological fields for several reasons. Free programs are uncommon and paid software normally has threshold algorithms that were specifically designed for vegetation pictures2. Thus, a flexible method that would allow the application of such analyses to other subjects would be welcome. For example, despite the relatively well reported descriptions of bird nests and egg morphology in Del Hoyo and collaborators3 (but see Xiao, Hu4), there are no well-established approaches to estimate nest wall openness patterns.
Currently, R software5 allows users to migrate from data processing based on combinations of different software (with the possibility of having costly licensing, software-specific files, incompatibility between operating systems and lack of updates) to a free, single cross-platform software. Here, we introduce bwimage, a package for R that can be used to analyze patterns in black and white images from natural structures. We provide data examples for applications and descriptions of routines for processing of black and white images.
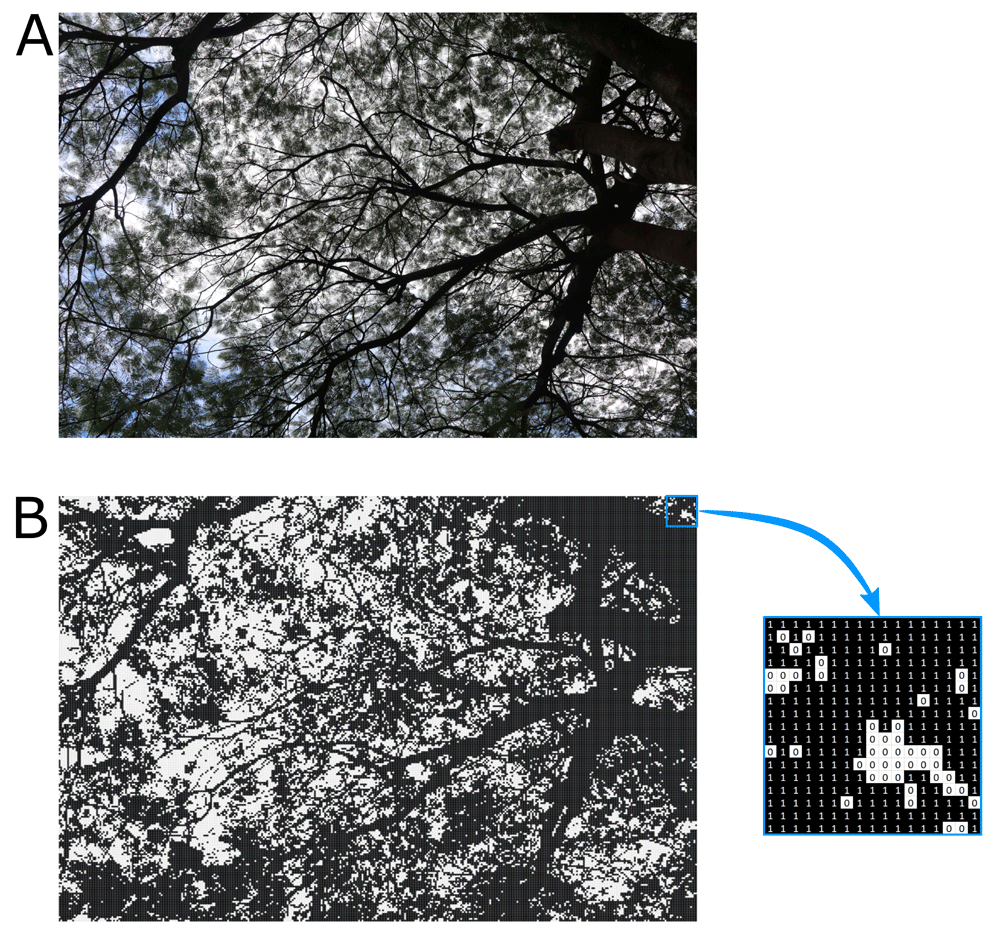
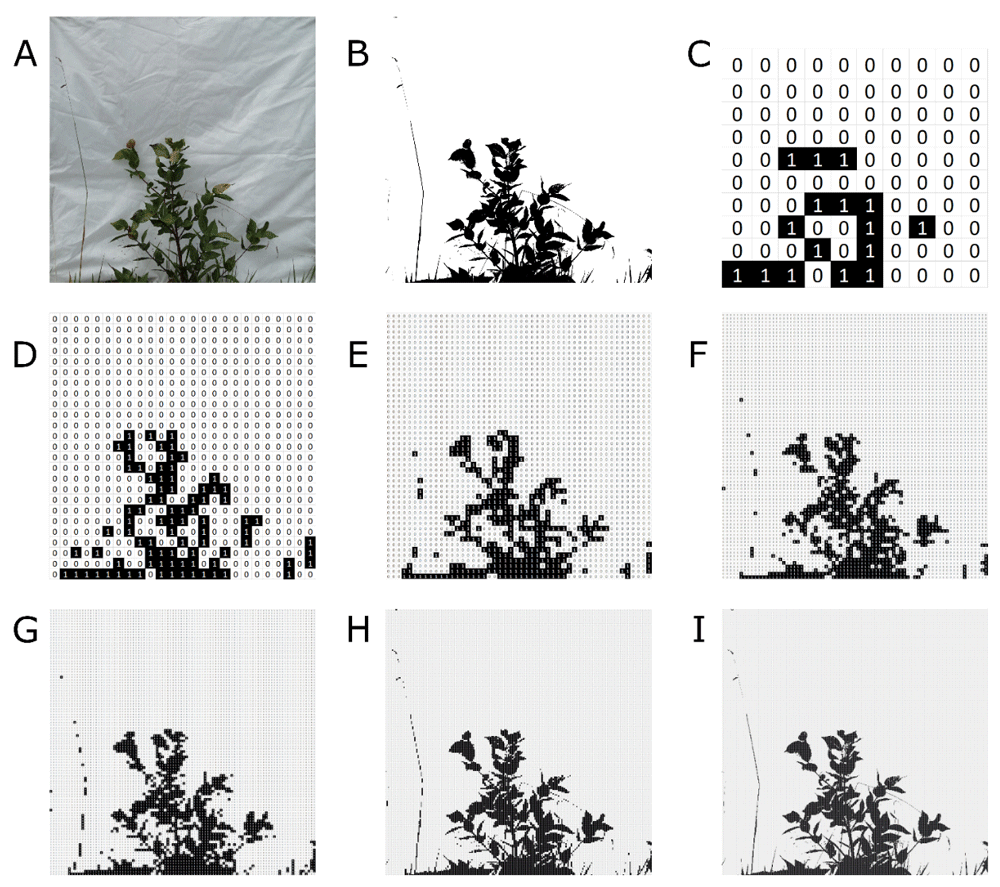
Bwimage´s analysis of images is based on the transformation from a picture (“jpeg” and “png” files are allowed) to a binary matrix (Figure 1). For each pixel, the intensity of red, green, blue, or the average of these three channels (argument channel) is compared to a threshold (argument threshold_value). If the average intensity is less than the threshold (default is 50%) the pixel will be set as black, otherwise it will be white. Beyond RGB intensity in PNG images, the alpha channel is used to set transparent pixels, i.e. alpha channel values above the threshold (argument threshold_value; default is 50%) will set the pixel as transparent. In the data matrix, the value one represents black pixels, zero represents white pixels and NA represents transparent pixels. For high resolution files, i.e. numbers of pixels in width and height, we suggest reducing the resolution to create a smaller matrix, as this strongly reduces GPU usage and time necessary to run analyses. However, by reducing resolution, the accuracy of data description will also be lowered. Figure 2 compares different resamplings from a figure of 2500×2500 pixels. If the user is not acquainted with scale and threshold processing and/or images were captured under different light conditions, we recommend the scale and application of threshold algorithms in a native image editor software, such as GIMP6, and subsequent usage of the resulting images with the bwimage package.

A) An image of a natural structure is obtained with digital photography; here we used an image from a canopy. B) The image is converted into a binary matrix, functions threshold_color (to a single image) or threshold_image_list (for two or more images). In the data matrix the value one represents black pixels, zero represents white pixels and NA represents transparent pixels.

A) Original image. B) Black and white conversion of the original image by GIMP software, i.e. all pixels converted to either black or white in image. C–I) conversion of the original image to binary matrices of 10×10, 50×50, 75×75, 100×100, 250×250, and 500×500, respectively.
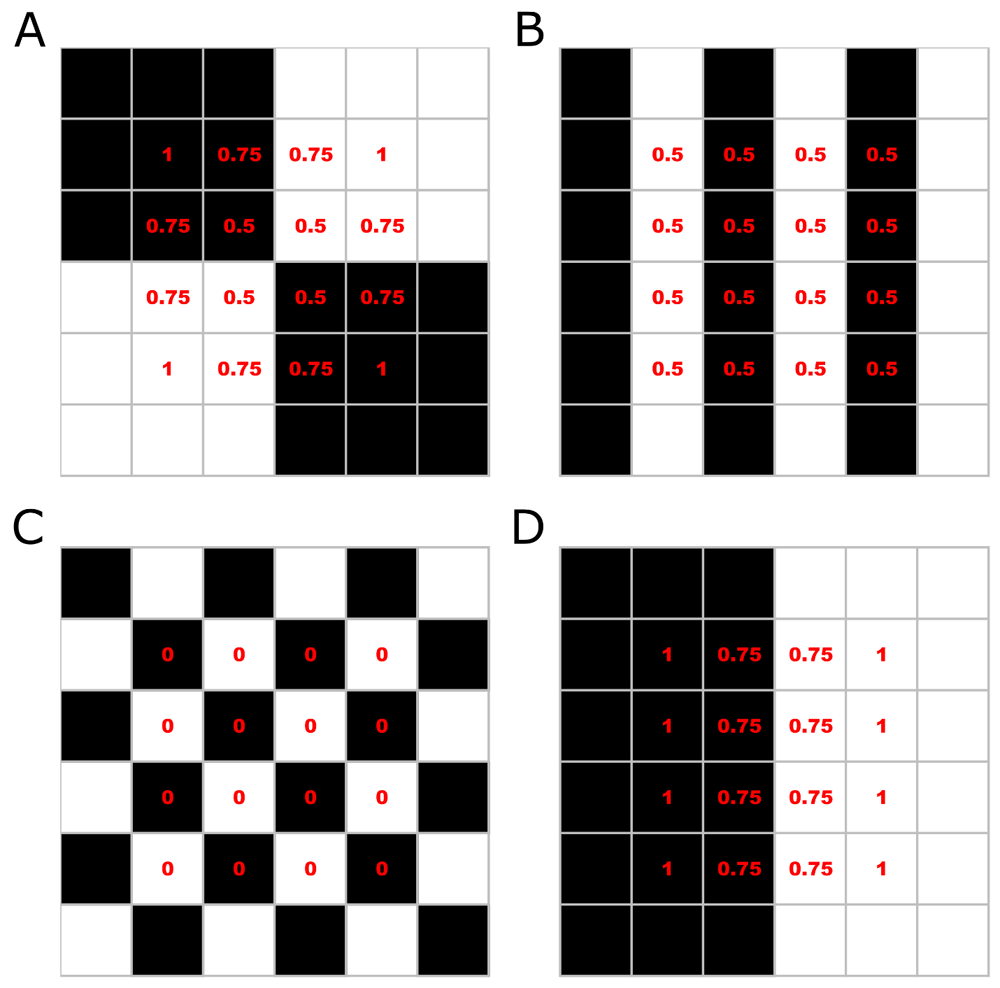
Several metrics can be performed with the functions presented in Table 1. We implemented functions to calculate parameters designed originally, but not exclusively, for vegetation structures (described by Zehm et al. 2003) and propose a new parameter: the aggregation index. The aggregation index is a standardized estimation of the average proportion of same-color pixels around each image pixel. First, the proportion of same-color neighboring pixels (SCNP) is calculated (marginal lines and columns are excluded). Next, the SCNP for all pixels are averaged; then, given the proportion of black and white pixels, number of pixels in height and width, and location of transparent pixels (when present), the maximum and minimum possible aggregation indexes are calculated. Finally, the observed aggregation is standardized to a scale where the minimum possible value is set at zero and the maximum value is set at one (Figure 3).

Images represent photos of 6×6 pixel, with 50% black and 50% white pixels. For the aggregation index calculation, first, the proportion of same-color neighboring pixels (SCNP) is calculated (marginal lines and columns are excluded). Then, SCNP are averaged. In these examples, the average SCNP is 0.75 (A), 0.5 (B), 0 (C) and 0.875 (D). Next, the maximum and minimum possible aggregation indexes are calculated. In images with 50% black and white pixels, the minimum aggregation will be pixels distributed in chessboard style (C), and the highest aggregation will be the aggregation of all same color pixels on each image side (D). Thus, by scaling the aggregation by the minimum and maximum possible aggregation, the final aggregation index is: 0.857 (A), 0.571 (B), 0 (C) and 1 (D).
Bwimage is written in the R programming language5, and can be run on Windows, Mac OS X, and Linux systems. The package is available at the CRAN repository, and the development releases are available at Github (see Software availability)7. The bwimage CRAN page documents package dependencies. Input images must be in one of the following formats PNG, JPG, or JPEG.
Canopy openness is one of the most essential ecological parameters for a field ecologist. In the bwimage package, canopy openness can be calculated based on a single picture. To illustrate, we demonstrate below how to analyze a canopy image with the bwimage package. The photo was taken with a digital camera placed in the ground, perpendicular to the ground. Canopy closure can be calculated by estimating the total amount of vegetation in the canopy. Canopy openness is equal to one minus the canopy closure. For this example, we used the original image from Figure 1. The original image file is provided as Underlying data8.
canopy_matrix<-
threshold_color("canopy.JPG",compress_method="proportional",compress_rate=0.1)

1-denseness_total(canopy_matrix)
[1] 0.1297333
Several metrics to describe vertical vegetation complexity can be performed by the bwimage package (see Table 1). Here we provide examples based on an image (Figure 2A) from a vegetation plot of 30×100cm1. The original image file is provided as Underlying data9. On the 100cm side of this plot we placed a panel of 100×100 cm, covered with white cloth, and perpendicular to the ground. A plastic canvas of 50x100cm was used to cover the vegetation along a narrow strip in front of a camera positioned on a tripod at a height of 55 cm. A photograph of the portion of standing vegetation against the white cloth was taken.
vegetation_matrix<-threshold_color(bush)

denseness_total(vegetation_matrix,height_size = 100, width_size = 100)
[1] 0.115248

topline(vegetation_matrix)
topline
  785.6

heigh_propotion_test(vegetation_matrix,proportion=0.75,height_size=100)
Height below which 0.75 of the vegetation denseness is located
                                                                                31.2

 aggregation_index(vegetation_matrix)
       adjusted_aggregation non_adjusted_aggregation
                    0.8512586                0.9634373
Variation in eggs and nest morphology provide relevant information concerning bird life history that has frequently been used to answer ecological10–12 and evolutionary questions13–15. Here we analyze examples that address the quantification nest wall openness and the aggregation of nest wall holes, using a nest of the blue-black grasssquit (Volatinia jacarina) deposited in the museum collection Coleção Ornitológica Marcelo Bagno, at Universidade de Brasília (register number COMB-N682). Figure 4 describes how to produce a high-quality image to describe patterns in bird nest wall openness. The original image file used is provided as Underlying data16.
NestWall_matrix<-threshold_color("NestWall.png",
filetype="png",compress_method="width_fixed",target_width=300)

denseness_total(NestWall_matrix)
[1] 0.7612406

aggregation_index(NestWall_matrix)
adjusted_aggregation non_adjusted_aggregation
0.9007821                0.9502800

The following example used a blue-black grasssquit (Volatinia jacarina) nest deposited in the museum collection Coleção Ornitológica Marcelo Bagno, at Universidade de Brasília (catalog number COMB-N682). A) A photo of the nest was taken with a white styrofoam ball (50mm in diameter) placed inside the nest chamber. B) In GIMP software (version 2.10.10), we added alpha channel (to allow transparent pixels), and used the Ellipse select tool to select contrast of the white ball and nest wall, and then erased all background elements. C) To ensure that shadows from nest wall did not influence white ball detection, we also performed the threshold processing in GIMP. To preserve the transparent pixels from background elements, the final image must be saved as a PNG file.
The bwimage package provides accessible and simple methods for ecologists and field researchers to describe patterns from black and white digital images. It is a flexible method that allows the application of image analyses to an exceptionally broad range of research subjects. Bwimage´s analysis is based on a simple computational routine based on the transformation of a picture (“jpeg” or “png” files) into a binary matrix, followed by the analysis itself. Several metrics can be calculated by the bwimage package. We implemented functions previously described in the literature, and additionally, we proposed a new parameter: the aggregation index, which generates a standardized estimate of the average proportion of same-color pixels around each image pixel. The application of this methods is exceptionally broad.
Figshare: Canopy of Royal poinciana. https://doi.org/10.6084/m9.figshare.8429117.v28
Figshare: Image from a vegetation plot of 30x100cm. https://doi.org/10.6084/m9.figshare.8429882.v29
Figshare: Blue-black grassquit (Volatinia jacarina) nest. https://doi.org/10.6084/m9.figshare.8432018.v116
Data are available under the terms of the Creative Commons Zero "No rights reserved" data waiver (CC0 1.0 Public domain dedication).
- Software available from: https://CRAN.R-project.org/package=bwimage
- Source code available from: https://github.com/biagolini/bwimage
- Archived source code at time of publication: https://doi.org/10.5281/zenodo.32662997
- License: GPL-3
We are grateful to Universidade de Brasília for logistic support and Marcelo Antônio de Assis Silva for technical advice on how to obtain a high-quality image of the bird nest used in the manuscript. We also acknowledge Dr. Francesco Chianucci and Dr. Roy Francis for comments in a previous version of the manuscript.
| Views | Downloads | |
|---|---|---|
| F1000Research | - | - |
|
PubMed Central
Data from PMC are received and updated monthly.
|
- | - |
Is the rationale for developing the new software tool clearly explained?
Yes
Is the description of the software tool technically sound?
Yes
Are sufficient details of the code, methods and analysis (if applicable) provided to allow replication of the software development and its use by others?
Yes
Is sufficient information provided to allow interpretation of the expected output datasets and any results generated using the tool?
Partly
Are the conclusions about the tool and its performance adequately supported by the findings presented in the article?
Yes
References
1. Bayr U, Puschmann O: Automatic detection of woody vegetation in repeat landscape photographs using a convolutional neural network. Ecological Informatics. 2019; 50: 220-233 Publisher Full TextCompeting Interests: No competing interests were disclosed.
Reviewer Expertise: Molecular Biology, Bioinformatics
Competing Interests: No competing interests were disclosed.
Reviewer Expertise: Forestry
Is the rationale for developing the new software tool clearly explained?
Yes
Is the description of the software tool technically sound?
Yes
Are sufficient details of the code, methods and analysis (if applicable) provided to allow replication of the software development and its use by others?
Partly
Is sufficient information provided to allow interpretation of the expected output datasets and any results generated using the tool?
Partly
Are the conclusions about the tool and its performance adequately supported by the findings presented in the article?
Partly
References
1. Alivernini A, Fares S, Ferrara C, Chianucci F: An objective image analysis method for estimation of canopy attributes from digital cover photography. Trees. 2018; 32 (3): 713-723 Publisher Full TextCompeting Interests: No competing interests were disclosed.
Reviewer Expertise: Forestry
Alongside their report, reviewers assign a status to the article:
| Invited Reviewers | ||
|---|---|---|
| 1 | 2 | |
|
Version 3 (revision) 14 Apr 20 |
||
|
Version 2 (revision) 29 Oct 19 |
read | read |
|
Version 1 23 Jul 19 |
read | |
Provide sufficient details of any financial or non-financial competing interests to enable users to assess whether your comments might lead a reasonable person to question your impartiality. Consider the following examples, but note that this is not an exhaustive list:
Sign up for content alerts and receive a weekly or monthly email with all newly published articles
Already registered? Sign in
The email address should be the one you originally registered with F1000.
You registered with F1000 via Google, so we cannot reset your password.
To sign in, please click here.
If you still need help with your Google account password, please click here.
You registered with F1000 via Facebook, so we cannot reset your password.
To sign in, please click here.
If you still need help with your Facebook account password, please click here.
If your email address is registered with us, we will email you instructions to reset your password.
If you think you should have received this email but it has not arrived, please check your spam filters and/or contact for further assistance.
Comments on this article Comments (0)