Keywords
Microbiome, Differential Abundance, Longitudinal, R, Bioconductor
This article is included in the Bioconductor gateway.
Microbiome, Differential Abundance, Longitudinal, R, Bioconductor
We have made revisions to the following manuscript and Bioconductor package based on reviewer feedback. Major changes to the manuscript include an additional section “Approximating Observed Microbiome Data” that highlights using the simulator to generate data from a historical microbiome clinical trial along with reproducible code and figures, additional rationale for using the simulator tools in study design, and updated code within the manuscript. Updates to the package software require users to specify an interval of time for simulating longitudinal data with time points sampled uniformly or randomly, additional functions to match observed data, and the ability to convert simulated data into commonly used objects in the metagenomeSeq and phyloseq packages. Individual responses to reviewer comments are available in the Reviewer Report tab.
See the authors' detailed response to the review by Kris Sankaran
See the authors' detailed response to the review by Leo Lahti
Analysis of the microbiome aims to characterize the composition and functional potential of microbes in a particular ecosystem. Recent studies have shown the gut microbiome plays an important role in various diseases, from the efficacy of cancer immunotherapy to the pathogenesis of inflammatory bowel disease (IBD)1–4. While many studies profile static community “snapshots”, microbial communities do not exist within an equilibrium5. To better understand bacterial population dynamics, many studies are expanding to longitudinal sampling and foregoing cross-sectional or single time-point explorations. With a decrease in sequencing costs, more longitudinal data will be generated for varying communities of interest. While data generation will present fewer difficulties, there remain several statistical challenges involved in analyzing these datasets.
The common approach in the marker-gene survey literature is to perform pairwise differential abundance tests between specific time points and visually confirm, sometimes using smoothing methods like splines, how differences are manifested across time6. These methods require that analysts provide one or more specific time points to test, and the statistical inferences derived from these procedures are specific to these pairwise tests. Other standard methods for longitudinal analysis test for global differences across time, sometimes using non-linear methods including splines to capture dynamic profiles across time7. Incorporating confounding sources of variability, both biological and technical is essential in high-throughput studies8 and require statistical methods capable of estimating both smooth functions and sample-specific characteristics.
Simulating marker-gene amplicon sequencing data presents a variety of challenges related to biological and technical limitations when collecting data. We present a framework for simulating data that can be used across multiple methods for estimating longitudinal differential abundance. This simulation framework allows for appropriate comparison between methods while taking into account some of the unique challenges for the marker-gene amplicon sequencing data, including the following:
1. Non-negative restriction
2. Presence of Missing Data/High Number of Zero Reads
3. Low Number of Repeated Measurements
4. Asynchronous Repeated Measures
5. Small Number of Subjects
The first two challenges described above are related to the data generating process itself while the following three represent logistical challenges often faced when collecting the data. In microbiomeDASim9, we attempt to address these data generating challenges through specific simulation mechanisms described in the Microbiome adaptions section. Similarly, logistical challenges are addressed by allowing users to specify these values flexibly and investigate the corresponding effects, tailoring the simulation to an appropriate setting.
This package allows investigators to simulate longitudinal differentially abundant microbiome features with a variety of known functional forms along with flexible parameters to control design aspects such as signal to noise ratio, correlation structure, and effect size. This feature simulation paradigm can be used in study design evaluation by either matching previously observed trends from small scale studies or evaluating the power to detect differential abundance with a specified study duration, sample size, effect size, effect shape and sample collection schedule. We highlight the ability of the package to use results from a historical longitudinal study on the human gut microbiome in gnotobiotic mice10 to simulate differential abundance for a hypothetical large scale expansion of this study and then demonstrate using the simulation package to evaluate the performance of one particular method of differential abundance estimation across a range of parameter values, metaSplines11.
Sequencing data are often non-normal. However, transformations, such as log(·) or arcsinh(·), are often applied to raw marker-gene amplicon sequencing data so that the subsequent data is approximately normally distributed. As such, we generate simulated data from a multivariate normal distribution. Using a multivariate normal is a natural choice in this setting as longitudinal correlation structure can be easily incorporated. The following methods focus on cases where the desired microbiome features following appropriate transformation are approximately normally distributed.
Assume that we have data generated from the following distribution,
wherewith Yij representing the ith individual at the jth time point and each individual has qi repeated measurements with i ∈ {1, … , n} and j ∈ {1, … , qi}. We define the total number of observations as While this model holds for different choices of qi, throughout this article we will assume, without loss of generality, that the number of repeated measurements is constant, i.e., qi = q ∀ i ∈ {1, … , n}. This means that the total number of observations simplifies to the expression N = qn. Similarly, we split the total patients (n) into two groups, control (n0) and treatment (n1), with the first n0 patients representing the control patients and the remaining n–n0 representing the treatment patients. Subsequently we define the total number of observations in each group as N0 = n0 · q and N1 = n1 · q respectively. Y represents a single taxa/feature to be simulated across the N samples. When simulating multiple features as shown later in the gen_norm_microbiome, these features are assumed to be independent.
Partitioning our observations into control and treatment groups in this way allows us to define the mean vector separately for each group as µ = (µ0,µ1) where µ0 is an N0 × 1 vector and µ1 is an N1 × 1 vector. To generate differential abundance the mean for the control group is held constant µ0 1n0 × 1, but allow the mean vector for the treatment group to vary as a function of time µ1ij(t) = µ0 + f(tj) for i = 1, … , n1 and j = 1, … , q. The form of f(tj) will dictate the functional form of the differential abundance. Note that if f(t1) = 0, then both groups have equal mean at baseline.
We allow f(tj) to be specified using polynomial basis as
for a p dimensional polynomial. We restrict the allowed polynomials to be either linear, p=1, quadratic, p = 2, or cubic, p = 3. For instance, to define a quadratic polynomial one would specify β = (β0, β1, β2)T in the following equation,
Again, it is important to note that if β = 0, that the treatment group is assumed to have no differentially abundant timepoints. Typically to simulate no differential abundance, a linear trend is chosen with β0 = β1 = 0.
While polynomial functions are often natural choices for longitudinal trends, interest also lies in exploring other non-smooth, i.e., non-differentiable, types of trends. One such form we refer to as oscillating functional forms. These trends include types that transition from linearly increasing to linear decreasing at a point, or vice versa from linearly decreasing to linear increasing. One of the most well known trends of this type is the absolute value function. To allow for flexible choices in oscillating type trends, we allow for these non differentiable linearly connected trends to repeat forming what we call M and W trends. From a biological perspective we could think of these trends as representing spikes in a particular feature that may occur immediately after a treatment dose is given, but then decays rapidly to baseline levels followed by a similar spike and decay upon repeated dosing. These functional trends are operationalized as
where IPk for k = 1, 2, 3 denotes an inflection point where the linear trend changes from increasing to decreasing or vice versa. Note that for these types of trends that the sign of β1 determines whether the trend is initially increasing, i.e. M, (β1 > 0) or initially decreasing, i.e. W, (β1 < 0). By construction, we force the trend line to be exactly zero at IP2 and by doing so the trend is specified completely as β = (β0, β1)T and IP = (IP1, IP2, IP3)T. An implicit restriction on the functional trend is that IP3 ≠ tq. However, we can construct absolute value and inverted absolute value type trends by defining IP1 ∈ (t1, tq) and IP2, IP3 > tq. Again, the key difference for these set of trends is that the inflection points create non-smooth trends.
An additional extension to linear functional trends is the family of Hockey Stick functional forms. There are two available families of hockey stick functional forms, which are referred to as L_up and L_down within the package. Both of these trends are designed to create two mutually exclusive regions over the time frame specified. These two regions are defined as ℜ1 = (t1, IP) and ℜ2 = (IP, tq) where one of the regions ℜ1 or ℜ2 has linear differential abundance while the other has no differential abundance and IP denotes the inflection point. In the case of the L_up trend, ℜ1 is defined as the non-differentially abundant region and ℜ2 is a linearly increasing region. We can define the functional form as
Note that with this specification that we do not specify the intercept β0 and instead only need to specify the slope term β1 and the appropriate point of change. We restrict the slope term to be positive, i.e., β1 ∈ (0, ∞) to create the "up" trend.
Conversely, the L_down trend assumes that ℜ1 is a differentially abundant region that begins with the treatment group higher than the control group and then linearly decreases to the region ℜ2 where there is no differential abundance. We define this functional form as
Note that in this case we do not specify the point of change directly, but rather it is implicitly implied by the choice of β0 and β1, i.e. IP = –β0/β1. To ensure that the trend in ℜ1 is properly specified, we place additional restrictions on the parameters so that β0 ∈ (0, ∞) and β1 ∈ (–∞, 0) to ensure the trend is decreasing and check that the choice of β0 and β1 are appropriately defined so that IP ∈ (t1, tq).
Example trends are shown in Figure 1 generated using the mean_trend function.

As discussed in the Introduction, the multivariate normal is a natural choice for longitudinal simulation due to the ease with which dependency of repeated measures is specified. To encode this longitudinal dependency observations within an individual are assumed to be correlated, i.e. Cor(Yij, Yij') ≠ 0 ∀j ≠ j' and i ∈ {1, … , n}, but observations between individuals are assumed independent, i.e. Cor(Yij, Yi'j) = 0 ∀i ≠ i' and j ∈ {1, … , qi}. To accomplish this we define the block diagonal matrix Σ as Σ = bdiag(Σ1, … , Σn), where each Σi is a q × q covariance matrix for individual i and bdiag(·) indicates that the matrix is block diagonal with all off diagonal elements not in Σi equal to zero. For each individuals covariance matrix, we assume a global standard deviation parameter and correlation component ρ, i.e. Σi = σ2Ω(ρ).
For instance, if we want to specify an autoregressive correlation structure for individual i the covariance matrix is defined as
In this case we are using the first order autoregressive definition and therefore will refer to this as AR(1).
Alternatively, for the compound correlation structure for an individual i' we define the covariance matrix as
Finally, we allow the user to specify an independent correlation structure for an individual i'', which assumes that repeated observations are in fact uncorrelated and is defined as
Each of these correlation structures are referred as AR(1), compound, and independent respectively.
As discussed in the Introduction, simulating microbiome data presents a variety of unique challenges. In particular there are two data generating restrictions, 1. non-negative restriction and 2. presence of missing data/high number of zero reads, that must be addressed when simulating this data. In this section we will outline some of the specific adaptions of the simulation framework designed to address these issues.
1. Non-negative restriction. One of the most relevant challenges faced with microbiome data, is the restriction of the domain to non-negative values. To assure that the simulated normalized counts are non-negative, one solution is to simply replace the multivariate normal distribution with a multivariate truncated normal distribution. The new data generating distribution is now
where TN indicates the multivariate truncated normal distribution and a is the left-truncation value. To impose zero truncation it is assumed that a = 0. Values from the multivariate truncated normal are drawn using the package tmvtnorm12. Note that the default method for drawing observations from this distribution is rejection sampling which proceeds by first drawing from a multivariate normal and then for all values that fall below a to reject the observed sample and re-sample. This procedure works well when the majority of the distribution falls above the truncation point, but can be computational intensive when the probability of acceptance, pacpt = P(Y > a1N), is low. In our simulation design if the value of µ is sufficiently close to a then rejection sampling is not feasible. In the case there the pacpt ≤ 0.1, non-negative restriction is imposed by censoring negative values and using point imputation with the truncation value a as shown below
To remove the non-negative restriction there is an option in the function mvrnorm_sim which can be used to turn-off the domain restriction, but by default the zero truncation is imposed. Note that an alternative option to using the multivariate truncated normal is to use the Johnson translation system which can allow samples to be drawn from a multivariate log normal distribution via an appropriate translation function13. The current implementation uses only the multivariate truncated normal distribution for drawing samples via the zero_trunc option within the mvrnorm_sim() and gen_norm_microbiome() functions.
2. Presence of missing data/high number of zero reads. The second major data generating challenge when simulating microbiome data is the presence of missing data along with a high percentage of features with zero counts. Based on technical limitations when amplifying and sequencing microbiome data, certain features may be present but remain undetected. To approximate this potential for missing features that are truly present, options within mvrnorm_sim allow the user to specify: 1) the percent of individuals to generate missing values from (missing_pct), 2) the number of measurements per individual to assign as missing (missing_per_subject), and 3) the value to impute for missing observations (miss_val). Sample IDs are randomly chosen without replacement across all n units and for each selected ID measurements are randomly selected without replacement from {t2 , … , tq} until the specified number of measurements per individual is achieved. For each missing measurement selected the observed value is replaced with the user specified missing value. Typically the missing value is specified as 0 or as NA with the first case representing a situation where the feature was not included due to technical limitations and the second representing an individual whose data was not collected for a particular time point. The initial value t1 cannot be assigned as missing since it is assumed that all individuals have baseline values collected.
The current version of the R Bioconductor software package microbiomeDASim9 can be installed in R with the following executable code:
if(!requireNamespace("BiocManager", quietly = TRUE)){
   install.packages("BiocManager")
}
BiocManager::install("microbiomeDASim")
Alternatively, a development version is available from GitHub and can be accessed at the following repository williazo/microbiomeDASim. The developmental version may contain additional features that are being developed before they are officially introduced into the Biocondutor version. The developmental version can be installed using the following code:
if(!requireNamespace("devtools", quietly = TRUE)){
   install.packages("devtools")
}
devtools::install_github("williazo/microbiomeDASim")
For a guided introduction into using the functions see either the package vignette for a static example of how to set up and interact with various options for simulating data or for a dynamic guide see mvrnorm_demo.ipynb, a Jupyter notebook on the GitHub page under the inst/script directory. This notebook can be loaded using Google Collab allowing the code to be run without installing Jupyter locally.
microbiomeDASim9 is compatible with major operating systems including Mac OS, Windows and Linux. Package dependencies and system requirements are outlined in the documentation available at GitHub.
The primary mechanism for simulating data in the microbiomeDASim package9 is the function mvrnorm_sim. Through this function, the number of subjects in each group is specified along with the necessary parameters, i.e β, σ2, ρ, and IP, to generate µ and Σ. Below is an example of generating differential abundance using a quadratic trend. This type of example could be part of an initial attempt to understand the effects of proposed sample sizes per group, hypothetical functional forms for differential abundance, and sensitivity to signal to noise ratios. In this case there may be a sparsity of empirical evidence and many possible simulation designs can be tested, or on the other end of the spectrum the ecological process could be well understood and the parameter values are well known with emphasis focused on constraints such as collection timepoints and sample size.
> library(microbiomeDASim)
> sim_dt <- mvrnorm_sim(n_control=20, n_treat=20, control_mean=2, sigma=1,
+                       num_timepoints=7, t_interval=c(0, 6), rho=0.7,
+                       corr_str="compound", func_form="quadratic",
+                       beta=c(0, 3, -0.5), missing_pct=0, missing_per_subject=0,
+                       asynch_time=FALSE, dis_plot=TRUE)
> typeof(sim_dt)
[1] "list"
> names(sim_dt)
[1] "df"        "Y"         "Mu"        "Sigma"     "N"         "miss_data" "Y_obs"
> head(sim_dt$df)
          Y ID time   group     Y_obs
1 0.2132845  1    0 Control 0.2132845
2 0.7784994  1    1 Control 0.7784994
3 1.6464264  1    2 Control 1.6464264
4 1.6283489  1    3 Control 1.6283489
5 0.8769442  1    4 Control 0.8769442
6 0.7625660  1    5 Control 0.7625660
> head(sim_dt$miss_data)
[1] miss_id
<0 rows> (or 0-length row.names)
The output of the simulation function is a list with 7 total objects. The main object of interest is df, which is a data.frame that contains the complete outcome, Y, IDs for each subject i = 1, … , n, the corresponding time for each observation tj, a group variable indicator, and the outcome with missing data, Y_obs. The time interval of interest must be specified as a parameter in t_interval, and by default timepoints are drawn at equidistant points along this interval. Both the complete and missing data vectors are also returned as independent objects, Y and Y_obs, respectively, along with the complete mean, µN × 1 = Mu, and covariance matrix, Σ=Sigma. The function also includes a data.frame miss_data which lists any IDs and time points for which missing data was induced. Finally, the function also returns the total number of observations, N=Σi qi. The option dis_plot is used to automatically generate a time-series plot tracking each individuals trajectory along with group mean trajectories. The corresponding plot for this data is shown in Figure 2a.
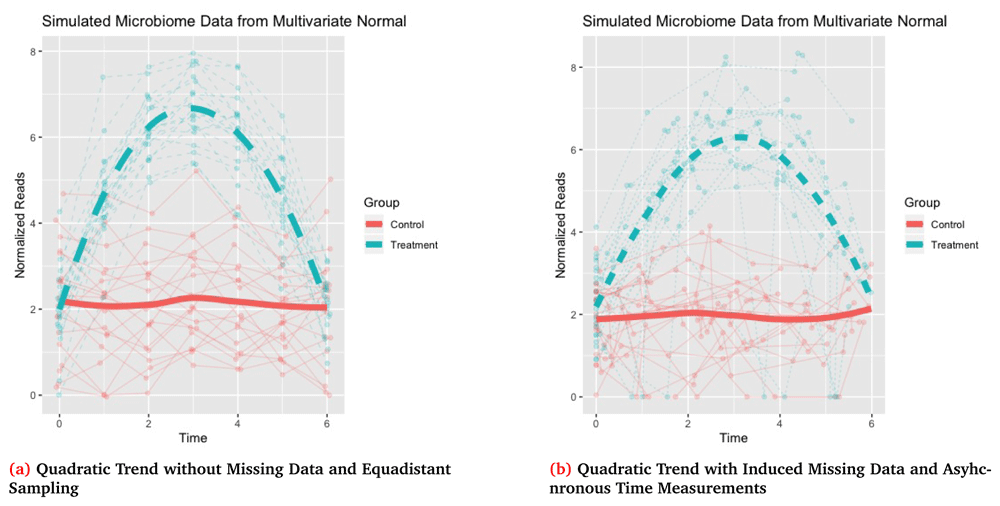
Missing data in Figure 2b is generated with 20% of subjects randomly selected to have missing values and for each of these subjects to have 2 non-baseline times randomly selected to be missing with the missing observations imputed as 0.
One important thing to note about the example above is that we generated no missing observations as both missing_pct and missing_per_subject were set to 0. Therefore miss_data was empty. We can compare this to the case below where we induce missingness into the data.
> sim_dt <- mvrnorm_sim(n_control=20, n_treat=20, control_mean=2, sigma=1,
+                       num_timepoints=7, t_interval=c(0, 6), rho=0.7,
+                       corr_str="compound", func_form="quadratic",
+                       beta=c(0, 3, -0.5), missing_pct=0.2,
+                       missing_per_subject=2, miss_val=0, asynch_time=TRUE)
> head(sim_dt$miss_data[order(sim_dt$miss_data$miss_id, sim_dt$miss_data$miss_time),])
   miss_id miss_time
11       6         5
12       6         6
13      13         2
14      13         4
10      16         3
9       16         4
> head(sim_dt$df[sim_dt$df$ID %in% sim_dt$miss_data$miss_id, ])
           Y ID      time   group     Y_obs
36 1.7663067  6 0.0000000 Control 1.7663067
37 0.5918298  6 0.1084354 Control 0.5918298
38 2.0162980  6 1.8372196 Control 2.0162980
39 1.7626451  6 1.8900365 Control 1.7626451
40 2.0873529  6 3.2812129 Control 0.0000000
41 2.1775117  6 5.2906868 Control 0.0000000
In this case we see that for t5 and t6 for subject 6 that our outcome with missing data, Y_obs, is now set as 0 which was specified as our missing value while the complete data has the original value before inducing missingness. Another feature demonstrated in this second example is using the asynch_time option. When this variable is set to true, timepoints are randomly drawn from a uniform distribution over the interval [t0, tq]. By construction it is assumed that all individuals have a baseline measurement recorded at t0, but all remaining timepoints are drawn at random. The corresponding plot of the outcome Y_obs for this simulation which contains the induced missing observations and asynchronous time measurements is shown in Figure 2b.
As mentioned in the Distributional assumptions section, data are generally generated one feature at a time. However, we may want to simultaneously create data with similar patterns across a number of features with certain features experiencing differential abundance while others have no differential abundance patterns. To do this we can use the function gen_norm_microbiome which lets users specify the number of total features to simulate, features, and the number of total features to be differentially abundant, diff_abun_features. In the example below 10 total features are generated with 4 features having longitudinal differential abundance with an L_down hockey stick type trend.
> bug_gen <- gen_norm_microbiome(features=10, diff_abun_features=4, n_control=20,
+                                n_treat=20, control_mean=2, sigma=1,
+                                num_timepoints=5, t_interval= c(0, 10), rho=0.7,
+                                corr_str="compound",  func_form="L_down",
+                                beta=c(2, -0.5),  missing_pct=0.2,
+                                missing_per_subject=2,  miss_val=0)
Simulating Diff Bugs

  |++++++++++++++++++++++++++++++++++++++++++++++++++| 100% elapsed=05s
Simulating No-Diff Bugs

  |++++++++++++++++++++++++++++++++++++++++++++++++++| 100% elapsed=07s
> head(bug_gen$bug_feat)
         ID time   group Sample_ID
Sample_1  1  0.0 Control  Sample_1
Sample_2  1  2.5 Control  Sample_2
Sample_3  1  5.0 Control  Sample_3
Sample_4  1  7.5 Control  Sample_4
Sample_5  1 10.0 Control  Sample_5
Sample_6  2  0.0 Control  Sample_6
> bug_gen$Y[, 1:5]
              Sample_1 Sample_2 Sample_3  Sample_4     Sample_5
Diff_Bug1   2.78721292 3.034923 2.448909 3.4472145   2.01708421
Diff_Bug2   2.17420076 2.126378 1.875765 2.1224031   1.45393399
Diff_Bug3   3.00420764 2.667490 2.919144 2.5646103   1.98241611
Diff_Bug4   2.79533312 2.526658 2.254584 3.4089330   3.46269243
NoDiffBug_1 1.91089105 2.000122 1.265382 1.1625345   0.97581881
NoDiffBug_2 3.20731129 3.446508 3.389278 3.1057941   4.21898174
NoDiffBug_3 0.05647967 0.000000 1.553321 0.2595184   0.08792209
NoDiffBug_4 2.08900175 1.566923 1.917273 1.4543443   1.34799811
NoDiffBug_5 0.03105152 2.350758 2.139133 1.5934641   0.58829093
NoDiffBug_6 2.24743076 3.082808 2.526052 1.8868046   2.33309314
There are two objects returned in this function, bug_feat and Y. The object bug_feat contains all of the sample specific information including Subject ID, timepoint tj, an indicator for group assignment and the Sample_ID which ranges from Sample_1 up to Sample_N. The other object Y is the typical OTU (operational taxonomic unit) table with rows corresponding to features and column to samples that are commonly used for analysis in packages such as metagenomeSeq14,15 and phyloseq16. There are two additional helper functions that will convert the simulated data into MRexperiment or phyloseq objects respectively to allow practitioners to use simulated data in either of these familiar environments.
> # convert to MRexperiment object
> MR_bug_gen <- simulate2MRexperiment(bug_gen)
> MR_bug_gen
MRexperiment (storageMode: environment)
assayData: 10 features, 200 samples
  element names: counts
protocolData: none
phenoData
  sampleNames: Sample_1 Sample_2 ... Sample_200 (200 total)
  varLabels: ID time group Sample_ID
  varMetadata: labelDescription
featureData: none
experimentData: use ’experimentData(object)’
Annotation:
> head(pData(MR_bug_gen))
         ID time   group Sample_ID
Sample_1  1  0.0 Control  Sample_1
Sample_2  1  2.5 Control  Sample_2
Sample_3  1  5.0 Control  Sample_3
Sample_4  1  7.5 Control  Sample_4
Sample_5  1 10.0 Control  Sample_5
Sample_6  2  0.0 Control  Sample_6
>
> # convert to phyloseq object
> phylo_bug_gen <- simulate2phyloseq(bug_gen)
> phylo_bug_gen
phyloseq-class experiment-level object
otu_table()   OTU Table:         [ 10 taxa and 200 samples ]
sample_data() Sample Data:       [ 200 samples by 4 sample variables ]
> head(sample_data(phylo_bug_gen))
Sample Data:        [6 samples by 4 sample variables]:
         ID time   group Sample_ID
Sample_1  1  0.0 Control  Sample_1
Sample_2  1  2.5 Control  Sample_2
Sample_3  1  5.0 Control  Sample_3
Sample_4  1  7.5 Control  Sample_4
Sample_5  1 10.0 Control  Sample_5
Sample_6 2 0.0 Control Sample_6Another important goal of the simulation software is the ability to closely approximate real data from longitudinal experiments where sequencing was performed. To demonstrate this ability using microbiomeDASim we will approximate observed data from a longitudinal study on the human gut microbiome in gnotobiotic mice10. This data file is available within the metagenomeSeq package, and is particularly interesting to simulate for several reasons. The experiment was performed with a total of 12 mice, 6 in each treatment arm, to test the effect of a low-fat, plan polysaccharide-rich diet (BK) versus a high-fat, high-sugar (Western) diet. This small scale study showed promising results and may warrant a larger scale clinical design to investigate the robustness of the effect of diet on the gut microbiome. As such, we can use the simulation tools to generate hypothetical results for this large scale trial assuming that we observe either the same functional trend as the original study or any of the possible hypothetical functional trends at our disposal, including no differential abundance. We will show how to generate hypothetical data for a large scale version of this experiment by increasing the sample size by five fold and replicating the observed functional trend for a particular feature of interest.
As a first step we need to identify a particular feature of interest at an appropriate taxonomic level. The original data contains sequenced counts on over 10,000 OTUs with the majority of these being extremely low frequency features. Since the total sample size (n=12) is too small for central limit theory approximations to be valid, we aggregate counts to the genus level for modelling. We further filter genus level features by imposing a minimum depth of 1000 and presence of 10, leaving a set of 35 features. Of these 35 features, we select one at random which we will want to replicate using our simulation framework. In our case we select the genus Sutterella. The raw sequencing counts are then log normalized using the default procedure available in the metagenomeSeq package which will serve as our primary outcome of interest. We plot these results over time as shown in Figure 3.
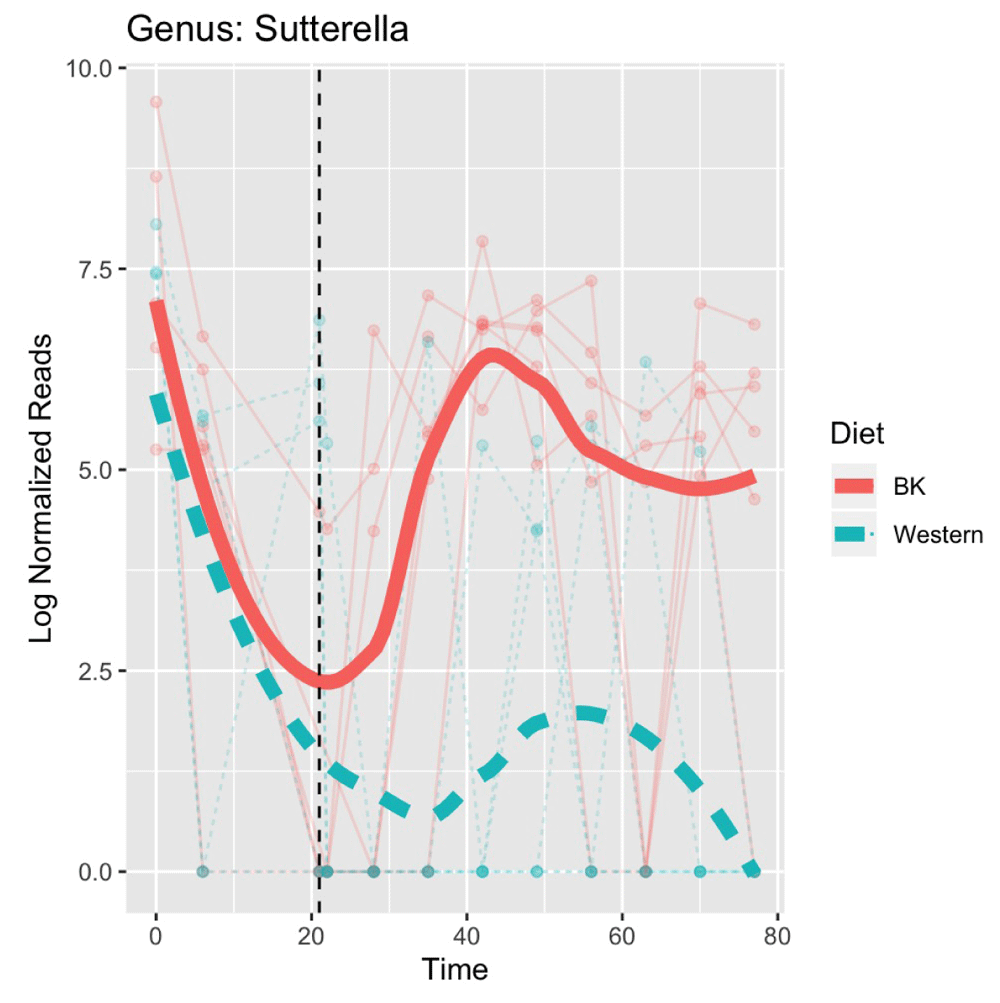
Note that both groups had equivalent diets over the first 21 days with half of the mice switching to the Western diet at this point marked with the vertical dotted line.
There is significant variability between the groups with a marked decrease in both groups prior to the implementation of the intervention. We see a bounce back effect to baseline levels occurring in the BK diet group while the Western diet group have significantly lower values across the remainder of the study period. We see that the measurement timepoints for each individual vary slightly and are not equally spaced over the entire study window.
As the primary interest lies in the difference between the diet groups across time, we develop our simulation model by re-scaling the BK reference group to a constant level across time and allowing theWestern group to vary. To obtain an initial estimate of this treatment functional trend we use the metagenomeSeq15 package to fit a Gaussian smoothing spline ANOVA (SS-ANOVA) shown in Figure 4.

The black line represents the point estimate with the dashed red lines corresponding to 95% confidence intervals fit using Gaussian smoothed spline ANOVA.
We see that over the initial 21 days that the 95% confidence intervals for the differential abundance overlaps zero, and that after the intervention begins that the Western group is significantly lower than the BK group. While the estimated trend is non-linear, we may expect that this is a function of small sample size noise and that the true functional trend is a linearly decreasing trend. We therefore construct our hypothetical functional form using the L_up designation assuming there is no differential abundance over the interval t ∈ [0, 21] followed by a linearly decreasing trend over the interval t ∈ (22,80]. We show this chosen functional form alongside the estimated differential abundance in Figure 5.

The black line represents the point estimate with the dashed red lines corresponding to 95% confidence intervals fit using Gaussian smoothed spline ANOVA.
In general our hypothetical trend is contained within the estimated bounds of the smoothed fig, and we may believe that it is an ecologically valid representation of the expected change over time.
With microbiomeDASim we can use the observed times for each ID, and replicate each subject five times creating a total sample size of n=60 with 30 mice in each treatment arm. We use the data to obtain estimates for sigma and control_mean along with the functional form chosen above to generate the simulated data using the mvrnorm_sim_obs() function with an AR1 correlation structure. The results for the simulated data are shown in Figure 6.
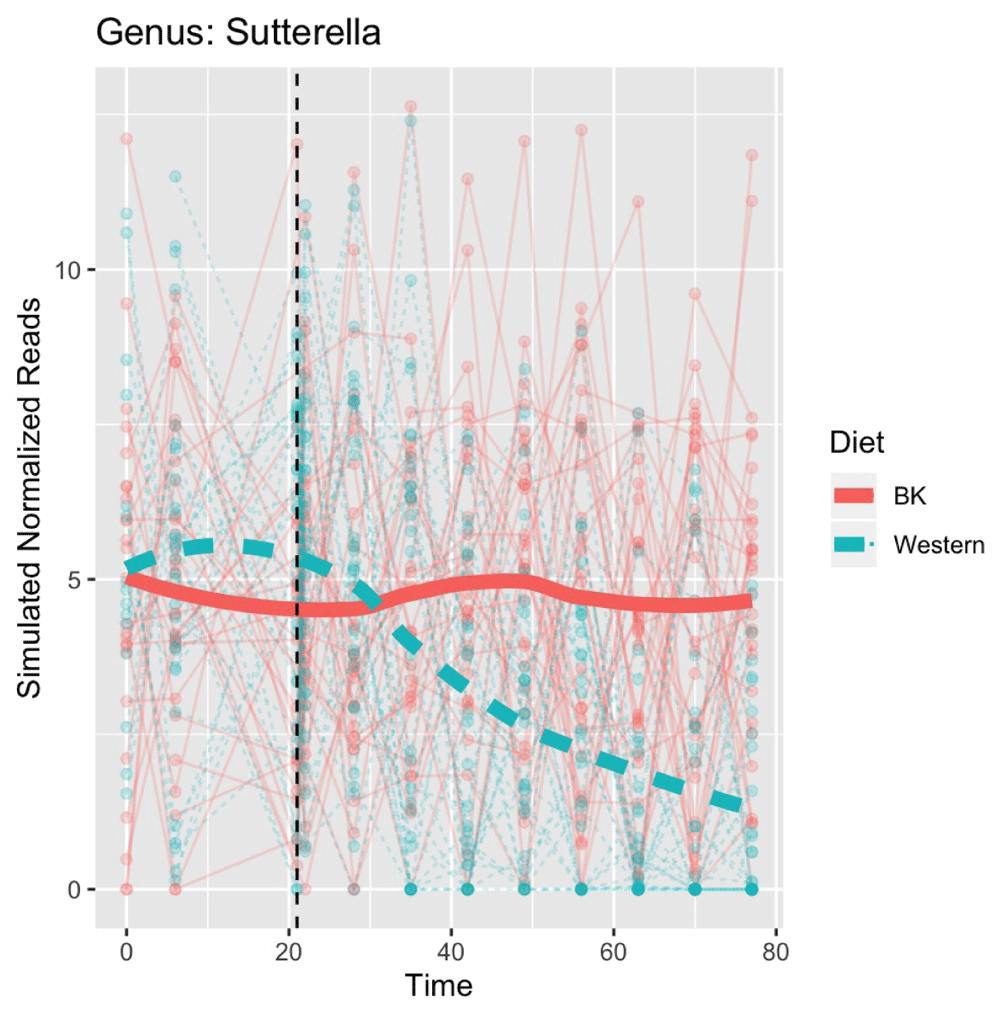
The black line represents the point estimate with the dashed red lines corresponding to 95% confidence intervals using metaSplines to fit smoothed spline ANOVA.
This simulated data could then be used to conduct power analyses of detecting differential abundance at time t ∈ [t0, tq] or this process could be repeated multiple times to generate feasible bounds for what the trend may look like in this larger sample. Alternatively, the observed data could be altered to change the planned time point measurements to see the effect of collecting fewer samples during the follow-up period. In addition, as mentioned earlier in this section multiple functional forms could be tested including situations where no differential abundance is observed to determine the likelihood of committing Type 1 errors. Further details and code for this example are available on GitHub at inst/script/mouse_microbiome_approximation.pdf
Next, we want to use our simulation design to test some of the available methods to estimate longitudinal differential abundance. We will examine properties of the estimation method available in the metagenomeSeq15 package to fit a Gaussian smoothing spline ANOVA (SS-ANOVA) model11,17,18 referred to here after as the metaSplines method. We start by generating our simulated data. In this example we will fix parameters to have q = 10 repeated measurements on each individual with n0 = n1 = 30 individuals per arm.
> #generating the simulated data
> out_sim <- mvrnorm_sim(n_control = 30, n_treat = 30, control_mean = 2, sigma = 1,
+                        num_timepoints = 10, t_interval=c(1, 10),
+                        rho = 0.8, corr_str = "compound",
+                        func_form = "L_up", beta = 0.5, missing_pct = 1,
+                        missing_per_subject = 2, IP = 5)
>
> #capturing the true mean values for the specified functional form
> true_mean <- mean_trend(timepoints=seq_len(10), form = "L_up", beta =  0.5, IP = 5)
>
> MR_mvrnorm <- simulate2MRexperiment(out_sim)
> MR_mvrnorm
MRexperiment (storageMode: environment)
assayData: 1 features, 600 samples
  element names: counts
protocolData: none
phenoData
  sampleNames: 1 2 ... 600 (600 total)
  varLabels: ID time group
  varMetadata: labelDescription
featureData: none
experimentData: use ’experimentData(object)’
Annotation:
After generating the simulated data, we fit the model. Note that one can fit either the outcome with the complete data or the outcome with imputed missing data. In this example we use the complete data. To use the induced missing data when creating the MRexperiment object we would set the missing variable in simulate2MRexperiment to TRUE.
>
> #fitting the metaSplines model with random intercept
> metasplines_mod <- fitTimeSeries(obj = MR_mvrnorm, formula = abundance ~ time*class,
+                                   id = "ID", time = "time", class = "group",
+                                   feature = 1, norm = FALSE, log = FALSE, B = 1000,
+                                   random = ~ 1|id)
Loading required namespace: gss
[1] 100
[1] 200
[1] 300
[1] 400
[1] 500
[1] 600
[1] 700
[1] 800
[1] 900
[1] 1000
Now we can display the estimated interval of differential abundance
> metasplines_mod$timeIntervals
Interval start Interval end Area p.value
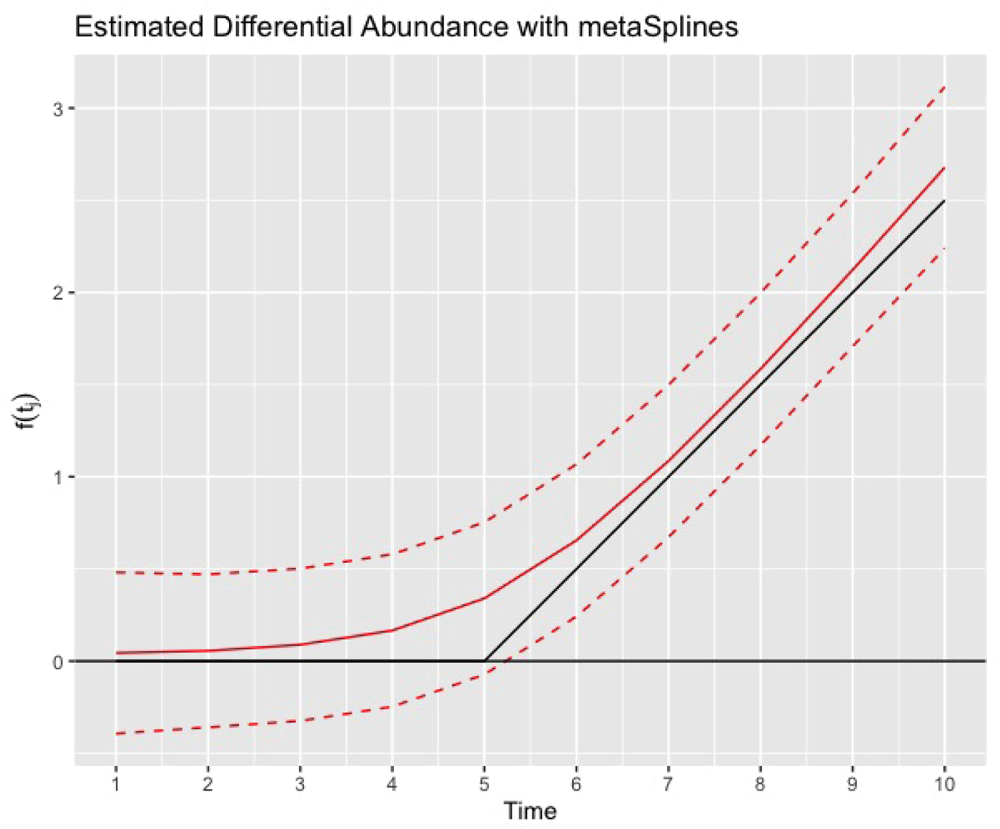
[1,] 6 10 6.457622 0.000999001We compare the estimated trend to the truth f(tj) as shown in Figure 7. We observe that the metaSplines estimate falls closely to the true functional form. Further, the confidence intervals for the functional form completely contain the true trend reflecting that the variability in estimation is accurately reflected.
In the example for metaSplines above we looked at performance using a visual inspection for a single choice of parameter values. Using our simulation framework we can expand our investigation of performance. By knowing the true underlying functional form we can quantify how accurate a particular estimation method captures the truth as a function of sample size per group, number of repeated observations, signal-to-noise strength, type of functional form etc. In order to use the simulated data to compare different longitudinal methods for estimating differential abundance we need to define performance metrics that quantify how accurate an estimate is to the truth. We propose four different performance metrics that can be used when comparing methods.
1. Sensitivity/Specificity ∈ [0, 1]
2. Cosine Similarity
3. Euclidean Distance
4. Normalized Euclidean Distance
To ensure robustness, for each set of parameter values simulated multiple repetitions, B, are required. Sensitivity is defined as the number of repetitions where any differential abundance at any value tj ∊ {t1, . . . , tq} is detected over the total number of repetitions given that the functional form had some true differential abundance over time, i.e. f (tj) ≠ 0 ∀tj ⇔ µ1 ≠ µ0. Likewise, specificity is defined as the number of repetitions where no differential abundance was detected across all timepoints over the total number of repetitions given that the function form had no true differential abundance over time, i.e., f (tj) = 0 ∀tj. The other remaining metrics are continuous values that look to compare how closely the estimated mean trend is to the true trend at a set of points tj ∊ {t1, . . . , tq}. Cosine similarity is comparable across different lengths of t, but is not particularly discriminant especially near the boundaries around –1 and 1. The Euclidean distance quantifies how far apart each point is but the length of t is highly influential. Therefore, to make the Euclidean distance comparable across different lengths of repeated observations we can use the normalized Euclidean distance which first transforms the estimated and true functional form into unit vectors and then calculates the distance between these unit vectors.
Using these performance metrics we simulated data across a range of different parameters settings and then estimated the functional form of the trend using the metaSplines procedure described earlier for a total of 100 repetitions for each parameter setting. Below we show the performance results for a simulation where the functional form was fixed as L_up with an AR(1) correlation structure, ρ = 0.7, and varied the sample size per group, standard deviation, and timepoints from small, medium, and large respectively. The corresponding sensitivity and specificity results are shown in Figure 8a and Figure 8b.
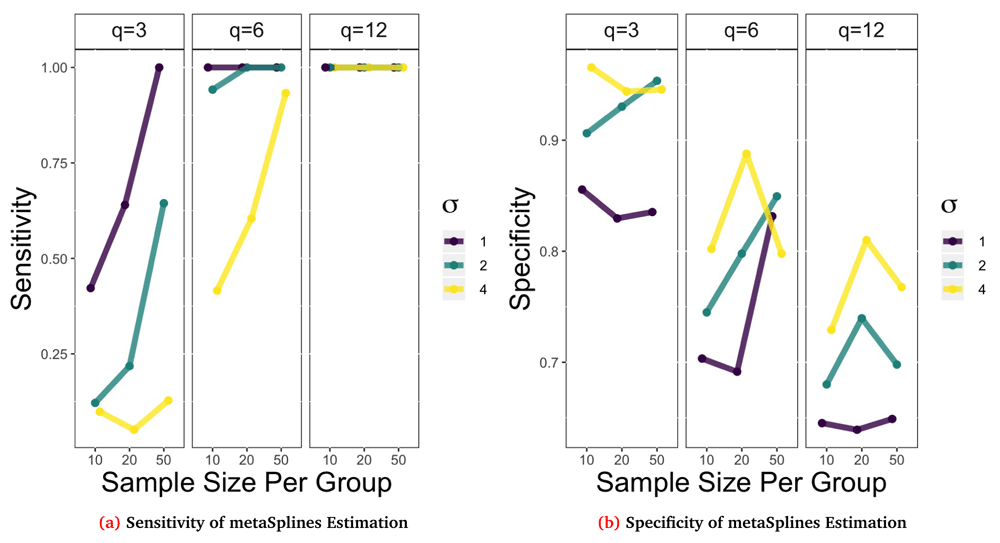
Remaining parameters were varied to create 27 different combinations of repeated measurements, sample size per group, and σ. Points plot are the average result of B = 100 repetitions.
Looking at Figure 8a, in general the sensitivity decreases as σ increases for a fixed sample size and q. For example when n0 = n1 = 10 and q = 6 the estimation procedure is perfectly sensitive (100%) when σ = 1 but has lower sensitivity (42%) when σ = 4. Also as the sample sizes increases for a fixed q and σ, sensitivity generally increases. Likewise, as the number of repeated observations increase, i.e. q increases, the sensitivity increases quite dramatically. This figure suggests that 6 repeated measurements is sufficiently large to detect differential abundance for strong (σ = 1) or medium (σ = 2) signals regardless of the sample size per group. On the other hand, we can look at the specificity in Figure 8b to see that these trends are no longer monotonic. In general we note that as q increases the specificity decreases and that as σ increases the specificity tends to increase. However, the trend for sample size is more nuanced and may variable due to the number of repetitions that were estimable. Using the metaSplines method there were cases with small sample size and repeated observations that the method returned no estimate.
The sensitivity results shown above were for a single choice of functional form, but this is another potential parameter of interest to test. We ran a similar set of parameter combinations for 7 other functional forms shown in Table 1 below to compare the sensitivity as a function of the type of trend. In this table we can see that the non-differential trends, Oscillating, and variable trends, Hockey Stick, had lower average sensitivity while the linear and quadratic trends tended to perform the best.
Parameter values used: σ ∊ {1, 2, 4}, n0 = n1 ∊ {10, 20, 50}, q ∊ {3, 6, 12}. Note that the Total Non-Missing Observations is less than the Total Observations.
The continuous performance metrics for the cosine similarity, Euclidean distance and normalized Euclidean distance are shown in Figure 9 for the L_up trend with AR(1), ρ = 0.7. From this figure we see similar trends as the sensitivity results. Starting from the left most panel we see that the cosine similarity is highest when σ is small, q, n0, n1 are large. The spread of cosine similarity scores when q = 12 are very tightly clustered around 1 while the spread of values when q = 3 or q = 6 is larger. The center plot illustrates that using raw Euclidean distances with a small number of repeated measurements tend to have smaller distances, but this trend is not seen with normalized Euclidean distance in the last panel. Within each value of q in this middle panel there is a consistent trend that as the sample size per group increases the distance generally decreases. Finally moving to the last panel we have the normalized Euclidean distance, which can now be used to compare across different repeated measurement panels. We see a similar trend to the cosine similarity where the distance decreases, meaning better performance, for small σ and large q and n0 = n1.
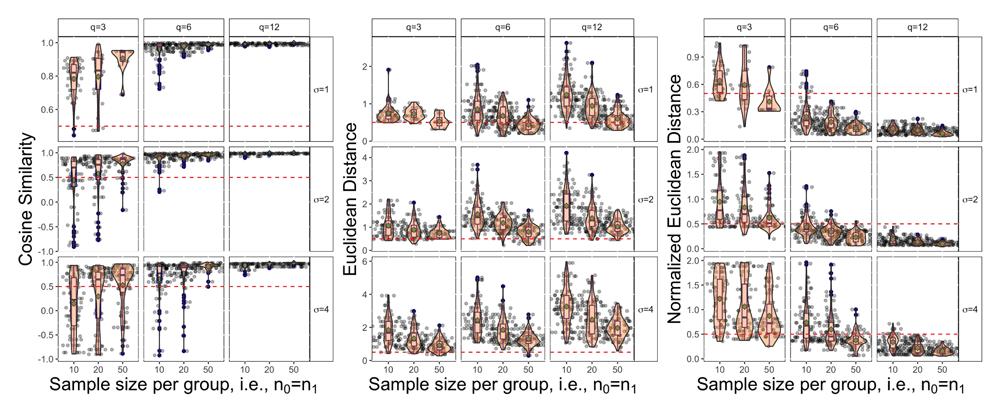
Note that the red dashed line serves as a reference point at 0.5 and the green dot in each panel represents the mean value across the 100 repetitions
Similar to the sensitivity performance metrics shown in Table 1, we can also compare the average value of the continuous performance metrics based on functional form. This is shown in Table 2. Similar trends appear in this table with the linear trends having the highest average cosine similarity scores and lowest average normalized Euclidean distance and non-differentiable trends peforming worse.
Parameter values used: σ ∊ {1, 2, 4}, n0 = n1 ∊ {10, 20, 50}, q ∊ {3, 6, 12}. Note that the Total Non-Missing Observations is less than the Total Observations.
With an increasing emphasis on understanding the dynamics of microbial communities in various settings, longitudinal sampling studies are underway. There remain many statistical challenges when dealing with longitudinal data collected from marker-gene amplicon sequencing. In order to validate and compare methods of estimation for longitudinal differential abundance a unified simulation framework is needed. Currently available simulation tools include R packages seqtime19 and untb20. These packages focus primarily on simulation from the perspective of ecological processes aimed to capture the entire community dynamics. With microboimeDASim package9 we instead provide the tools to simulate various functional forms for longitudinal differential abundance with added flexibility to control important factors such as the number of repeated measurements per subject, the number of subjects per group, within subject correlation, sequencing of time measurements, etc. for a specific feature of interest. We have shown the benefit of these simulation tools by constructing a simulation design based on real microbiome data and showed the utility in methods evaluation using the metaSplines estimation procedure to compare the performance across a wide range of different parameter settings. In this manner the microbiomeDASim helps meet an important need in the research community to help in study design and compare existing methods as well as validate potentially novel methods.
All data underlying the results are available as part of the article and no additional source data are required.
microbiomeDASim is available at: http://bioconductor.org/packages/microbiomeDASim.
Source code available from: https://github.com/williazo/microbiomeDASim
Archived source code at time of publication: https://doi.org/10.5281/zenodo.34585639.
License: MIT.
| Views | Downloads | |
|---|---|---|
| F1000Research | - | - |
|
PubMed Central
Data from PMC are received and updated monthly.
|
- | - |
Provide sufficient details of any financial or non-financial competing interests to enable users to assess whether your comments might lead a reasonable person to question your impartiality. Consider the following examples, but note that this is not an exhaustive list:
Sign up for content alerts and receive a weekly or monthly email with all newly published articles
Already registered? Sign in
The email address should be the one you originally registered with F1000.
You registered with F1000 via Google, so we cannot reset your password.
To sign in, please click here.
If you still need help with your Google account password, please click here.
You registered with F1000 via Facebook, so we cannot reset your password.
To sign in, please click here.
If you still need help with your Facebook account password, please click here.
If your email address is registered with us, we will email you instructions to reset your password.
If you think you should have received this email but it has not arrived, please check your spam filters and/or contact for further assistance.
Comments on this article Comments (0)