Keywords
Galaxy, metagenomics, differential abundance, high throughput sequencing, phyloseq
This article is included in the Galaxy gateway.
Galaxy, metagenomics, differential abundance, high throughput sequencing, phyloseq
It is now recognized that there is a strong link between microbial communities in the human body and human health1. While the importance of such communities is understood, the composition and function of the human micro-biome largely remains a mystery. Uncovering how the composition and function of the micro-biome impacts human health represents a significant area of growth. Another important area of research growth is the study of environmental microbial communities in fields such as agriculture, marine science, and ecology. By identifying the composition of microbial communities, researchers are able to link microbes to specific environments and using comparative metagenomics identify how microbial communities’ changes under altered environmental conditions.
Central to elucidating the link between the metagenomic data and human health or altered environmental conditions is sequencing; however, obtaining useful research outcomes from large volumes of unprocessed sequence data represents a challenge for many bench scientists. The major bottleneck in obtaining value from such data is the huge computational and logistic task required for analysing the large volumes of sequencing data routinely generated in a single sequencing run.
The sequencing of entire microbial communities requires metagenomic analysis tools. These tools rely on the ability to analyse unbroken sequence reads covering the 16S variable regions. Due to limitations of short read sequencing platforms such as IIlumina, the longest fragment of variable regions of a 16S gene that can be sequenced is shorter than the ideal full 600 bp. Illumina paired-end sequencing of 300 bp on forward read and reverse read produces only 550 bp to allow for stitching the forward end and reverse end together. With 550 bp fragment length, the reads can cover both variable region 3 (V3) and variable region 4 (V4). The length of V3 and V4 are 393bp and 440bp respectively.
A major challenge for bench scientists working with metagenomic data is that many popular software programs requires a 64-bit Linux environment, an environment often unavailable and unfamiliar to researchers. Furthermore, even when such an environment is available, the complexity of the rapidly changing metagenomic algorithms means no gold standard methodologies exist. As such, there are currently over 100 metagenomic analysis tools available, making it challenging to select the appropriate software. For example, the popular metagenomic tool QIIME2 consists of more than 150 python scripts, many of which are wrappers to external programs.
An increasingly common alternative for the growing number of non-bioinformaticians working with NGS data is the availability of user-friendly interfaces. These interfaces are typically attached to significant compute resources with pre-installed software packages readily available. Interfaces such as Galaxy3 or the Genomics Virtual Lab4 are examples of powerful platforms that grant non-bioinformaticians access to the latest NGS methodologies. The Galaxy platform enables scientists to use bioinformatics tools in an easy to use graphical user interface (GUI) environment, where tool resource management is handled by the administrators of each Galaxy service. The platform’s functionality power comes from the ability to chain tools into workflows, and share the data and workflows. Further, the flexibility of Galaxy platform allows developers to integrate new tools and workflows into the platform. Galaxy maintains a single tool shed repository of pre-wrapped tools that cover an abundance of next generation sequence analyses.
Despite these solutions however, challenges remain in fast moving research areas such as metagenomics with limited metagenomic workflows currently available within the popular Galaxy framework. Currently, there is one end-to-end existing metagenomics workflow offering, the recently published ASaiM5 for both 16S and shotgun metagenomic analysis. While there is overlap between their workflows, MetaDEGalaxy differs in its focus on differential abundance by incorporating the capabilities of phyloseq6 and DESeq27 for complex differential bacterial analysis. DESeq2 contains tests specifically developed to detect significant differences in abundances for counts data. While DESeq2 is most commonly utilised for differential gene expression in RNASeq, using the phyloseq API a Biological Observation Matrix (BIOM) file is formatted for use within DESeq2 and differences in taxa abundances discovered. MetaDEGalaxy also offers extensive graphing capabilities by wrapping the comprehensive metagenomics R-package phyloseq6. Extensive graphing options are available within MetaDEGalaxy wrapping most functions offered within phyloseq which offer the user a high level of control. Additionally, user supplied metadata files can be input to DESeq2 for model generation and to phyloseq for enhanced graphing capabilities allowing for grouping, clustering, and colouring of all graph types based on metadata information. All software wrapped within the workflow is open-source software, a current limitation of existing workflows such as usearch8 within the popular QIIME package 2. Finally, MetaDEGalaxy is designed within the popular Genomic Virtual Lab4 leveraging the functionality of this robust infrastructure.
MetaDEGalaxy accepts either 454 or Illumina paired end sequence FASTQ files that can be overlapping or non-overlapping. Users may alternatively input a pre-computed BIOM file if they do not require BIOM file generation. Additional functionality requires a sample specific tab-delimited metadata file formatted according to QIIME map file standards. This metadata information can be utilised for determining the model to employ within DESeq2 and to generate graphs grouped by various metadata attributes.
In total, there are four workflows in MetaDEGalaxy (Table 1) which utilise a combination of external software and custom code.
External software available include Trimmomatic (v0.32.2)9, FastQC (v0.52), PEAR (v0.9.6)10, SAMTools (v1.1.2)11, BWA (0.7.12.1)12, VSEARCH (v1.9.7)13, the BIOM API, DESeq2 (v2.1.8)7 and phyloseq (Galaxy v1.0)6.
Four comprehensive MetaDEGalaxy tutorial are currently available in github which demonstrate how to work with both overlapping and non-overlapping 16S paired end Illumina reads.
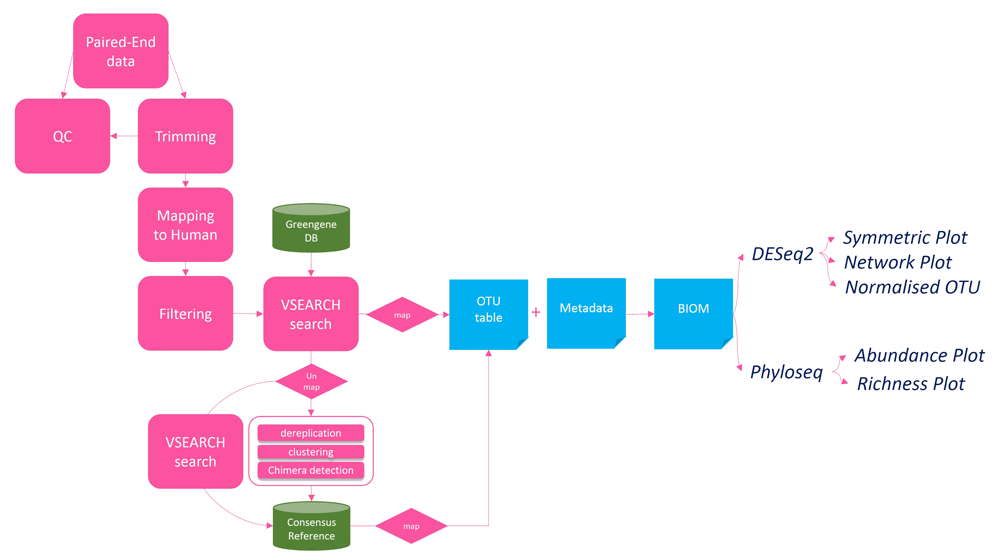
Tutorial #1 details the workflow for data QC and the detection of paired end overlap in sequencing data and preparing FastQ files for metagenomic analysis (Figure 1). Tutorial #2 details the entire workflow for overlapping paired end Illumina reads (Figure 2) using the same data set employed by the Mothur_SOP run with the popular Mothur software (v1.35.1)14. This workflow inputs a group of paired-end MiSeq files and a metadata map file and generates overlapping FASTQ files, an annotated BIOM file, a DESeq2 table of differentially expressed microbes, and a variety of phyloseq graphs. Tutorial #3 details the entire workflow for non-overlapping paired end Illumina reads and is similar to tutorial #2 with the exception of pre-processing steps transforming FASTQ files into a Fasta file where PEAR10 software is not run. Finally, tutorial #4 details a workflow for BIOM file processing and analyses detailing how to utilise the platform for analyses starting from an input BIOM file.

Both workflow 2 and 3 use all the components in the workflow, the only difference is workflow 2 takes in paired-end reads data as input and workflow 3 take single-end reads data as input. The workflow 4 is the subset of the main workflow which starts with blue boxes and ends with all plots generated.
The Galaxy environment is available for testing purposes at http://203.101.224.124/galaxy and will be available on Galaxy Australia server by the end of 2019 (https://usegalaxy.org.au/). The minimum system requirements for installing the MetaDEGalaxy are a 64-bit unix environment at 4Gb of memory.
To demonstrate some of the advanced functionality of MetaDEGalaxy, we follow tutorial #2 using the Mothur_SOP data to first generate a normalised count table and a table of differentially abundant OTUs (Table 2). The differentially abundant OTU table is formatted in DESeq2 output with additional taxonomic information appended to each row.
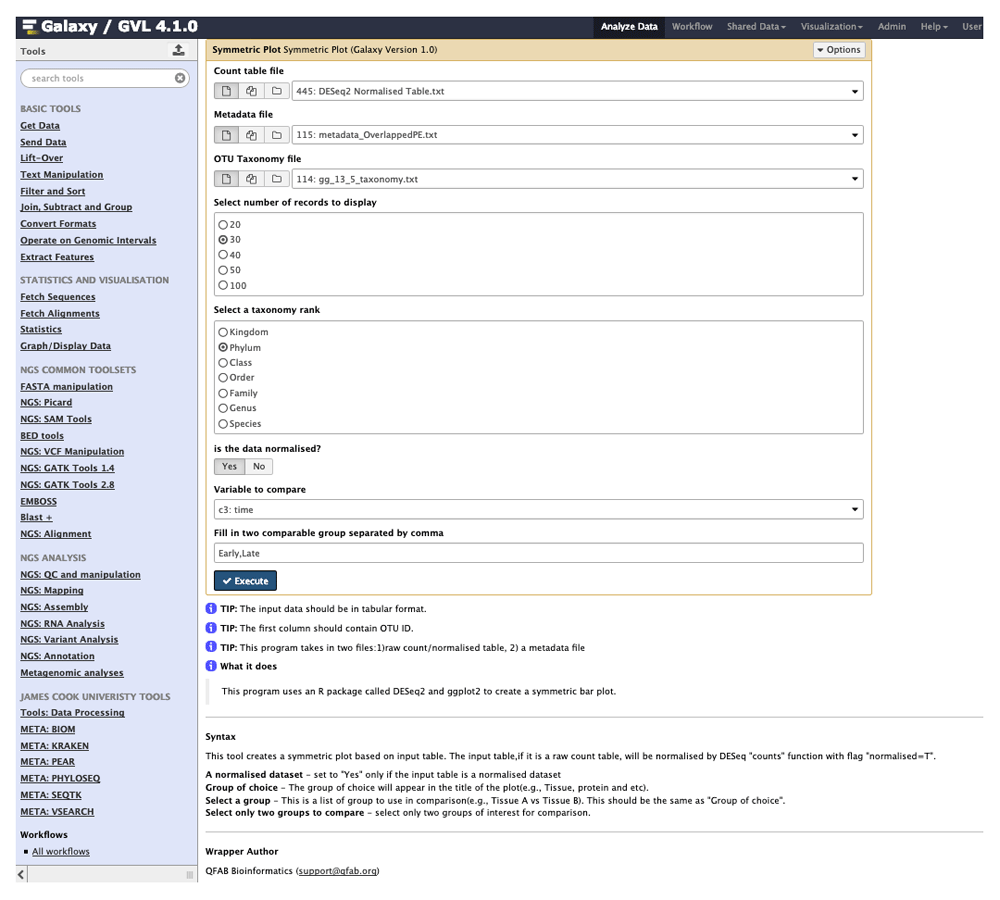
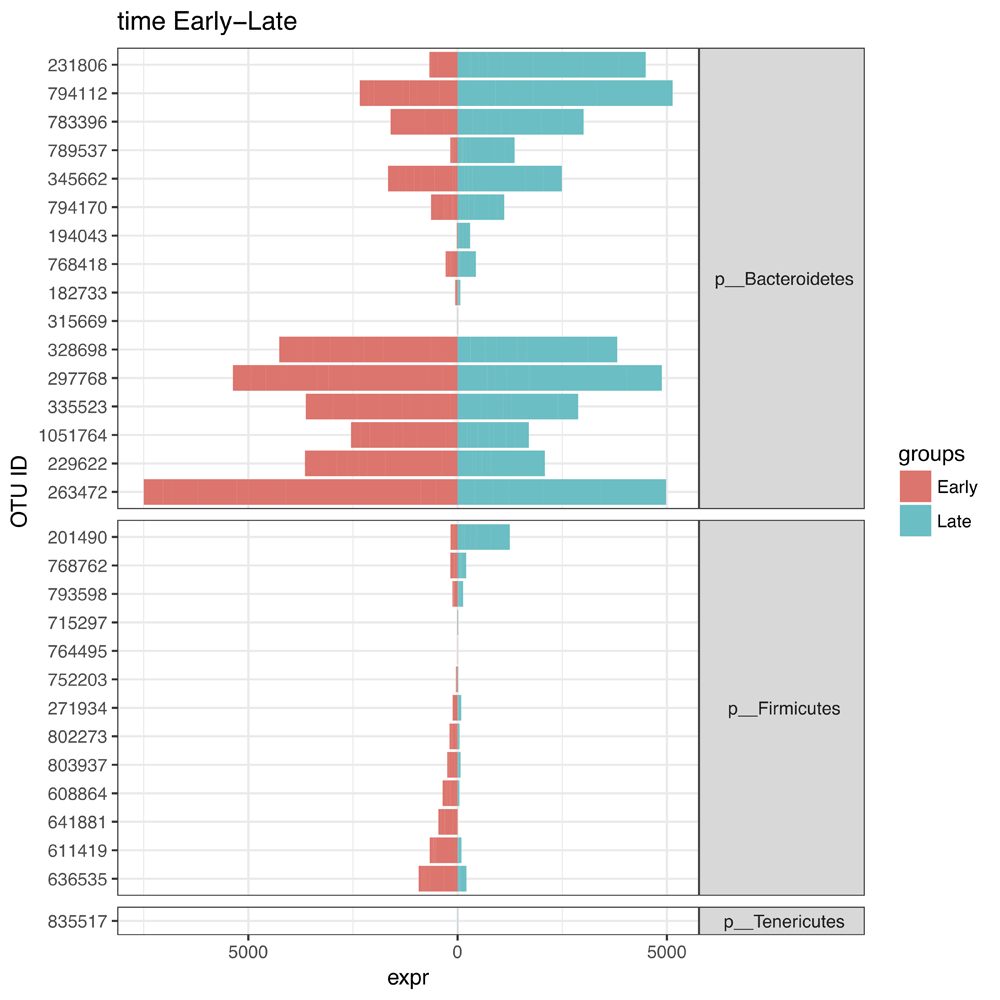
We use this table of differentially abundant OTUs to next generate a symmetric plot. Users are able to select any taxonomic level as well as any metadata variable for comparison and further to pick two values of this variable for direct comparison (Figure 3). In this example, we pick Phylum for our taxonomy level and time as our variable of interest and group the graph according to ‘Early’ or ‘Late’. The resulting symmetric plot shows the differences in OTUs for ‘Early’ and ‘Late’ samples across different phylum (Figure 4). We are also able to generate alpha diversity abundance plots according to various sample attributes grouped here for ‘Replicate Group’ and coloured by ‘Food’ (Figure 5). As a final example, we generate a network plot where we select ‘Replicate group’ for the correlation and select ‘Food’ as the legend (Figure 6).

Users are able to select the taxonomic rank to examine in addition to two values within any user-defined metadata category.

MetaDEGalaxy is compared to existing software in Table 3. There are comparable web and/or GUI based tools such as QIIME2, Calypso, Explicet, and Megan, however none of these tools are currently available within the popular Galaxy framework. There is currently one actively developed end to end 16S workflows within Galaxy, ASaiM5.
Of the available web-based or GUI-based options, only QIIME2, ASaiM, and MetaDEGalaxy offer end-to-end workflows beginning from input FASTQ files. Only MetaDEGalaxy and Calypso offer extensive differential abundance tools incorporating the algorithms of sophisticated tools for finding differences in count data such as DESeq2. Finally, only ASaiM and MetaDEGalaxy run in the popular Galaxy framework making the set of attributes available within MetaDEGalaxy unique.
To demonstrate how to use MetaDEGalaxy we offer four in-depth tutorials describing available workflows. Tutorials 1, 2 and 4 utilise the same input data as the well-documented Mothur_SOP while tutorial 3 utilises custom 300bp paired end, non-overlapping Illumina MiSeq data. In either use case, reads can be accessed and pre-processed via Galaxy Interface with the following steps:
1) click on "Operations on multiple dataset" on the top of the history panel
2) check the box for all paired-end files listed on the history panel
3) click on the "For all selected..." button the top of the history panel
4) click on "Build list of Dataset Pairs" on the drop-down menu
5) Type in a common field of the file name for both forward and reverse paired end data
6) click on the "Auto-pair"
7) Enter a name for the collection of paired datasets and click "Create list"
Apart from the paired-end reads in data collection, users are required to have loaded the metadata table and both 16S reference genome and annotation files. When the paired-end reads from a data collection is imported into a Galaxy history, an important step for the later in the workflow is the renaming of the FASTA sequence header by appending the sample ID to end at the end of each read ID using the reheader tool in Galaxy. This information will be used as the column header for OTU table generated by the workflows.
Workflow 1 (Figure 1) is designed to detect the status of overlapped paired-end reads data using PEAR. Users should proceed with workflow 2 if the percentage of overlapped paired-end reads data is high. Otherwise, workflow 3 should be used for non-overlapping reads. Both workflow 2 and 3 are fundamentally the same (Figure 2), however, workflow 3 can take single-end reads data as input when the overlapped paired-end reads are not overlapping.
Workflow 4 is designed to take a precomputed BIOM file as input. BIOM file format is designed to store OTU counts, metadata, and OTU annotation into one file. When users input a BIOM file, workflow 4 can be used to add metadata to an existing BIOM file and create abundance bar plot, network plot and symmetric plots using phyloseq R package.
More detailed tutorial documentation is available in the github repository.
MetaDEGalaxy is a complete end-to-end Galaxy workflow for 16S differential abundance analysis. Harnessing the power of open source algorithms such as vsearch, phyloseq, and DESeq2, MetaDEGalaxy offers users high-level of control over their data and analysis options. Focusing on discovering the most differentially abundant OTUs between samples, MetaDEGalaxy allows users to assess the impact of different environmental condition on overall microbial community composition.
Data used for the tutorials are available from Zenodo:
Zenodo: Mothur MiSeq SOP Galaxy Tutorial Data. https://doi.org/10.5281/zenodo.80065115
Data are available under the terms of the Creative Commons Attribution 4.0 International license (CC-BY 4.0).
Software available from: http://203.101.224.124/galaxy
Source code available from: https://github.com/QFAB-Bioinformatics/jcu.microgvl.ansible.playbook
Archived source code at time of publication: https://doi.org/10.5281/zenodo.265883516
Licence: GNU General Public License v3.0 for all script/wrappers
This work was funded by an internal capacity building grant within the Australian Institute of Tropical Health and Medicine [15025].
The funders had no role in study design, data collection and analysis, decision to publish, or preparation of the manuscript.
We would like to acknowledge Nectar Australia for compute resources for hosting Galaxy.
| Views | Downloads | |
|---|---|---|
| F1000Research | - | - |
|
PubMed Central
Data from PMC are received and updated monthly.
|
- | - |
Is the rationale for developing the new software tool clearly explained?
Yes
Is the description of the software tool technically sound?
Yes
Are sufficient details of the code, methods and analysis (if applicable) provided to allow replication of the software development and its use by others?
Yes
Is sufficient information provided to allow interpretation of the expected output datasets and any results generated using the tool?
Yes
Are the conclusions about the tool and its performance adequately supported by the findings presented in the article?
Yes
References
1. Morin A, Urban J, Sliz P: A quick guide to software licensing for the scientist-programmer.PLoS Comput Biol. 2012; 8 (7): e1002598 PubMed Abstract | Publisher Full TextCompeting Interests: No competing interests were disclosed.
Reviewer Expertise: microbiome research
Is the rationale for developing the new software tool clearly explained?
Yes
Is the description of the software tool technically sound?
Yes
Are sufficient details of the code, methods and analysis (if applicable) provided to allow replication of the software development and its use by others?
Yes
Is sufficient information provided to allow interpretation of the expected output datasets and any results generated using the tool?
Yes
Are the conclusions about the tool and its performance adequately supported by the findings presented in the article?
Partly
References
1. Agafonov A, Mattila K, Tuan CD, Tiede L, et al.: META-pipe cloud setup and execution.F1000Res. 2017; 6. PubMed Abstract | Publisher Full TextCompeting Interests: No competing interests were disclosed.
Reviewer Expertise: Bioinformatics, Galaxy, 16S metagenomics, training
Alongside their report, reviewers assign a status to the article:
| Invited Reviewers | ||
|---|---|---|
| 1 | 2 | |
|
Version 2 (revision) 18 Oct 19 |
read | |
|
Version 1 23 May 19 |
read | read |
Provide sufficient details of any financial or non-financial competing interests to enable users to assess whether your comments might lead a reasonable person to question your impartiality. Consider the following examples, but note that this is not an exhaustive list:
Sign up for content alerts and receive a weekly or monthly email with all newly published articles
Already registered? Sign in
The email address should be the one you originally registered with F1000.
You registered with F1000 via Google, so we cannot reset your password.
To sign in, please click here.
If you still need help with your Google account password, please click here.
You registered with F1000 via Facebook, so we cannot reset your password.
To sign in, please click here.
If you still need help with your Facebook account password, please click here.
If your email address is registered with us, we will email you instructions to reset your password.
If you think you should have received this email but it has not arrived, please check your spam filters and/or contact for further assistance.
Comments on this article Comments (0)