Keywords
Age, prostate volume, prostate specific antigen, PSA density, prostate biopsy, TRUS
Age, prostate volume, prostate specific antigen, PSA density, prostate biopsy, TRUS
Prostate cancer (PCa) is an important health issue worldwide because of its increasing incidence; it was reported that there are 1.1 million PCa patients worldwide in 20121. The incidence of PCa among Indonesian men was estimated to be 14.8 per 100,000 population and the mortality rate was reported as high as 9.8 per 100,000 population in 20121.
Transrectal ultrasonography (TRUS) guided biopsy plays an important role for PCa detection and has become a standard diagnostic method for PCa detection. It is recommended for men with elevated prostate specific antigen (PSA) levels or abnormal digital rectal examination (DRE). In Indonesia, 66.5% of PCa was diagnosed with TRUS-guided biopsy during 1994–2005 and 66.7% of them were found in advanced stage during this period2,3. An appropriate and early detection are needed to detect PCa in its early stages for better treatment results, survival rates, and quality of life4.
The detection rate of prostate biopsy in several Asian countries varied between 14.6% and 26.5% in patients with PSA levels ranging from 2–20 ng/ml5. This widely used procedure for PCa remains controversial as it may lead to over-diagnosis (23%–42%) and over-treatment5. Both are related to unnecessary risk of urinary, sexual, and bowel dysfunction, which can affect patients’ quality of life4,6. Although TRUS-guided prostate biopsy is a safe procedure, there are still complications causing significant morbidity. The most common complications are mild hematuria (62%), rectal bleeding (2%), urinary tract infections (1.7%–11.3%), acute urinary retention (0.3%–2.6%), hematospermia (45.3%–50.4%), vasovagal response (2.8%), and hospitalization due to infection (1%–4.1%)7,8). Systematic screening for prostate cancer by determining other factors besides PSA may assist prevention of this circumstance5.
The aim of this study was to identify the predictor factors such as PSA, age, prostate volume (PV), and PSA density (PSAD) as indications to perform TRUS guided prostate biopsy. Those variables are thought to be important predictors to reduce unnecessary biopsies and improve detection rate.
This retrospective study was approved by FKUI Research Ethical Committee before data collection began. We collected data pre-biopsy data, including age, PSA, prostate volume, and PSAD. These data were obtained from the medical records of patients that underwent prostate biopsy from January 2008 to December 2013 in Cipto Mangunkusumo Hospital, Jakarta, Indonesia. The inclusion criteria were patients with LUTS, PSA level >4 ng/ml, abnormal DRE, IPSS score >7, and age >45 years old, while the exclusion criteria were patients who underwent transperineal prostate biopsy or had been biopsied previously. The indications for prostate biopsy in our hospital were PSA level >4 ng/ml or abnormal DRE. All patients underwent 6–12-core biopsy using an 18-gauge needle with a spring-loaded biopsy gun (Bard Magnum). PV was calculated by measuring height (H), width (W), and length (L) of the prostate on TRUS and the formula would be: V= 0.52 x H x W x L. Collected data were further analyzed. Although this study was conducted in a single institution, we believe it is representative of Indonesian men because the samples are recruited from several provinces in Indonesia, since Cipto Mangunkusumo Hospital is a national referral hospital in Indonesia.
The study analysis was performed with SPSS version 20.0. We calculated the statistical analysis using Mann-Whitney test and unpaired t-test for the quantitative variables (age, PV, PSA and PSAD). In addition, Chi-square was used for statistical significance for qualitative variables. P <0.05 was considered as a significant result. Receiver operating characteristic (ROC) curve analysis was also conducted to determine the cut-off point and the optimum specificity and sensitivity for each variable.
A total of 1232 patients who underwent prostate biopsy were retrospectively analyzed. Among those patients, 413 patients had positive biopsy results (diagnosed with PCa) and 819 patients had negative biopsy result (diagnosed with benign prostate hyperplasia (BPH) or prostatitis). The characteristics of patients in this study can be viewed in Table 1.
Negative biopsy results were diagnosed as benign prostate hyperplasia and/or prostatitis while positive biopsy results were diagnosed as prostate adenocarcinoma.
| Variables | Total | Positive biopsy result | Negative biopsy result | P-value |
|---|---|---|---|---|
| Total patients, n (%) | 1232 | 413 (33.5) | 819 (66.5) | |
| Age (in years) | 1232 | 68 (35-89)# | 65 (40-83)# | <0.001 |
| PSA (ng/ml) | 1232 | 57.45 (0.8-7740)# | 11.69 (0.82-126.08)# | <0.001 |
| PV (ml) | 1232 | 42 (13.8-208)# | 55.4 (13.38-186)# | <0.001 |
| PSAD of PSA < 4 ng/ml (ng/ml/ml) | 24 | 0.06±0.05† | 0.07±0.03† | 0.368 |
| PSAD of PSA 4–10 ng/ml (ng/ml/ml) | 367 | 0.20 (0.08-0.64)# | 0.14 (0.04-0.39)# | <0.001 |
| PSAD of PSA 10–20 ng/ml (ng/ml/ml) | 339 | 0.35 (0.09-1.22)# | 0.24 (0.09-0.72)# | <0.001 |
| PSAD of PSA > 20 ng/ml (ng/ml/ml) | 502 | 2.05 (0.22-188.78)# | 0.53 (0.13-4.61)# | <0.001 |
Compared to the negative biopsy group, the positive biopsy group had lower median PV, while serum PSA level and age in positive biopsy group was higher than negative biopsy group (Table 1). The mean PSAD in positive biopsy result group was higher than negative biopsy results, except PSAD in patients with PSA <4 ng/ml (Table 1).
Bivariate analysis using the Mann-Whitney U-test showed that age (p <0.001), PSA (p <0.001), PV (p <0.001), and PSAD in patients with PSA 4–10 ng/ml (p <0.001), 10–20 ng/ml (p <0.001), and >20 ng/ml (p <0.001) group had statistical significance differences. However, PSAD in patients with PSA <4 ng/ml (p=0.368) showed no statistically significant difference using unpaired t-test.
According to the age groups, we classified them into three groups based on previous study9. As shown in Table 2, those aged >70 years (43.4%) had the highest detection rate. In addition, the positive biopsy rate in patients with PSA >20 ng/ml was 57.2 %. Prostate volume <60 ml had higher detection rate (41.8%) compared to PV >60 ml which only has 18.2% (Table 2).
Negative biopsy results were diagnosed as benign prostate hyperplasia and/or prostatitis while positive biopsy results were diagnosed as prostate adenocarcinoma.
The ROC curve demonstrated that PSAD was the best predictor factor among those variables (age, PSA, and PV) in TRUS-guided prostate biopsy (Figure 1 and Table 3). The area under the curve (AUC) for PSAD (84.5%) and PSA (78.7%), while the AUC for PV and age were 62.4% and 61.2%, respectively. PSAD and PSA were thus considered better predictors for identifying PCa than PV and age. This study also conducted ROC curve analysis for PSAD in stratified PSA level (Table 3).
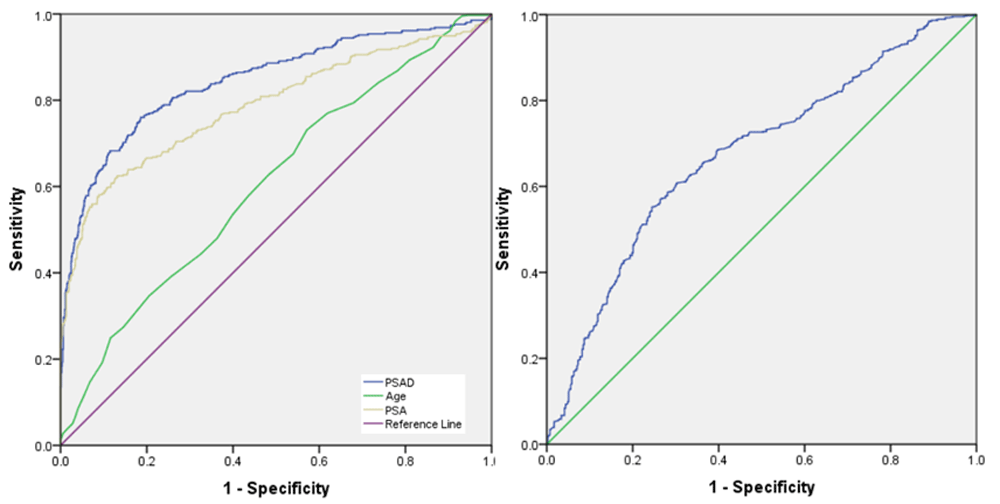
Receiver operating characteristic curve for (A) prostate-specific antigen (PSA), PSA density (PSAD), and age, and (B) prostate volume.
The optimal cut-off point of PSAD in the PSA group of 4–10 ng/ml was 0.17 ng/ml and its sensitivity and specificity were 75% and 66.5%, respectively. The cut-off point of PSA level was 32.5 ng/ml, giving a sensitivity and specificity for PSA of 62.0% and 87.1%, respectively. Prostate volume and age had lower optimum sensitivity and specificity compared to PSAD and PSA. (Table 3) This study divided PSAD variables into four groups based on PSA level (Table 3).
Rashid et al. stated that TRUS-guided biopsy is recommended as the procedure of choice for early detection of PCa. Even though the elevation of PSA and the presence of an abnormal DRE are associated with PCa, those kind of examinations are not appropriate as a standard predictor9.
In our study, 33.5% of the 1,232 patients examined had prostate cancer based on the biopsy result of histopathology examination. The overall detection rate (33.5%) of PCa in this study was much lower than in Pakistan (50.3%)10. Na et al. and Presti et al. also showed differences compared to earlier Chinese and American studies; they reported that the detection rates were 47% and 42%, respectively11,12.
The same results in positive biopsy rate are also found in other studies (Table 4). In Pakistan, Rashid et al. showed that 48.8% of patients performing TRUS guided biopsy were detected as PCa9. In India, Prakash et al. found that 35.2% of PCa were diagnosed from prostate biopsy13. Tang et al. in China revealed that 36.4% of patients were positive for PCa after performing prostate biopsy, but this study only investigated PSA levels ranging from 10–50 ng/ml14. Study from Germany had a lower detection rate than current study, at only 23.5%15. The low detection rate in this study could be caused by inadequate sampling. In larger prostate volumes, the possibility of error sampling is higher than in smaller prostate volume. Hence, the number of cores should be adjusted based on the prostate volume.
| Study | Country | Total patient | PSA level | Number of cores | Detection rate |
|---|---|---|---|---|---|
| Rashid R, et al. (2013)8 | Pakistan | 203 | All PSA level | 8 cores | 48.8% |
| Kash P, et al. (2014)9 | Pakistan | 300 | All PSA level | 8 cores | 50.3% |
| Na R, et al. (2012)10 | China | 1650 | All PSA level | ≥10 cores | 47% |
| Presti JC, et al. (2000)11 | USA | 202 | All PSA level | 6–10 cores | 42% |
| Prakash VS, et al. (2013)12 | India | 96 | All PSA level | 10–16 cores | 35.2% |
| Luboldt HJ, et al. (2001)14 | Germany | 1115 | All PSA level | < 6 and ≥6 cores | 23.5% |
| This study | Indonesia | 1232 | All PSA level | 6–12 cores | 33.5% |
In this study, the median age of PCa patients is 68 years old (range from 35–89 years) and those who were >70 years had the highest positive biopsy rate. This result is supported by other studies in Indonesia and Pakistan2,10,16. Umbas et al. revealed that patients with PCa in Indonesia were predominantly those >70 years during 1995–20042. In addition, Ariani et al. also reported that the overall age of the PCa patients in their study was 67.12 years16. The previous two studies mentioned that the rate in Indonesia was not significantly different compared to studies conducted in Nepal Senegal, Pakistan and Taiwan (63.6, 65.5, 65.7, and 67.7 years, respectively)9,17–19. However, other studies from China (Na et al. and Wu et al.) showed a slightly higher overall age compared to the current study, with mean ages of 71.24 and 73.4 years, respectively11,20. In addition, the mean age of a group in Korea was found to be lower (63.8 years old) than that in the current study, but its result cannot be compared because the study use tPSA level less than 10 ng/ml21.
Age is one of many risk factors affecting PCa because the incidence of the disease increases along with aging. Prostate cancer is mostly (in about 75% of cases) diagnosed after 65 years of age. There only 2% of all PCa cases were diagnosed in males <50 years19.
The highest positive biopsy rate in PSA group within this study belongs to patients with PSA values >20 ng/ml. This result suggests that severe elevation of PSA will increase the probability of PCa. Prakash et al. and Rashid et al. showed that 73.8–74.6% of patients with PSA >20 ng/ml that underwent TRUS-guided biopsy were diagnosed with PCa10,13. Another study by Barakazi et al. revealed a similar result to the current study22.
This study shows that patients with PSA level 4–10 ng/ml and 10–20 ng/ml had lower detection rate compared to those with PSA level below 4 ng/ml. Prakash et al. also generated similar results to those of our study, showing that PCa in patients with PSA level <4 ng/ml was could be detected more easily compared to patients with PSA levels of 4–10 ng/ml and 10–20 ng/ml, with the addition of DRE examination13. These results suggested that DRE may still have an important role in assisting or predicting PCa in suspicious patients23. Previous studies conducted in Taiwan and The Netherlands also revealed that DRE is an independent predictor of PCa19,24.
In this study, the lowest detection rate of PCa is in those with a PSA level of 4–10 ng/ml. Therefore, PSA alone is not an effective screening method to diagnose PCa. PSA level alone could cause the high rate of false positive or negative biopsy rate in patients that underwent TRUS-guided prostate biopsy. PSA is a protein produced by the prostatic epithelium. It is organ-specific, but not cancer-specific. PSA can be manipulated by other disorders of the prostate, such as prostatitis, urinary retention, and BPH. Research into a large population regarding PSA screening in ERSPC revealed that PSA screening was able to reduce a number of 20% mortality in patients with PCa. Another study reported that PSA had no benefit in reducing mortality in PCa. PSA alone is not optimal to determine the risk of PCa11. Other factors such as DRE, TRUS to asses PV, and PSAD must be considered when performing prostate biopsy24.
The role of PV as a predictor factor is still being debated. In this study, the mean PV in patients with PCa is much lower than in those with negative biopsy results. A previous study in Indonesia conducted by Ariani et al. produced the same result as our study16. The study revealed that the incidence of PCa increased with decreasing PV16. Wu et al. reported that lower PV was able to indicate a higher risk of PCa detection20. Tang et al. reported that decreasing PV was associated with higher risk of PCa in patient undergoing TRUS biopsy14. The high rate of negative biopsies resulting due to larger PV might be due to more sampling errors in TRUS biopsy. Therefore, assessing more cores from larger prostates could increase detection rate and reduce bias5,14,25. Pietzak et al. revealed that patients with larger PV (50 ml) who had prior negative biopsy require multiple biopsies to increase the chance of gaining a positive biopsy26.
This study revealed that PSAD had the best predictor in detecting PCa. A study from China showed a similar ROC cut-off point (0.2 ng/ml/ml) and AUC (0.664) in intermediate PSA level (4–10 ng/ml) to this study27. The previous study in Indonesia also reported that the optimum cut-off point was 0.19 in patients with an intermediate PSA level28. The cut-off point of PSAD is similar in our study and is higher compared to the reference values of Western countries (0.15 ng/ml/ml) for prostate biopsy29. This examination could be used to reduce unnecessary biopsy because the specificity of PSAD was much higher than specificity of PSA level 4 ng/ml (as indicated for prostate biopsy) in this study.
The limitation of our study is that the TRUS-guided biopsy is of limited value. It can only show small number of malignancies. The use of contrast agent combined with TRUS-guided prostate biopsy can increase the accuracy of prostate cancer diagnosis29. We also noticed that according to Prakash et al., the number of core biopsies have to be increased up to 16 cores in order to significantly increase the rate of prostate cancer detection13.
Another limitation of this study is that it is a retrospective study conducted in a single institution. In this study, PSA level was not defined adequately, therefore the cut-off point and mean variables were difficult to obtain. Although this study is conducted in a single institution, it can represent the races from Indonesian men because the samples are recruited from several provinces in Indonesia.
In conclusion, the overall detection rate of PCa by biopsy in our study is 33.5%, much lower than other countries in Asia. The incidence of PCa increased with higher PSA level, older age and lower PV. Utilization of PSAD 0.17 ng/ml/ml as a cut-off point in patients with PSA level between 4–10 ng/ml is recommended to improve PCa detection in Indonesian men.
Harvard Dataverse Repository: Final Data Biopsy RSCM 2008–2013. https://doi.org/10.7910/DVN/JNNECM30.
| Views | Downloads | |
|---|---|---|
| F1000Research | - | - |
|
PubMed Central
Data from PMC are received and updated monthly.
|
- | - |
Provide sufficient details of any financial or non-financial competing interests to enable users to assess whether your comments might lead a reasonable person to question your impartiality. Consider the following examples, but note that this is not an exhaustive list:
Sign up for content alerts and receive a weekly or monthly email with all newly published articles
Already registered? Sign in
The email address should be the one you originally registered with F1000.
You registered with F1000 via Google, so we cannot reset your password.
To sign in, please click here.
If you still need help with your Google account password, please click here.
You registered with F1000 via Facebook, so we cannot reset your password.
To sign in, please click here.
If you still need help with your Facebook account password, please click here.
If your email address is registered with us, we will email you instructions to reset your password.
If you think you should have received this email but it has not arrived, please check your spam filters and/or contact for further assistance.
Comments on this article Comments (0)