Keywords
HIV, qPCR, quantification, maxRatio, viral load.
This article is included in the Pathogens gateway.
HIV, qPCR, quantification, maxRatio, viral load.
1. We re-arranged the acronyms in the paper to make the labelling clearer, specifically by clarifying the use of internal control (IC) in the method section.
2. We corrected a wrong proportion to 45.5%.
3. We encountered no issues in downloading fully functional comma-separated files. We recommend using the "original file format" option provided by Harvard Dataverse when downloading the datasets. We added a dictionary file explaining the fields' names used in the datasets associated with the present work.
See the authors' detailed response to the review by Joel Tellinghuisen
Infection with HIV-1 accounts for a global prevalence of 38 million cases and a one million deaths yearly1. An accurate viral load (VL), typically carried out by quantitative polymerase chain reaction (qPCR), is pivotal for addressing the efficacy of antiviral therapies2. The threshold level of detection for the HIV-1 VL has been reported in the range 20–44 viral genomic copies per milliliter (c/mL)3,4.
qPCR data are usually analyzed by the fit-point (FP) method, which assumes equal amplification efficiency between samples5. However, anomalies in the background fluorescence at low template input, can affect the quantification6–8. An alternative method, maxRatio, was introduced to overcome these issues9. It has been reported that maxRatio conferred a marginal increase in assay accuracy over FP10,11.
FP provides only a quantification cycle (Cq) value, which is then used to calculate VL. MaxRatio, instead, gives two parameters: one associated with the reaction’s efficiency (MR) and one equivalent to, albeit distinct from, Cq. These two parameters can be linked to bestow a quantitative cycle (FCNA) compensated for inhibition.
In the present work, we aimed to determine whether maxRatio could improve the determination of HIV-1 VL. We compared the quantification of HIV-1 VL computed by FP and maxRatio on a dataset generated with the QIAgen artus HIV assay, which has a reported limit of detection of 35.5 c/mL, and we showed that maxRatio could pinpoint samples with abnormal amplification profiles.
The amplification data (see Underlying data12) obtained with the QIAgen artus HI Virus-1 RT-PCR kit were collected by the Public Health England Clinical Microbiology and Public Health Laboratory, Addenbrooke’s Hospital, Hills Road, Cambridge CB2 0QW, UK, during the year 2016. All data were anonymized before use. The reactions were subdivided into clinical samples, control dilutions (CDs), and non-template controls (NTCs). The CDs were based on known dilutions of in vitro transcribed HIV-1 RNA provided by the artus kit, corresponding to 405, 4,050, 40,500, and 405,000 c/mL. Each reaction also contained a primer set targeting an internal control (IC) to assess the proper extraction of the samples.
The FP method generated the Cq by registering the fractional cycle where the fluorescence passed the threshold of 0.2 units. The maxRatio transform of the amplification data and determination of the cut-offs were computed as previously described9,10. Different operators visually inspected the reaction’s profiles and classified each reaction as either passed or failed. Using R v.3.6, linear models (standard curves, SC) were built on the CDs and applied to calculate the copy numbers according to the formula 10(x – b)/m where x is the quantitative cycle (either Cq or FCNA), b and m are the intercept and slope, respectively, of the linear models13. Testing the difference between the expected and the calculated copy numbers was carried out with an unpaired t-test. VL correlation was obtained with the Pearson product-moment coefficient ρ14 and agreement between methods was tested with the Cohen’s κ15; both are reported with their 95% confidence interval (CI).
The present dataset was derived from 122 individual artus HIV-1 runs, corresponding to 2,544 reactions (480 CDs, 122 NTCs and 1,931 clinical samples). The cut-offs obtained by expectation-maximization analysis were multiplied by 2.7 to generate the values used to filter the maxRatio data, as depicted in Figure 1.
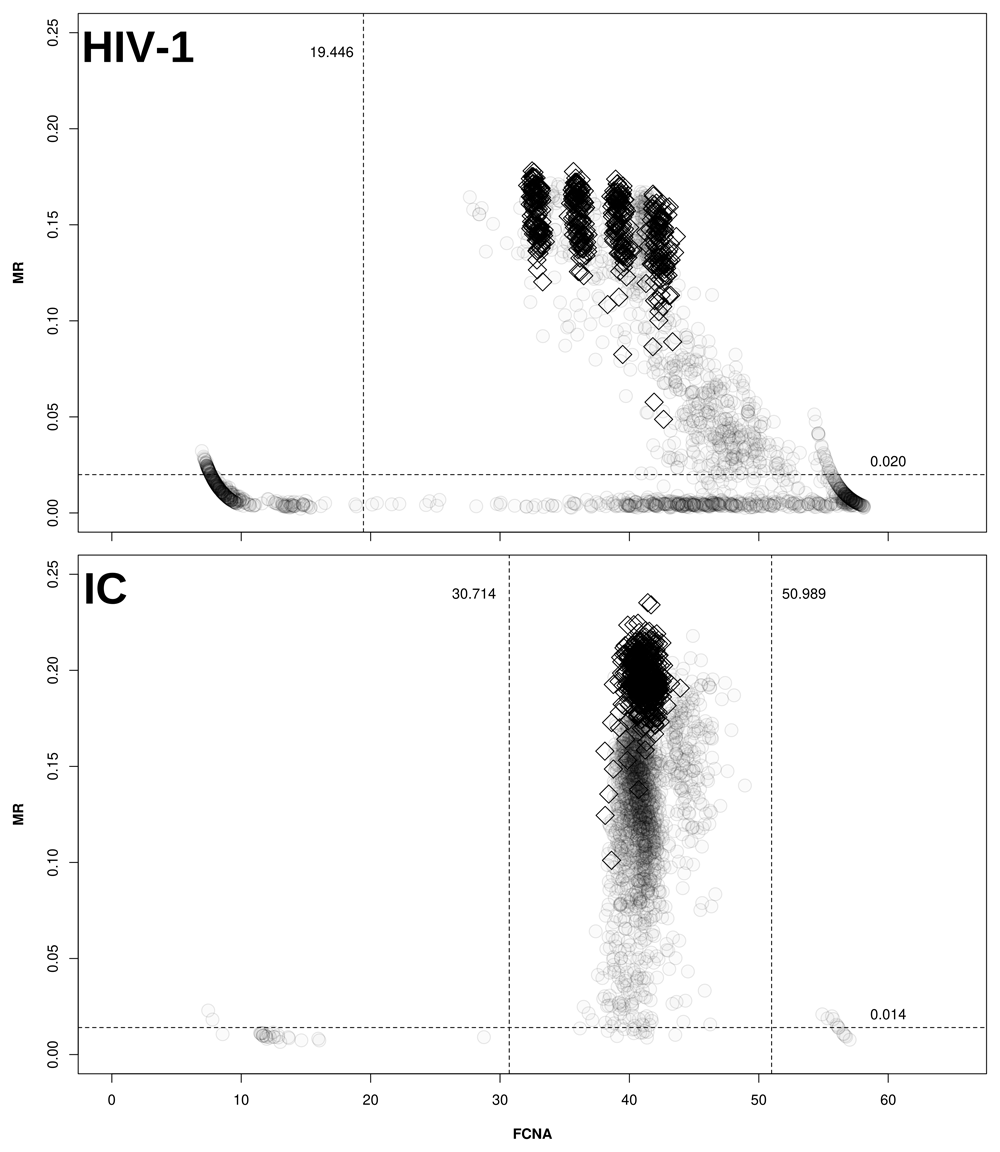
Clinical samples (○) and CDs (◊) are plotted on the maxRatio plane; the numbers report the obtained cut-offs for MR (horizontal lines) and FCNA (vertical lines). Upper panel: MR/FCNA pairs for the HIV-1 target. To note how the CDs form four distinct clusters, corresponding to the different standard dilutions. Lower panel: MR/FCNA pairs for the IC target. To note that the data form a single cloud because the IC input was virtually the same for all reactions. The presence of two outlier groups at low and high FCNA values required to instantiate two cut-offs.
The CDs were used to build SCs (Figure 2) that quantified both the CDs (Table 1 and Figure 3) and the clinical samples (Figure 4). Overall, the VLs obtained with the two methods were very strongly correlated (ρ = 0.994, 95% CI: 0.993-0.994) and the agreement in the stratification of the reactions into reactive and non-reactive was noticeably robust (κ = 0.885, 95% CI: 0.863-0.907). Both methods identified 307 (15.9%) and 28 (1.5%) samples within and above the quantification range 405–405,000 c/mL (ρ = 0.988, 95% CI: 0.985-0.991 and ρ = 0.992, 95% CI: 0.982-0.996, respectively), and 1,571 (81.3%) below this range (ρ = 0.844, 95% CI: 0.829-0.858).
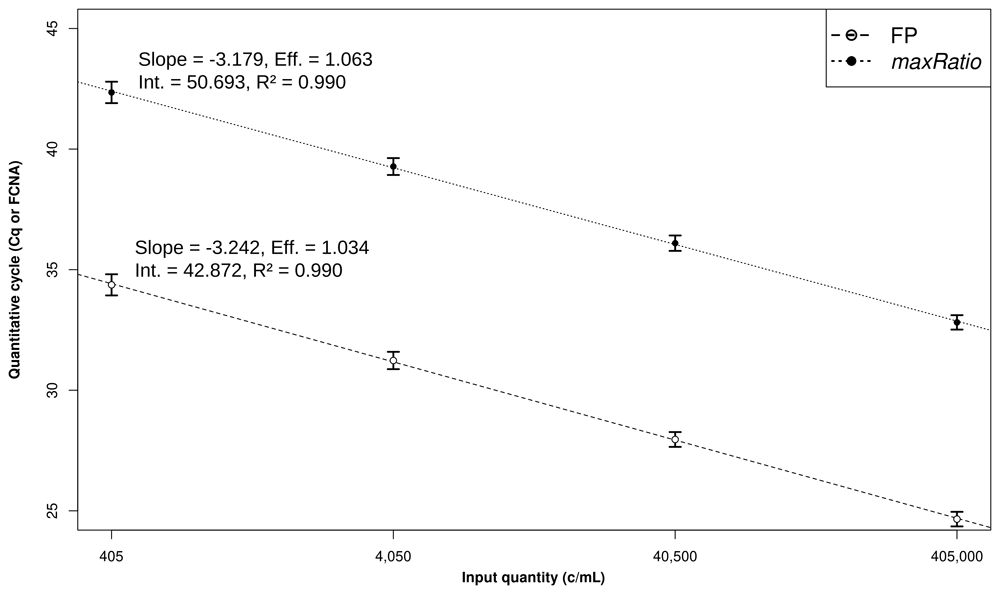
Development of the linear models. The Cq (○) and FCNA (●) were used to build SCs for FP (dashed line) and maxRatio (dotted line). The dots and bars represent the mean and standard deviation of the data, respectively. The characteristics of the models are reported.
The mean VL is reported together with the 95% CI (calculated), the difference between the calculated and the expected concentration (difference), and the result of the t-test (p-value). Statistical significance is represented by * and ** for values below 0.05 and 0.01, respectively. The copy numbers are given in c/mL.
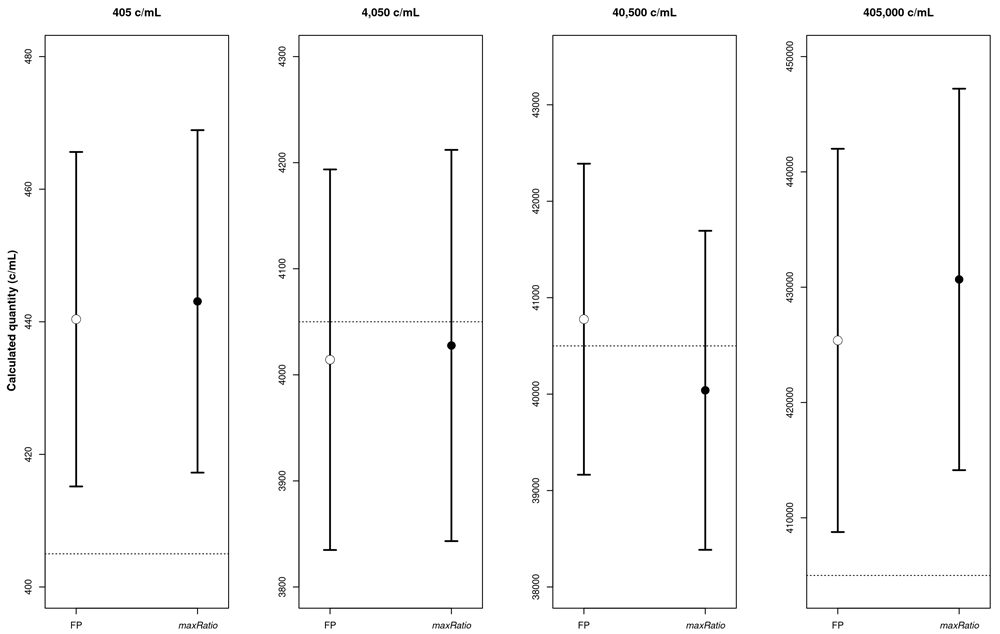
The four panels represent the calculated copy numbers obtained using FP (○) or maxRatio (●) for each dilution. The dots and bars represent the mean and the 95% CI of the data, respectively.
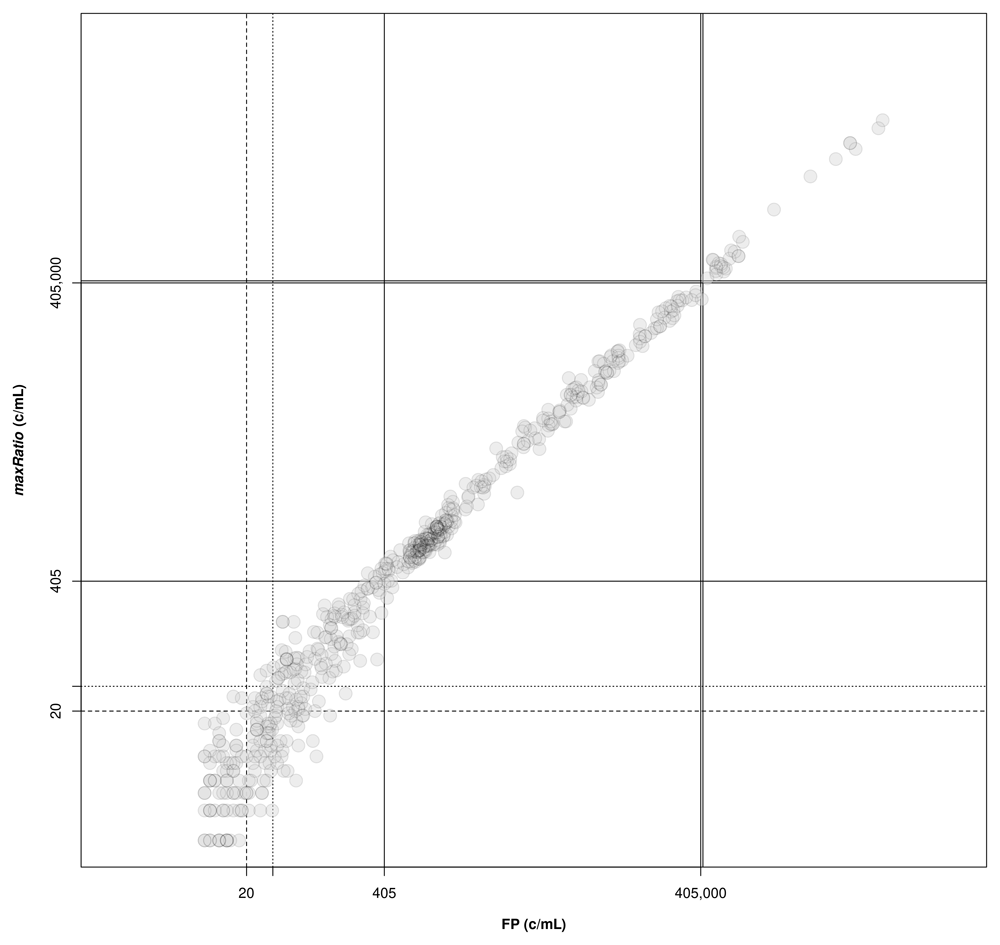
The external standard curves were used to calculate the VL for the clinical samples. The following thresholds are depicted: lower (solid lines) and upper (double solid lines) limits of the quantification range; limit of detection of HIV-1 diagnostic in general (dashed line) and artus HI Virus-1 assay in particular (dotted line).
FP quantified 22 reactions below the detection limit of 20 c/mL that were interpreted as non-reactive by maxRatio. Conversely, maxRatio identified 18 reactions below 20 c/mL while FP quantified them above this level. Visual inspection of the amplification profiles of the reactions failed by FP showed that 10 of them (45.5%) had a proper sigmoid shape for the IC signal that, however, was discarded by the FP (as exemplified in Figure. 5A). In contrast, the others had a low signal for either HIV-1 or IC recovered by maxRatio (Figure 5B). Conversely, 15 (83.3%) of the reactions failed by maxRatio showed either a low IC or HIV-1 input (Figure 6A), whereas the FCNA of the remaining reactions produced fractional VL that were rounded to 0 c/mL (Figure 6B).
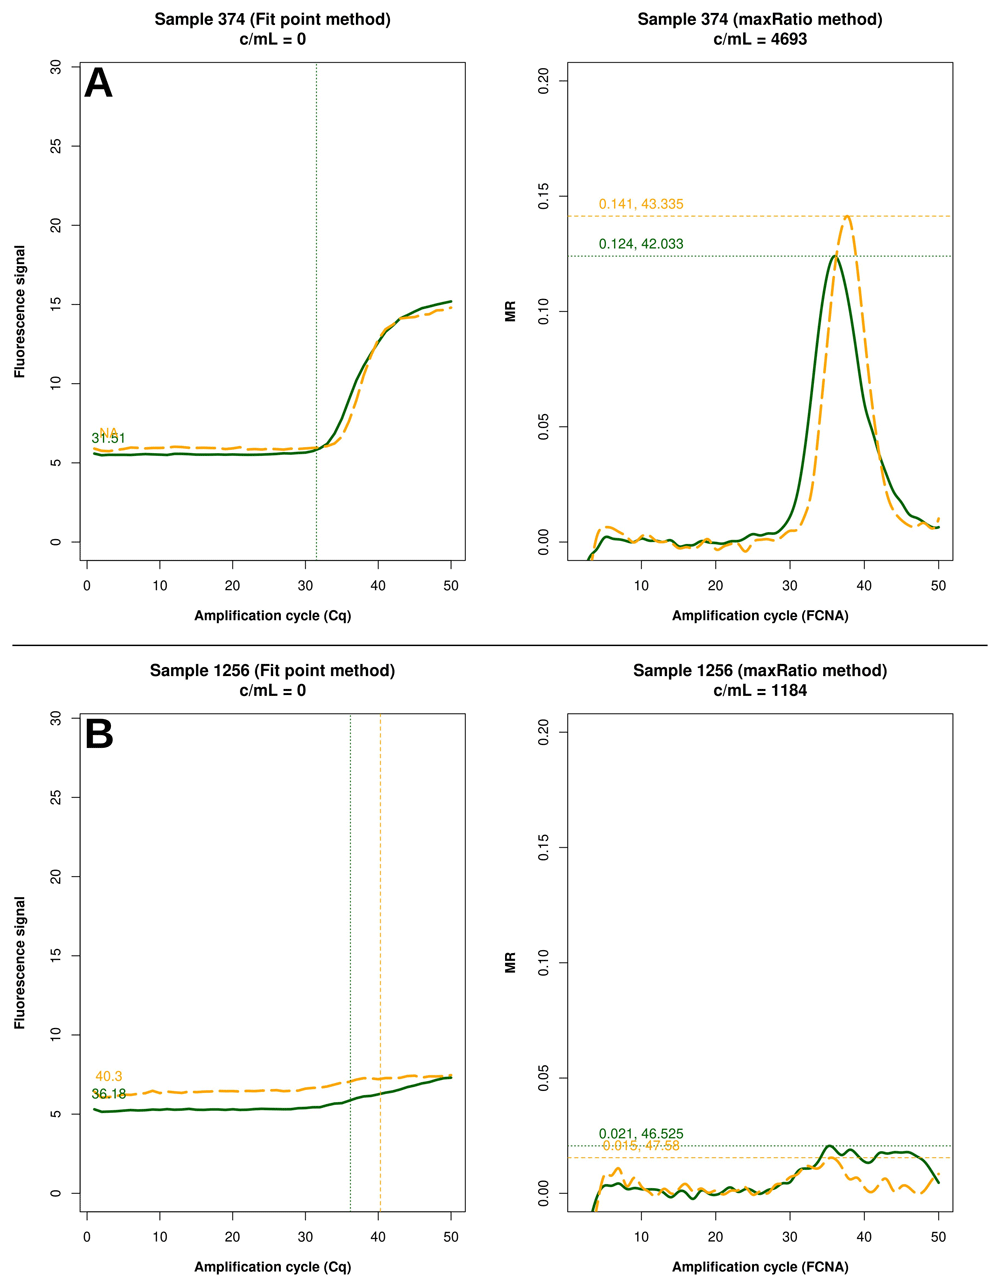
Example of raw amplification profiles for the samples whose FP did not provide a VL. The panels display the FP (left) the maxRatio (right) transforms of the amplification data. The solid line represents the HIV-1 template and the dashed line the IC template. (A) The majority of the samples had a proper IC profile but the output was undetermined. (B) The minority of the samples showed low target inputs.
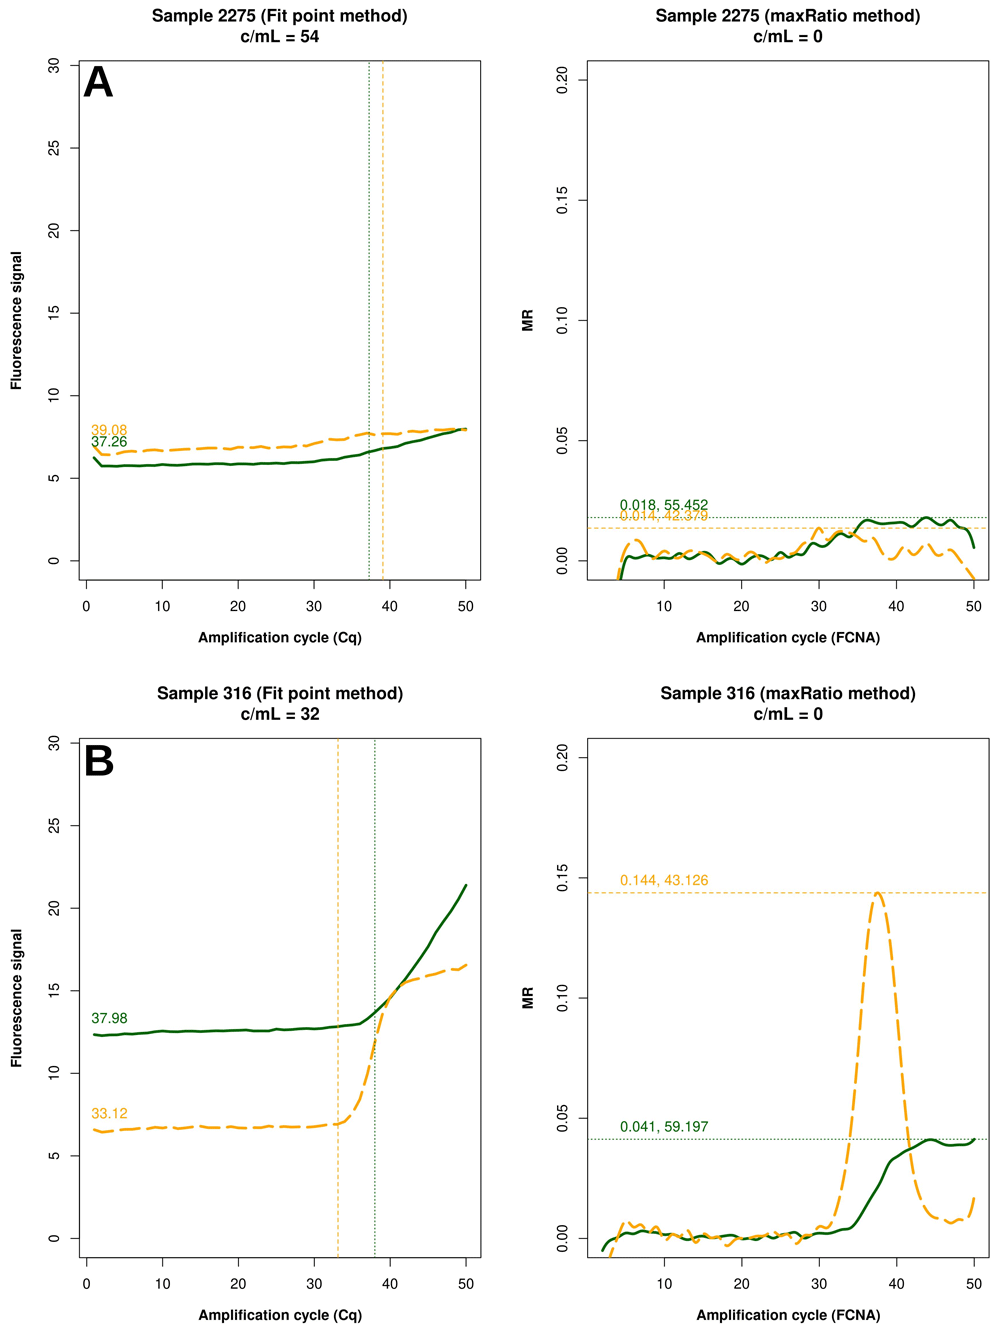
Example of raw amplification profiles for the samples whose maxRatio did not provide a VL. The panels display the FP (left) the maxRatio (right) transforms of the amplification data. The solid line represents the HIV-1 template and the dashed line the IC template. (A) The majority of the samples had abnormal IC profiles that were overlooked by FP. (B) The minority of the samples showed proper amplification profiles, but the calculation provided fractional VLs that were rounded to zero.
The purpose of the present work was to assess the potential benefits of maxRatio in determining HIV-1 VL given its inherent compensation of PCR inhibition. Contrary to our expectation, the SCs we built with either FP or maxRatio were virtually the same. Both methods gave VLs significantly divergent from the expected copy numbers at the lower and upper CDs, and maxRatio was, in general, more discrepant from the expected copy numbers than FP. Even concerning the samples’ quantification, the two methods produced essentially the same VLs.
The main difference between the two methods was in terms of sample’s reactivity. By accepting the reactions identified as non-reactive by FP, but reactive by maxRatio, there would have been 18 false-negative results. Conversely, 15 samples identified as non-reactive by maxRatio showed aberrant IC that raised quality control, rather than false-positive, issues overlooked by FP.
The current use of maxRatio is to confirm the reactivity determined by FP on the Abbott m2000rt platform. Our data supported this combination as the most effective approach for screening purposes. Samples in disagreement between FP and maxRatio would require further assessment that could reduce the workload involved in issuing the results and minimize the risk of providing false results.
The present work had some limitations. Firstly, the sample size was small. Since the correlation between the two methods was high (99.4% overall and 84.4% below the quantification limit of 405 c/mL), a more extensive sample set would provide only a marginal improvement in comparing the two algorithms. However, more samples will provide more instances of amplification profiles that are processed differently by FP and maxRatio. In the present study, 40 reactions out of 1931 samples (2.07%) showed discrepancies in quantification at the clinical threshold of 20 c/mL. Expanding such a subset of discrepant reactions to, say, 4000 could provide a database of profiles that can facilitate (perhaps using machine learning approaches) identifying the characteristics that led to the failure in quantification. Moreover, analysis of qPCR chemistries other than artus HI virus-1 might determine whether such characteristics are common to all reactions or peculiar to the kit used herein. Secondly, the CDs were prepared by diluting the control samples provided in the kit, but the actual concentration was not measured. Finally, we did not have access to the actual issued results; thus, we could not confirm the official VL values.
In conclusion, we compared FP and maxRatio in providing HIV-1 VL. Contrary to our expectations, maxRatio did not give a better quantification than FP, but combining the two methods could minimize issuing false results.
Harvard Dataverse: artusHIV_amplificationData. https://doi.org/10.7910/DVN/0QQNPF
This project contains the following underlying data:
amplificationDataRaw.tab. (Raw amplification data, file is comma-delimited.)
viralLoads.tab. (Raw viral loads data, file is comma-delimited.)
dictionary.tab (explanation of the fields’ names used in the other files, file is comma-delimited.)
Data are available under the terms of the Creative Commons Zero "No rights reserved" data waiver (CC0 1.0 Public domain dedication).
We would like to thank Dr. Martin D. Curran (Public Health England, Clinical Microbiology and Public Health Laboratory, Addenbrooke's Hospital, Cambridge UK) for providing the amplification data.
We would also like to thank Prof. Clementina Elvezia Cocuzza (University of Milano Bicocca, Department of Medicine and Surgery, Monza, Italy) and Dr. Maria Serena Beato (‘Istituto Zooprofilattico Sperimentale delle Venezie’, Department of Diagnostics in Animal Health, Legnaro, Italy) for their moral support.
| Views | Downloads | |
|---|---|---|
| F1000Research | - | - |
|
PubMed Central
Data from PMC are received and updated monthly.
|
- | - |
Competing Interests: No competing interests were disclosed.
Competing Interests: No competing interests were disclosed.
Reviewer Expertise: Oncology, cellular and molecular biology
Is the work clearly and accurately presented and does it cite the current literature?
Partly
Is the study design appropriate and is the work technically sound?
Partly
Are sufficient details of methods and analysis provided to allow replication by others?
No
If applicable, is the statistical analysis and its interpretation appropriate?
Partly
Are all the source data underlying the results available to ensure full reproducibility?
No
Are the conclusions drawn adequately supported by the results?
Partly
References
1. Tellinghuisen J, Spiess AN: qPCR data analysis: Better results through iconoclasm.Biomol Detect Quantif. 2019; 17: 100084 PubMed Abstract | Publisher Full TextCompeting Interests: No competing interests were disclosed.
Reviewer Expertise: statistical data analysis
Competing Interests: No competing interests were disclosed.
Reviewer Expertise: Oncology, cellular and molecular biology
Is the work clearly and accurately presented and does it cite the current literature?
Yes
Is the study design appropriate and is the work technically sound?
Yes
Are sufficient details of methods and analysis provided to allow replication by others?
Yes
If applicable, is the statistical analysis and its interpretation appropriate?
Yes
Are all the source data underlying the results available to ensure full reproducibility?
Yes
Are the conclusions drawn adequately supported by the results?
Yes
Competing Interests: No competing interests were disclosed.
Reviewer Expertise: Oncology, cellular and molecular biology
Alongside their report, reviewers assign a status to the article:
| Invited Reviewers | ||
|---|---|---|
| 1 | 2 | |
|
Version 3 (revision) 31 Aug 21 |
read | read |
|
Version 2 (revision) 29 Jun 21 |
read | read |
|
Version 1 24 Aug 20 |
read | |
Provide sufficient details of any financial or non-financial competing interests to enable users to assess whether your comments might lead a reasonable person to question your impartiality. Consider the following examples, but note that this is not an exhaustive list:
Sign up for content alerts and receive a weekly or monthly email with all newly published articles
Already registered? Sign in
The email address should be the one you originally registered with F1000.
You registered with F1000 via Google, so we cannot reset your password.
To sign in, please click here.
If you still need help with your Google account password, please click here.
You registered with F1000 via Facebook, so we cannot reset your password.
To sign in, please click here.
If you still need help with your Facebook account password, please click here.
If your email address is registered with us, we will email you instructions to reset your password.
If you think you should have received this email but it has not arrived, please check your spam filters and/or contact for further assistance.
Comments on this article Comments (0)