Keywords
COVID-19, Mask orders, Local government, Cities, Counties
This article is included in the Emerging Diseases and Outbreaks gateway.
This article is included in the Coronavirus (COVID-19) collection.
COVID-19, Mask orders, Local government, Cities, Counties
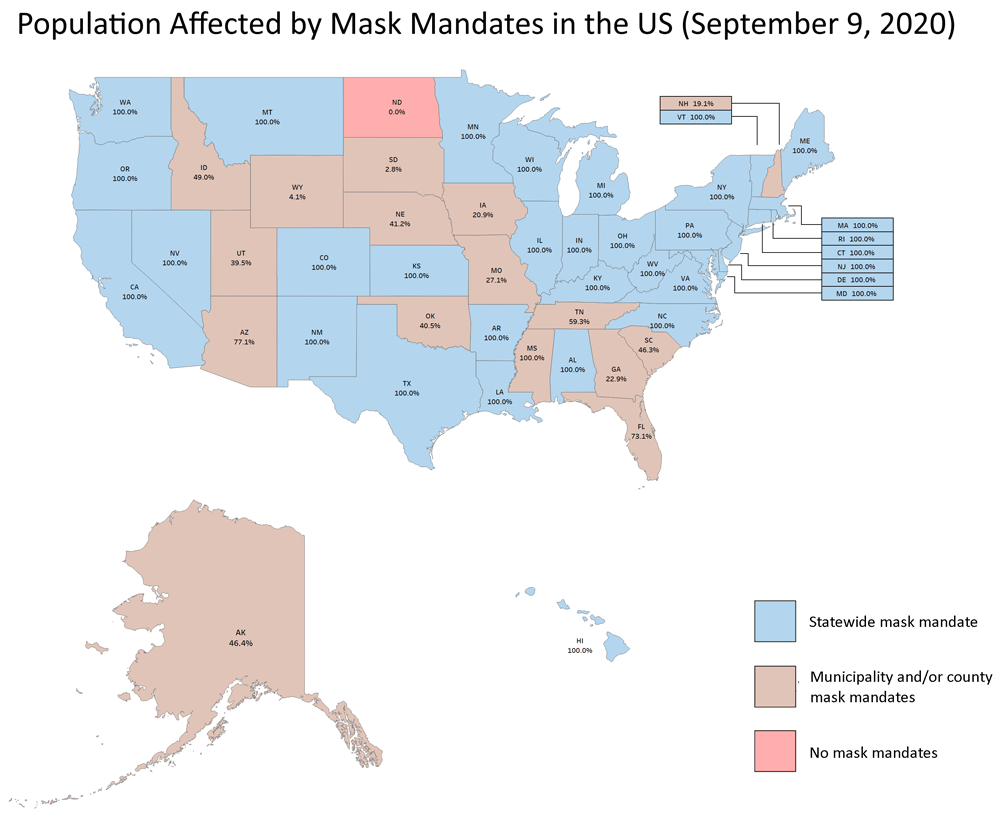
By August 9, 2020, governors in 35 US states had issued statewide mandates for persons to wear COVID-19 protective face masks1. These mandates ensured that the entire state populations were covered, although population adherences to the mandates were not complete1. In 15 of the remaining 16 states, until September 9, some local governments (county or municipal) had also issued mandates for persons to wear masks. Mask wearing in public has become a bulwark against COVID-19, and it is desirable to determine the population proportions in the states that are only covered by local ordinances. We present a dataset that provides this information.
Starting with the 14 states with only local mandates (see Figure 1), we searched for lists of counties and towns or cities that introduced mask orders effective September 9 or earlier. We conducted a Google search for each state with the combined terms “State name” (e.g., Florida), “COVID-19”, “mask” or “face mask”, and “county order” or “city order,” Usually, we found at least one article with a mention of counties or cities with face masks. In some states the list was large; in those states we searched for internet articles with complete lists; we found lists for Arizonaa, Floridab, South Carolinac, Tennesseed, and Wisconsine. We then searched Google for newspaper or broadcast sites that covered the mask order for each county or city using “State name” (e.g., South Carolina), “city name” (e.g.,” Columbia”), or “county name” (e.g., “Richland County”), “COVID-19”, and “mask order”. We also searched for the ordinances on the city, town, or county government web pages.
The number of mandates ordered by separate city or county governments in each of 14 states which did not have a central mandate. Blue indicates cities ordering a mandate, brown indicates counties and black indicates a tribal council.
We collected the following data: the state and city or county name; the date each order became effective; the 2019 population of each relevant city or town2 and county3. We used these populations as estimates of the number of people in each area who were under mask orders. If both city or town and county had issued mask orders, we used only the county population as our measure of the number of people covered.
In the accompanying Excel file (Underlying data), in the column ‘NAME’ we list the counties, cities and towns with mask orders. We identify cities or towns with an “M” (municipality) and counties with a “C.” We also show the date that each order came into effect. We embed the internet address of the related newspaper or broadcast article in the “Date in effect” column. We also record the population of each city, county and state. If both a city and its county had a mask order, we used the county population as our indicator of coverage. We recorded the city population in a separate column.
Data on the number of ordinances for cities and counties in each relevant state is shown in Figure 2. Counties took the initiative in Wyoming, Nebraska, Utah, and Tennessee. In states with more orders, including Arizona, South Carolina and Florida, cities took the initiative. In Arizona there was also an order from a Tribal Council. In Figure 1, we show the country map, identifying states with statewide orders (blue), local government only orders (brown), and no orders (light red). In this figure, we also present the percent of each state’s population that was covered by mask orders. For the states with statewide orders, coverage is complete (100%). One state, North Dakota, did not have any orders up until our cutoff date of September 9 (in South Dakota, one city, Brookings, enacted an order on September 9). In Figure 3, we show the ranking of states by percent population covered, for states with only local mandates.

The figure shows the percent of each state’s population that was under a local or statewide mask order by September 9, 2020.
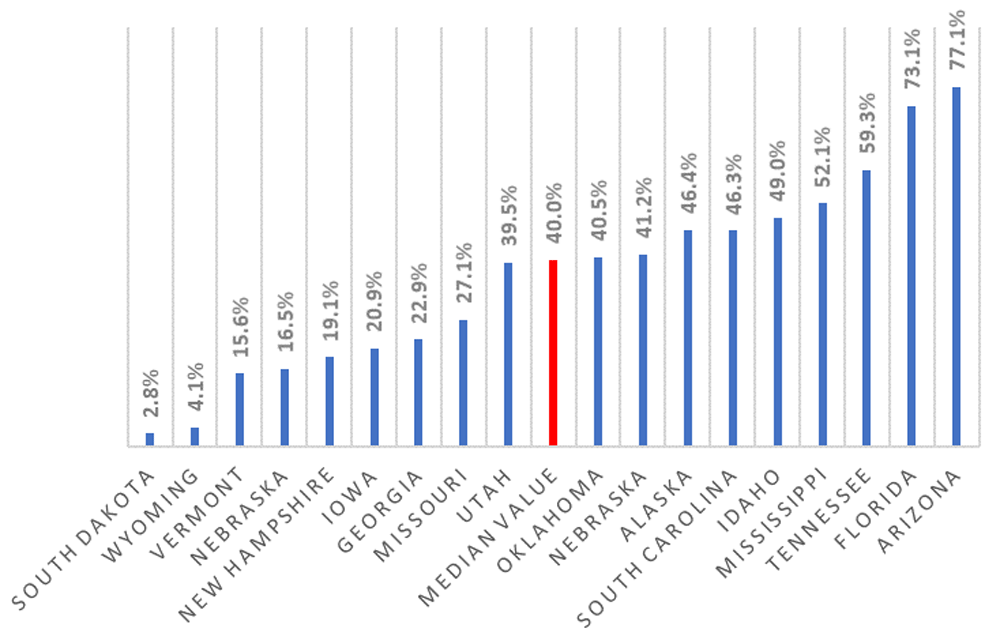
The average coverage for all 14 states, which have only local coverage, is 37.5%.
Our dataset shows the population coverage for mask mandates in states where local governments took policy initiatives. Coverage in these states varied widely and is an important component of any analysis of COVID-19 prevention policies.
There is little nationwide information available on the degree of coverage in states with local mandates. There is no central body that collects and organizes this data and makes it publicly available. This dataset addresses that deficiency. However, there are limitations in collecting this information. Firstly, mask order enactment dates keep changing and local governments keep adding or terminating enactments as the local COVID-19 situation changes. Secondly, news bureaus do not always provide the current situation. Finally, data on county and city orders are not always kept in a central place for public information.
University of Alberta Library Dataverse: Mask Orders: Local Government, https://doi.org/10.7939/DVN/A9C1UU4.
Database contains detailed collected data for 15 states with local orders and more general data for 34 states with statewide orders:
Data are available under the terms of the Creative Commons Zero "No rights reserved" data waiver (CC0 1.0 Public domain dedication).
c Sources: https://ktar.com/story/3298944/heres-where-arizona-cities-stand-on-requiring-face-masks/; https://www.fox6now.com/news/list-wisconsin-cities-with-mask-mandates
d Source: https://www.thestate.com/news/coronavirus/article244628692.html
e Source: https://www.wistv.com/2020/07/08/full-list-face-mask-ordinances-place-across-sc/
| Views | Downloads | |
|---|---|---|
| F1000Research | - | - |
|
PubMed Central
Data from PMC are received and updated monthly.
|
- | - |
Provide sufficient details of any financial or non-financial competing interests to enable users to assess whether your comments might lead a reasonable person to question your impartiality. Consider the following examples, but note that this is not an exhaustive list:
Sign up for content alerts and receive a weekly or monthly email with all newly published articles
Already registered? Sign in
The email address should be the one you originally registered with F1000.
You registered with F1000 via Google, so we cannot reset your password.
To sign in, please click here.
If you still need help with your Google account password, please click here.
You registered with F1000 via Facebook, so we cannot reset your password.
To sign in, please click here.
If you still need help with your Facebook account password, please click here.
If your email address is registered with us, we will email you instructions to reset your password.
If you think you should have received this email but it has not arrived, please check your spam filters and/or contact for further assistance.
Comments on this article Comments (0)