Keywords
Health and Economic Development, Health Behavior, Government Policy, Regulation, Public Health
This article is included in the Agriculture, Food and Nutrition gateway.
Health and Economic Development, Health Behavior, Government Policy, Regulation, Public Health
The prevalence rate of obesity and overweight is high in the Eastern Mediterranean Region (EMR). More than half of the adult women (50.1%) and more than 40% of men are obese or overweight in the EMR. Around 7% of under-five aged children in are overweight, which is greater than the global average rate of 6.2% (WHO, 2016a). Furthermore, the rate is even higher for children living in Gulf Cooperation Council (GCC) countries (Abdul-Rasoul, 2012). Obesity in children increases the risk of experiencing difficulties in breathing and mental health issues and is an early cardiovascular disease marker (Pizzi & Vroman, 2013; WHO, 2016a). Moreover, obese children can be highly affected concerning their educational attainments and quality of life. In addition, obesity in childhood is related to a high risk of obesity in adulthood, diabetes, and cardiovascular diseases (WHO, 2016c). There is a correlation between the high prevalence rates of overweight and obesity with the high prevalence rates of diabetes (World Health Statistics, 2016). Figure 1–Figure 3 show the increase of obesity, overweight, and deaths due to diabetes in the GCC from 2010 to 2016.
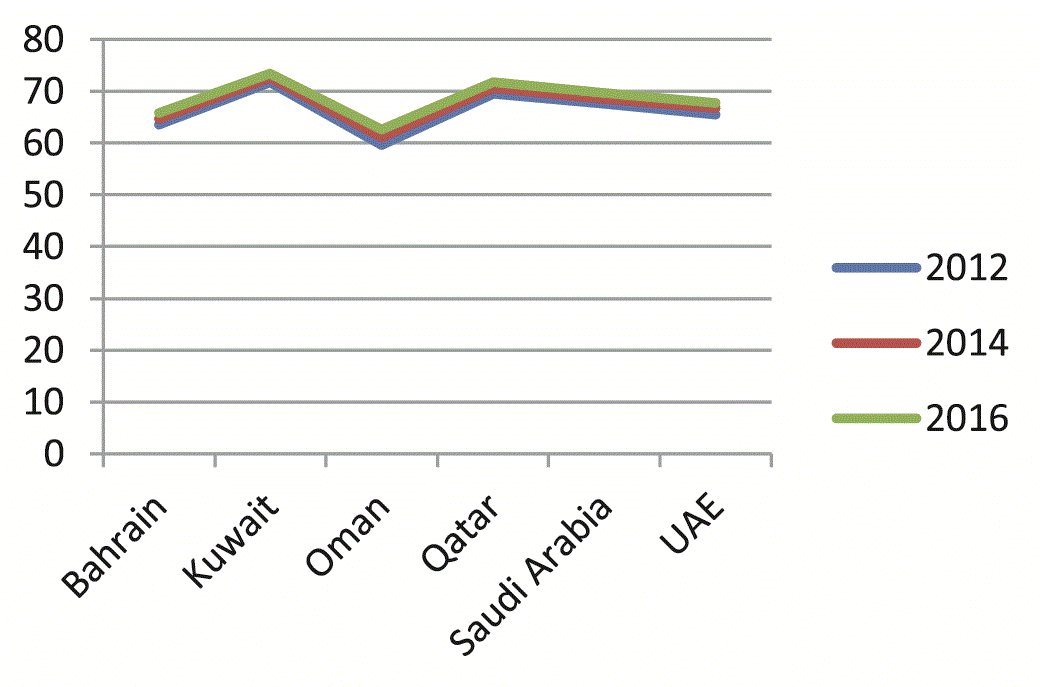
Source: World Health Organization (http://apps.who.int/gho/data/view.main.CTRY2430A; http://apps.who.int/gho/data/view.main.CTRY2450A?lang=en; http://apps.who.int/gho/data/view.main.2464ESTSTANDARD; http://apps.who.int/gho/data/view.main.NCDRGLUCAv).
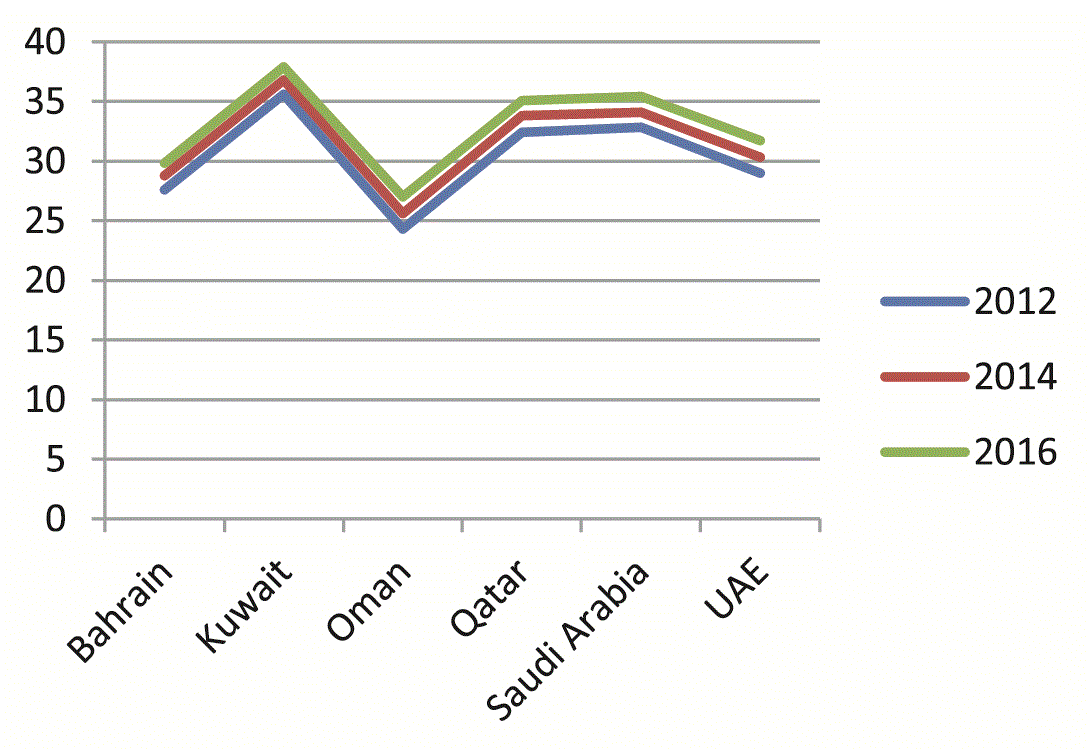
Source: World Health Organization (http://apps.who.int/gho/data/view.main.CTRY2430A; http://apps.who.int/gho/data/view.main.CTRY2450A?lang=en; http://apps.who.int/gho/data/view.main.2464ESTSTANDARD; http://apps.who.int/gho/data/view.main.NCDRGLUCAv
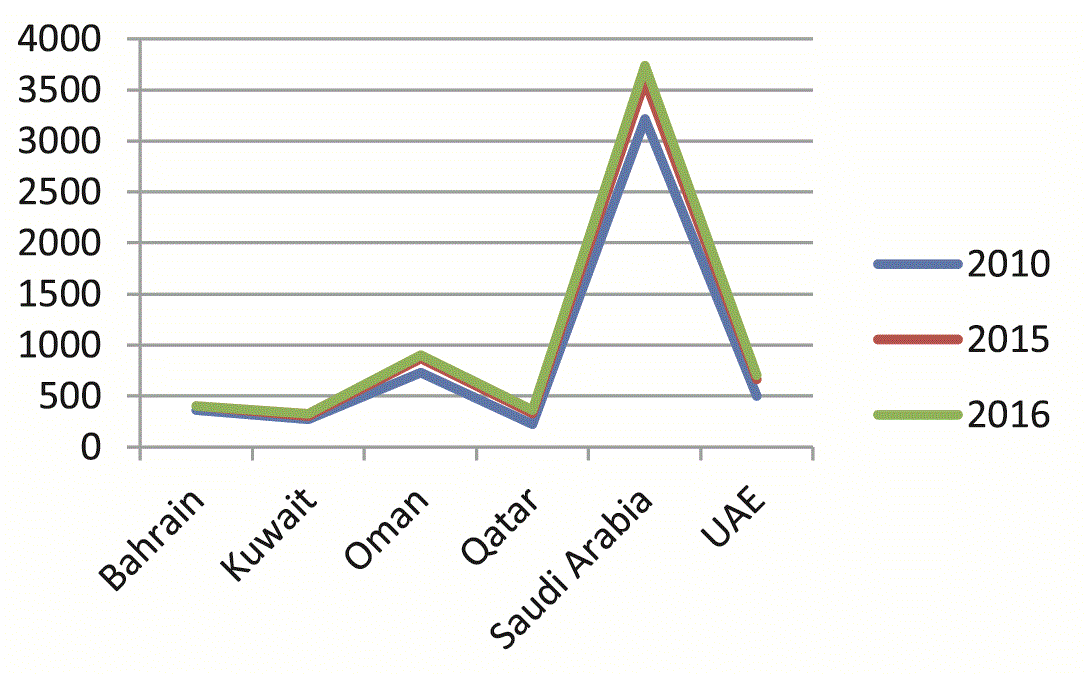
Source: World Health Organization (http://apps.who.int/gho/data/view.main.NCDDEATHCAUSESNUMBERv).
Accordingly, GCC countries have imposed policies that aim to decrease obesity, overweight, and diabetes rates. Such policies are part of an operational policy for diabetes that has been implemented in all GCC countries, except Oman, and an operational policy to reduce unhealthy diet related to non-communicable diseases (NCDs), which were imposed in 2017 in all GCC countries (WHO, 2016b). One of the most important policies that have been implemented is sin taxes on sugar-sweetened beverages (SSB), which aims to reduce significant increases in the prevalence rates of obesity and overweight that have drawbacks on health and whole economy in the short and long-run. Saudi Arabia was the pioneer in implementing the sin tax policy, followed by United Arab Emirates (UAE) (these two countries implemented sin taxes on SSB in 2017), followed by Bahrain also in 2017. Oman and Qatar proceeded with the implementation at the beginning of 2019, and Kuwait in 2020 (Table 1) (Whitehead, 2019).
| Year | 2017 | 2019 | 2020 | |||
|---|---|---|---|---|---|---|
| Country | Saudi Arabia | United Arab Emirates | Bahrain | Oman | Qatar | Kuwait |
Introduction of sin tax policy does not negate the importance of the government’s role in running awareness campaigns. They are crucial to raise children’s awareness of good nutrients, for instance forbidding TV advertisements of the sweetened beverages in the times when children are most likely to be watching TV. Applying the latter will support the policy of applying sin taxes on sweetened beverages to discourage the sugar intake. These campaigns are important because children’s food preferences are mainly affected by their parent’s preferences, mass media, peer group, nutritional knowledge, and socio-economic factors (McCullough et al., 2004). Educating children about proper nutrients is essential via nutrition education programs in schools and pre-schools. Nutrition education programs should be run for long periods as it has been shown that short-term education had no impacts on changing dietary intake and behaviour in spite of the fact that it raises nutritional knowledge (Kim et al., 2018; Yeom & Cho, 2016).
Given the fact that food preferences have an impact on lifelong eating habits and health, proper nutrition and adequate selection of food is crucial in early childhood (Okubo et al., 2016; Ventura & Worobey, 2013). The World Health Organization (WHO) suggests a decrease of the intake of free sugar to less than 10% of the total consumed calories given the increasing rate of added sugar intake (WHO, 2015a). Children usually are exposed to sweetness when they are infants, which increases their intake of sweets when they grow up (Foterek, 2016; Okubo et al., 2016), so it is crucial to construct an environment that decreases their intake of added sugar.
Hence, a policy and an action plan for sugar reduction has been developed by the EMR of the World Health Organization based on WHO guidelines (Alwan et al., 2017) in order to reduce sugar intake by more than 50% for children and adults (WHO, 2020). Accordingly, one important initiative of the EMR Office is the implementation of fiscal measures that have been constructed to support the actions for obesity prevention 2019–2023. These measures include taxes on SSB, in addition to other taxes and subsidies that promote healthier diets (WHO, 2019).
This research has the following objectives:
1. Provide an overview of the interventions to discourage sugar intake and reduce consumption level;
2. Measure the impact of sin taxes on the consumption and sales level of SSB in GCC countries, who applied sin taxes on SSB (Table 1).
This paper measured the impact of sin taxes on SSB using a panel data set that covers sales volumes of soft drinks in the GCC from 2010 to 2020. The data were secondary data collected by Global Company Intelligence (GCI) (Underlying data (Megally, 2020)), which is a company that specializes in collecting data from national governments and international industrial companies. GCI created a report for the authors with the following variables for the period 2010–2020 of the GCC countries Saudi Arabia, UAE, Bahrain, Oman, Qatar and Kuwait: consumption volumes of soft drinks in million liters per year, percentage growth from previous period to current (PP Growth %), percentage growth from previous period to current period in million litres, and value of soft drinks in million dollars and local currency of each country per year.
The results have been analysed using STATA 15.0 starting with descriptive statistics, then testing the normal distribution of the time series of both independent and dependent variables using the Shapiro-Wilk test. Finally, the impact of sin taxes on sales volumes has been tested via t-tests, average treatment effects, difference-in-difference estimation, and separate regression analysis.
Measuring the average treatment effect and the difference-in-difference necessitate a random selection of the treatment and control groups conditioning on some observed characteristics X. This enhances an unbiased estimation of the treatment effect. Ravallion (2008) has illustrated a model to simplify the idea by assuming Yi (1) as and Yi (0) as where the following equation can be applied to a subsample of treated and untreated as follows:
One single regression can be estimated by pooling the data for both treatment and control groups ending up with the following:
where Hence, the treatment effect that can be derived from equation 5.13 can be represented in ATT = E(Yi|Ti = 1,X) = E[αT - αC + Xi(βT - βC)]. ATT refers to the treatment effect on the treated only. Given equation 5.13, the treatment effect can be consistently estimated with OLS under the following assumption that predicts no selection bias because of randomization. Practically, the common impact-model is usually assuming βT = βC, resulting with the average treatment effect ATE as αT - αC.
For the difference-in-difference, let’s assume the binary regressor explained as follows
Assuming that yit fixed effects model with
Where αi is an individual-specific is fixed effect, and δt is a time-specific fixed effect. This is equivalent to regressing yit on Dit as well as fixed effects of set of time dummies and individual-specific effects. If there are no other regressors for simplicity, the individual effects αi can be reduced by first differencing concluding
In this view, the impact of the treatment ϕ can be estimated by pooled OLS regression of Δyit on ΔDit as well as time dummies set.
If we considered two period of time only instead of set of time periods assuming that treatment takes place in period 2 only, so for all individuals in period 1, Di1=0, but in period 2, Di2 = 0 only for the untreated individuals and Di2 = 1 for the treated. Hence, t subscript can be dropped from (6) to end up with
Where Di is a binary variable indicates whether the individual in the treated or untreated group. In that view, OLS regression of Δy on the binary regressor D and an intercept can be used to estimate the treatment effect. If we defined the sample average of Δyi for the treated by where Di =1 and the sample average of Δyi for the nontreated is defined by where Di = 0. Accordingly, the estimator of the OLS will be reduced to
This estimator represents the differences-in-differences (DID) estimator. It is called difference in difference as one of the differences estimates the difference in time for both the treated and nontreated groups and then this difference is taken in the time differences. Definitely, this can be extended from panel data to separate cross sections data if they are available in the two periods. The averages for the treated and untreated groups in the first period will be denoted in and and similar averages for both groups in period 2 can be denoted in and . This will be applicable if it possible that the individual has been identified as treated or untreated in the first period. Hence, the estimator will be as follows:
A consistent estimation of ϕ for preceding formulation of the DID estimator requires certain assumptions. First assumption states that the time effects δt are common between the untreated and treated groups. Second assumption assumes stability of composing treated and untreated groups before and after the assignment of the treatment as the fixed effects αi is eliminated with panel data differencing. For the repeated cross-section data, it is implied from model (5) that and are denoted as follows:
Considering the occurrence of the treatment in the second period only, the following will bring about:
Where The consistency of as in Equation (9) will occur if the assignment of the treatment is random and if plim and
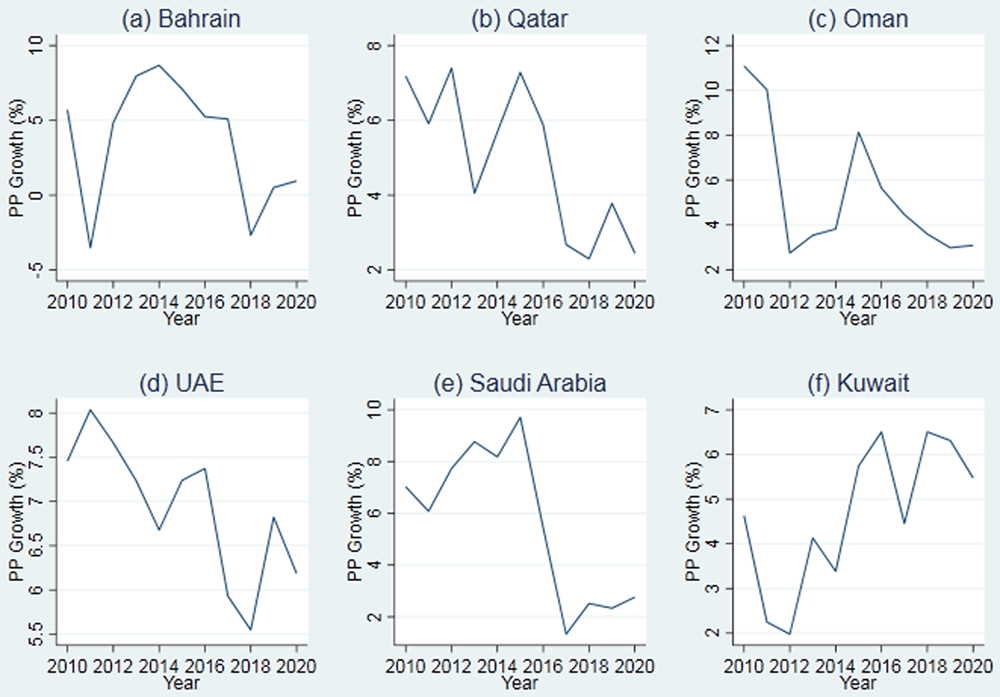
Table 2 shows the decline in percentage change of SSB consumption due to imposing sin taxes, from 2016 to 2020 in all countries assessed. This reflects the preliminary effect of excise taxes on consumption that will be explained further in the following sub-sections of the Results. Saudi Arabia and UAE had implemented excise taxes on SSB in 2017, followed by Bahrain. Oman and Qatar had implemented the policy by the beginning of 2019, then, Kuwait was the last country in 2020 (Table 1) (Whitehead, 2019).
| Year | Bahrain | Kuwait | Qatar | Oman | Saudi Arabia | United Arab Emirates |
|---|---|---|---|---|---|---|
| 2016 | 5.25 | 6.51 | 5.88 | 5.64 | 5.44 | 7.37 |
| 2017 | 5.09 | 4.45 | 2.68 | 4.47 | 1.33 | 5.93 |
| 2018 | -2.68 | 6.51 | 2.30 | 3.60 | 2.52 | 5.55 |
| 2019 | 0.51 | 6.31 | 3.78 | 2.99 | 2.34 | 6.82 |
| 2020 | 0.95 | 5.47 | 2.45 | 3.09 | 2.76 | 6.19 |
The growth rate of sales volumes decreased from 5.44% to 1.33% in Saudi Arabia, 7.37% to 5.93% in UAE, and 5.25% to 5.09% in Bahrain from 2016 to 2017. The growth rate of sales volumes in Qatar and Oman showed a drop from 2018 to 2019 (Qatar: 2.30% to 3.78%; Oman: 3.60% to 2.99%). In Kuwait, the growth rate of sales volumes decreased from 6.31% to 5.47% from 2019 to 2020.
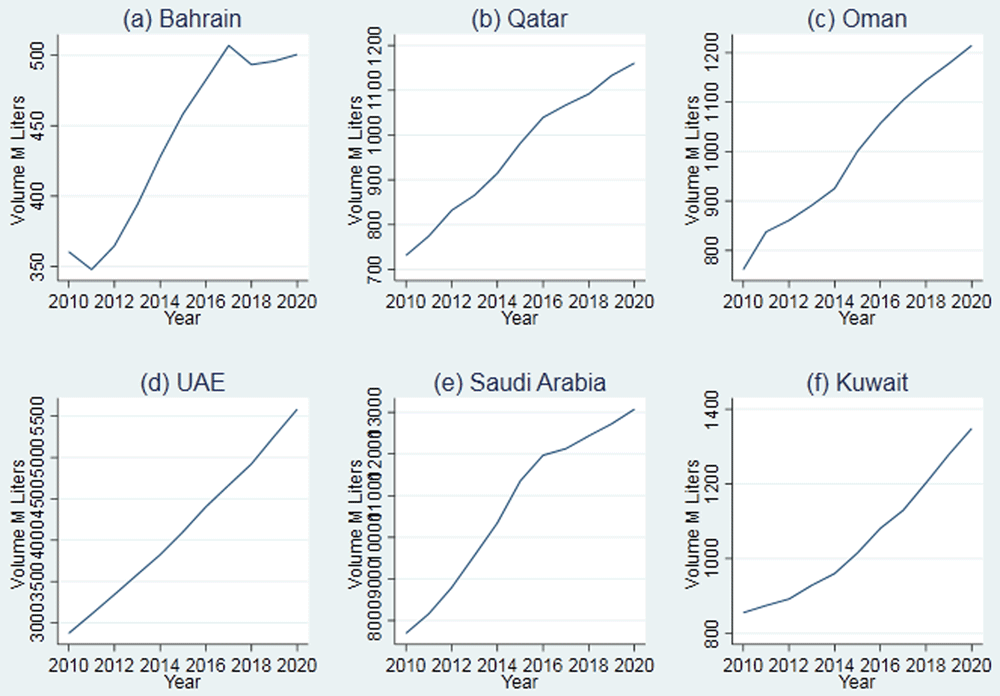
Sales volume of SSB decreased when sin taxes have been applied on energy and soft drinks as the figures showed a difference in the sales volumes in the GCC countries from 2010 to the 2020.
The trend of sales volume of SSB between 2010 and 2020 is shown in Figure 4 where it increases over this time period. However, the rate of change of sales volume starts to decrease sharply in 2017 in Saudi Arabia, Bahrain and UAE, and 2019 in Qatar and Oman, which is when sin taxes were applied on the prices of SSB (Figure 5).
The normal distribution of sales volume, the growth rate of sales volume, as well as the value in million dollars had been tested before estimating the model using the Shapiro Wilk test, where H0 assumes a normal distribution of the variables. The results in Table 3 show that the time series of the variables are normally distributed, which qualifies them to be used in the regression model except for the sales volume of Bahrain and the growth rate of sales volume of Oman.
Before measuring the impact of sin taxes on each country separately, the difference of average change in sales volumes between the GCC countries who applied sin taxes in 2017 as a treatment group with the remaining GCC countries who applied the policy later in 2019 and 2020 as a control group has been measured via t-tests. The results of the first t-test observed that there is a significant decrease in the change of consumption volumes in the countries that applied the policy versus the control group who had not applied the policy in 2017 with significance <1%. The average decrease of sales volumes of SSB is represented by 2.637% less in the treatment group versus the control group (Table 4). In addition, the difference of average change in sales volumes for all GCC countries before the implementation of the excise tax policy in 2017 in some GCC countries versus after implementation. The results show that there is a significant decrease by 2.577% in the change of consumption volumes after 2017 relative to the change of consumption before 2017 in all GCC countries.
| Change in sales volumes (treatment vs. control) | Change in sales volumes (before 2017 vs. after 2017) | |||
|---|---|---|---|---|
| No Sin Taxes | With Sin Taxes | Before 2017 | After 2017 | |
| Mean | 5.878 | 3.241 | 6.136 | 3.559 |
| No. of Observations | 49 | 17 | 42 | 24 |
| Difference | 2.637*** | 2.577*** | ||
Table 5 shows the estimation of average treatment effect (ATE). The average treatment effect of applying sin taxes on the growth rate of the consumption level of SSB has been measured using one outcome represented in the change in sales volume. The model observed that the potential means of the growth rate of consumption level controlling for the price of the beverages in dollars. The potential mean of the growth rate of consumption in the control group is 6.10%; while, the mean is lower for the countries in the treatment group. Such results estimated a negative impact of applying sin taxes on the growth rate of consumption levels that is represented by 2.87% less. This implies that the difference between the potential means of the growth rate of consumption of the treatment group countries versus the control is 2.87% less. The ATE is significant, which gives enough evidence to reject the null-hypothesis that states there is no difference between the means of the growth rate of consumption of both the treatment and control groups. These results support the estimated observations of the t-test.
| Change in sales volumes | |
|---|---|
| Potential mean control | 6.101*** |
| Average treatment effect | -2.872*** |
| No. of observations | 66 |
The impact of the treatment has been also measured by difference-in-difference estimator comparing the difference in the growth rate of consumption level between the treated and control groups. In addition, the difference in the growth rate of consumption level have been compared over time with the variable time taking value of 1 starting from 2017 and later and value of 0 when year is before 2017. The difference in both differences is measured by the coefficient of difference-in-difference. The estimator shows a significant negative impact of sin taxes on the growth rate of consumption level, which showed a decrease in the growth rate by 3.03% in the treatment group countries relative to the control group countries after imposing the excise taxes policy after 2017 (Table 6).
| Change in sales volumes | |
|---|---|
| Diff-in-Diff | -3.029*** |
| Value (in dollars) | 0.0002 |
| Constant | 5.509 |
| R2 | 0.2134 |
The impact of sin taxes for each country has been tested via the following model:
Where SalesVolt refers to the change in sales volume in million litres and Pricet refers to the price of soft drinks in million US dollars.
The results show that sin taxes have a significant negative impact on the change of sales volume over years with significance level <5% and high R2. This implies that the decrease in rate of sales volumes is explained by the change in price due to the implemented sin taxes by around 51%, 40%, 55%, 99%, 71% in Qatar, Oman, UAE, Kuwait, and Saudi Arabia, respectively. This reflects that the implemented sin taxes decreased the rate of sales volumes of SSB in Qatar, Oman, UAE, and Saudi Arabia by 0.8%, 1%, 0.1%, <0.1%, respectively. However, the estimated impact of sin taxes did not show significant impact of sin taxes on sales volumes in Bahrain, which is supported by zero R2, This implies that the model does not estimate the impact of sin taxes on sales volumes. For Kuwait, the estimated model showed that the higher the value of soft drinks, the higher the consumption level. However, the estimated model of Kuwait should be estimated later since the policy had just been implemented in 2020 during the lockdown of COVID-19, so the sin taxes did not show an impact on Kuwaiti consumption volumes (see Table 7).
| Change in volume | ||||||
|---|---|---|---|---|---|---|
| Bahrain | Kuwait | Qatar | Oman | Saudi Arabia | UAE | |
| Value (in dollars) | -0.0001339 | 0.8694195*** | - 0.008437** | -0.0130668** | -0.0011593*** | -0.0008054*** |
| Constant | 3.690532 | 174.077 | 13.06856 | 15.21186 | 14.2385 | 9.383132 |
| R2 | 0.0000 | 0.9924 | 0.5068 | 0.3965 | 0.7174 | 0.5486 |
NCDs are responsible for more than half of deaths every year in Qatar. More than two-thirds of the population (70.1%) are overweight or obese, and women are more likely than men to be obese. More than quarter (27%) of school children suffer from one or more forms of malnutrition (overweight, obesity, underweight or stunted growth). Elsewhere in the EMR, Qatar suffers from a high burden of NCD-related risk factors, such as physical inactivity, tobacco use, and unhealthy diets high in salt, sugar and fat (Al-Kaabi & Atherton, 2015). Similarly, UAE children are facing increased risk of obesity and overweight, and the frequency of obesity among youth is two to three times more than international standards. The implications of childhood obesity on public health are profoundly increased for UAE children and adults since adult chronic diseases increase the obesity rates (Al-Haddad et al., 2005; Malik & Bakir, 2007).
In addition, it had been shown that 25.7% of 15-19 aged Omani girls were obese/overweight. Based on the high consumption of sugary drinks among adolescents, as well as other practices that are categorized as unhealthy dietary practices, obesity among children becomes an increasing serious concern (Alasfoor et al., 2007; WHO & Oman MOH, 2010; WHO & Oman MOH, 2017). Similar prevalence rates were observed in Bahrain where the prevalence of obese and overweight males ranged from 15.7% to 28.9% and from 21.1% to 30.7% among females. High consumption of fast food, sugary beverages, chocolates and sweets are expected to have the highest contribution to the high prevalence rates of obese children in Bahrain (Musaiger et al., 2011). It has been also observed that obesity is considered a problem among Bahrani school children that led them to call for interventions that eradicate obesity among schoolchildren (Musaiger et al., 2014).
Furthermore, Kuwait also has an increasing trend of overweight and obesity. Prevalence of overweight adults increased from 71.7% to 73.4% from 2012 to 2016, and prevalence of obesity increased from 35.6% to 37.9% from 2012 to 2016 (WHO, 2016f). Similarly in Saudi Arabia, the obesity and overweight prevalence rate has increased among Saudi Arabian children alarmingly (Al-Hussaini et al., 2019).
Prevalence rate of obesity, overweight and deaths due to diabetes have increased in the last decade in the EMR and the rate is higher for children living in GCC countries (Abdul-Rasoul, 2012). NCDs play a major role in the high rate of deaths in GCC countries annually. It does not only affect adults, but schoolchildren suffer from diabetes, obesity, overweight, underweight and stunting growth (WHO, 2016d).
These facts prompted GCC countries to introduce an operational policy for diabetes, and an operational policy to reduce unhealthy diet related to NCDs, which was imposed in 2017 (WHO, 2016e). Consequent, the current study aimed to measure the effect of implemented excise taxes on the reduction of SSB consumption. One of the main aims of the operational policies is increasing the consumption of healthy food in schools. Reaching such results requires cooperation between the Ministry of Health of GCC countries and the WHO. Considerable progress to implement the action plan has been achieved between 2011 and 2018 (as shown in our study, Figure 5), and one significant action was implementing a new tax on carbonated drinks (50%) and energy drinks (100%) (Whitehead, 2019).
Our results showed that the rate of change in sales volume over the last decade in GCC countries started to decrease sharply in the year when sin taxes were applied to the prices of soft drinks. Sales volumes were increasing but at decreasing rates, and the sin tax had a significant negative impact on the change of sales volumes over the past 10 years. However, Kuwait has applied the sin taxes policy in 2020, and accordingly, the estimated results can not be relied on as the model needs to be estimated in a few years to be valid enough to estimate the impact of the sin taxes policy on the consumption of SSB. In addition, the policy had been applied in the time of the COVID-19 lockdown, which may play a role in making the policy ineffective. Also, the results showed that the model did not estimate the impact of sin taxes on the sales volumes of SSBs in Bahrain as the model may require more explanatory variables to explain the variation of consumption due to the variation in SSB price. Generally, the estimated difference between the potential means of the growth rate of consumption of the treatment group countries versus the control group is 2.87% less. The growth rate of sales volumes decreased (Alsukait, et al., 2020; Megally & Al-Jawaldeh, 2020) from 5.44% to 1.33% in Saudi Arabia, 5.25% to 5.09% in Bahrain, and 7.37% to 5.93% in UAE from 2016 to 2017. Also, the growth rate of sales volumes in Oman and Qatar showed a decrease from 2018 to 2019 as their excise taxes have been implemented in 2019 (Oman: 3.60% to 2.99%; Qatar: 2.30% to 3.78%). Kuwait was the last GCC country to implement the excise taxes in 2020 and the figures shows that the growth rate of sales volumes decreased slightly from 6.31% to 5.47% from 2019 to 2020. These results suggest the application of sin taxes for countries in the EMR.
These results align with the nutrition strategies of the United Nations of Action on Nutrition that was based on evidence and experimental studies. Such studies observed effective fiscal measures of taxes and subsidies and proved its effectiveness in shifting habits of promotion and purchase of dietary change (Thow et al., 2014; WHO, 2016g; WHO, 2015b). Also, the implemented excise taxes are expected to decrease the obesity levels among GCC’s children over the coming years. Such expected improvements in the health of the children will improve intelligence cognition and schooling performance of the children. Furthermore, these studies showed a decrease of the percentage change of sales volume, which supports the evidence of the countries that applied taxes and decreased the purchases of SSB in a range of 20–50% (Colchero et al., 2016; Ells et al., 2015; Mozaffarian et al., 2012; Powell et al., 2013; Thow et al., 2014; WHO, 2016g; WHO, 2015b).
Reducing obesity among children in the EMR received great attention recently given its high prevalence rate. One health economic action is imposing excise taxes on SSB (Lobstein, 2014). The main aim of the current study was to measure the impact of applying such taxes on the consumption of SSBs. The estimated results showed a positive effect of applying sin taxes in terms of decreasing the consumption level of SSB in Qatar, Oman, UAE, and Saudi Arabia, but not in Bahrain and Kuwait.
Accordingly, such policy is recommended to be implemented in other EMR countries. Furthermore, GCCs should proceed with promoting nutritional quality of foods as proposed by the roadmap of the WHO, as well as generating measures for education, marketing, and promotion for nutritious foods. Awareness campaigns should take place to promote reducing the consumption of SSB and substitute with more consumption of water, unsweetened milk for children, fresh fruits and vegetables. These recommendations align with the recommended priority actions by the WHO for the strategy on nutrition for the EMR 2020–2030 (WHO, 2019).
Harvard Dataverse: Soft Drinks Volumes - GCC, https://doi.org/10.7910/DVN/6OFWQE (Megally, 2020).
Data are available under the terms of the Creative Commons Zero "No rights reserved" data waiver (CC0 1.0 Public domain dedication).
| Views | Downloads | |
|---|---|---|
| F1000Research | - | - |
|
PubMed Central
Data from PMC are received and updated monthly.
|
- | - |
Provide sufficient details of any financial or non-financial competing interests to enable users to assess whether your comments might lead a reasonable person to question your impartiality. Consider the following examples, but note that this is not an exhaustive list:
Sign up for content alerts and receive a weekly or monthly email with all newly published articles
Already registered? Sign in
The email address should be the one you originally registered with F1000.
You registered with F1000 via Google, so we cannot reset your password.
To sign in, please click here.
If you still need help with your Google account password, please click here.
You registered with F1000 via Facebook, so we cannot reset your password.
To sign in, please click here.
If you still need help with your Facebook account password, please click here.
If your email address is registered with us, we will email you instructions to reset your password.
If you think you should have received this email but it has not arrived, please check your spam filters and/or contact for further assistance.
Comments on this article Comments (0)