Keywords
3D stitching, Lighsheet microscopy, Tiled scan, Mosaic, ImageJ
This article is included in the NEUBIAS - the Bioimage Analysts Network gateway.
This article is included in the Software and Hardware Engineering gateway.
3D stitching, Lighsheet microscopy, Tiled scan, Mosaic, ImageJ
A number of open source tools are available to stitch mosaics from optical microscopy 3D tiled scans1–4 but they all implement automated algorithms, potentially converging to a suboptimal solution. This is especially likely if the initial positions are far from the optimal positions, or if the data suffers from unexpected artifacts. Even worse, this situation can be difficult to detect in practice since these tools bring no or scarce support to check the results and correct for errors manually. Additionally, some software limits the size of the datasets1,2, or requires the data to be redundantly converted to ad-hoc formats3. Finally, none of these solutions handles both dual-side illumination and dual-side camera detection, two useful lightsheet microscopy5 modalities that can advantageously be combined (Figure 1, Left). We developed MosaicExplorerJ to address these shortcomings and bring a complementary alternative to ImageJ BigStitcher4, the reference in the field.
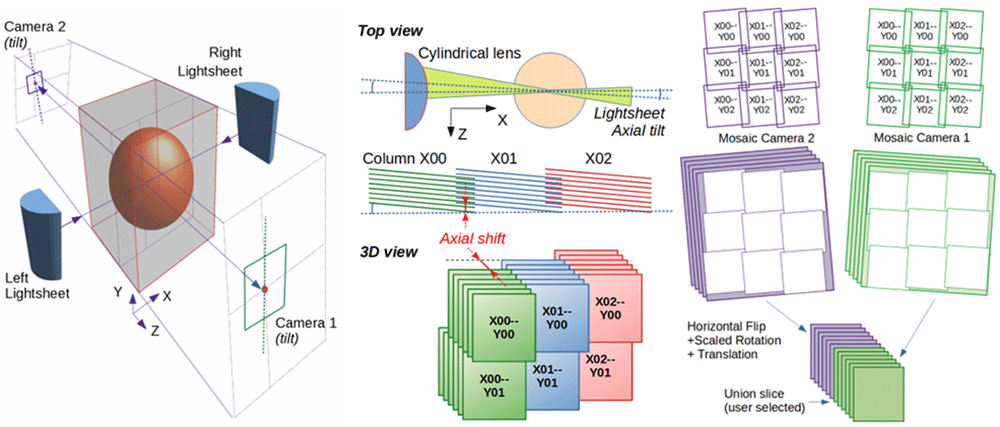
Left: Illuminating the sample and collecting the light from both sides enables to image a sample by lightsheet microscopy in the best conditions. Middle: Overlapping tiles (green, blue, red) from a 3D mosaic are shifted axially to compensate for the tilt of the lightsheet (here exaggerated around Y axis). Right: Reconstructed mosaics from both cameras are aligned before stacking their best section.
Whereas stitching the tiles of confocal microscopy datasets chiefly consists in compensating for the scanning head to sample stage tilt, stitching lightsheet microscopy datasets is compounded by the fact that the lightsheet is not necessarily perfectly collinear to the object plane of the detection objective. This can lead to 1) a distortion of the aspect ratio of the images (often negligible), 2) an apparent axial displacement of the tiles while moving across the mosaic. This second effect can be simply compensated by axially offsetting the 3D tiles accordingly (Figure 1, Middle), but additional lightsheet non-uniformity (or lateral misalignment) can lead to differences in the features visible in the regions of tile overlap; potentially weakening correlation based algorithms. To address these issues, MosaicExplorerJ does not implement any automated stitching but instead assists the user in visually aligning the tiles along their possible degrees of freedom. This is basically achieved by following a step-by-step procedure to compensate for the misalignments highlighted in the regions of overlap between adjacent tiles.
ImageJ/Fiji should be installed and MosaicExplorerJ run from ImageJ macro editor. If no other data is available, the software can be tested with the data provided.
First, the mosaics from both cameras (and illumination sides) should be aligned independently before being aligned together. This first operation can be as simple as joining two matching features between two adjacent tiles (Figure 2B), while compensating lightsheet tilt (Figures 2C, 2D) and the axial wobbling of the motors forming the mosaics might respectively require to adjust the axial shift of the tiles forming the top left corner or the first row and first column of the mosaic. Dual-camera alignment includes a calibration step to compensate for discrepancy between the magnifications of both detection objectives (Figure 1, Right). Finally, the user can save the overall mosaic alignment for further inspection, or export the stitched dataset as a TIFF series. Several tile blending modes are available.
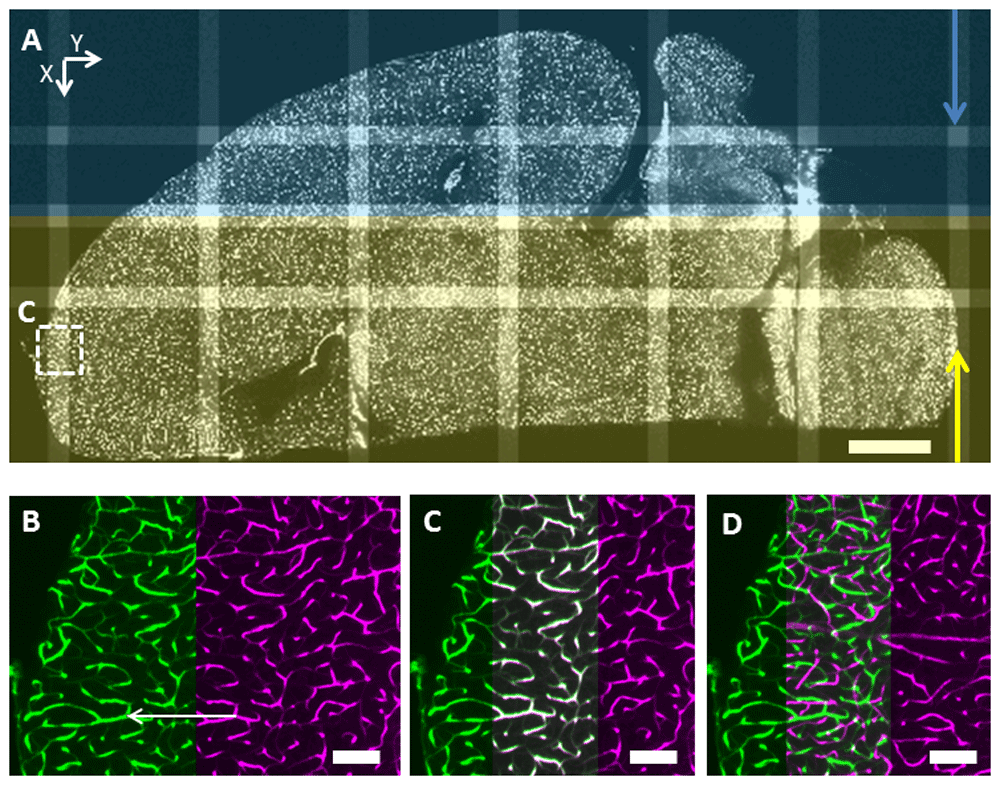
A: Two mosaics (2×8 tiles each with a full overlap in the central column along Y) from a dual illumination side scan aligned with MosaicExplorerJ, the arrows show the directions of the light sheets (the view is turned and cropped to fit the figure). Scale bar: 1 mm. B: Zoomed region from the red square prior to adjusting the XY positions of the tiles but after axial shift (Z) correction. The user joins two matching features (white arrow) from two adjacent tiles. C: The XY positions of the tiles are adjusted based on the previous user input and for correct alignment matching features are highlighted in white in the region of overlap. D: Same view but prior to axial shift correction to compensate for lightsheet tilt: no matching features are apparent in the region of overlap. Scale bar: 100 µm.
All datasets were successfully aligned, each time in under 30 minutes. The results were checked visually by scrolling through the slices and ensuring that the alignment was correct in the regions of overlap between the tiles. The dataset Brain2_izq_2x8Mosaic_LeftSide_300GB was also aligned by BigStitcher, leading to similar results both visually and quantitatively (Extended Data Table S16). It took about 2h30 to process this dataset with BigStitcher (from 3D TIF tiles to computed alignment), excluding the conversion from TIFF series (the original format of this dataset) to 3D TIFF tiles. This time is expected to scale at least linearly with increasing dataset size for BigStitcher while alignment time in MosaicExplorerJ is relatively constant, and mostly conditioned by the degrees of freedom of the 3D tiles. After alignment, the exportation of the stitched images to TIFF series could be achieved in a comparable time with both tools.
MosaicExplorerJ brings a complementary alternative to BigStitcher, and presents a number of advantages (Extended Data S2 and Table S26). No fiducials or detectable feature points are required, which makes the tool robust, versatile, and compatible with large optically cleared samples for which introducing fiducials is virtually impossible. The processing is fast, and terabyte-size datasets can be explored on the fly without conversion to an intermediate format, even on laptop computers with limited memory. Finally, dual-side camera detection is supported and all alignment steps are performed visually, which brings direct control and feedback both on the imperfections of the datasets and on the quality of the results, minimizing the risk of leaving coarse errors unnoticed.
A complete description of the datasets used to test MosaicExplorerJ, including sample preparation and imaging can be found in Extended Data S1. The full datasets are too large (1.5TB) to feasibly host on a data repository; however, datasets can all be accessed publicly on the IRB Barcelona Google Drive at: https://bit.ly/37iocrP.
Zenodo: MosaicExplorerJ F1000Research article extended data. https://doi.org/10.5281/zenodo.41560306.
Data are available under the terms of the Creative Commons Attribution 4.0 International license (CC-BY 4.0).
Source code and documentation are available from: https://github.com/SebastienTs/MosaicExplorerJ
Archived source code at time of publication: https://doi.org/10.5281/zenodo.41068487.
License: GNU General Public License v3.0.
| Views | Downloads | |
|---|---|---|
| F1000Research | - | - |
|
PubMed Central
Data from PMC are received and updated monthly.
|
- | - |
Provide sufficient details of any financial or non-financial competing interests to enable users to assess whether your comments might lead a reasonable person to question your impartiality. Consider the following examples, but note that this is not an exhaustive list:
Sign up for content alerts and receive a weekly or monthly email with all newly published articles
Already registered? Sign in
The email address should be the one you originally registered with F1000.
You registered with F1000 via Google, so we cannot reset your password.
To sign in, please click here.
If you still need help with your Google account password, please click here.
You registered with F1000 via Facebook, so we cannot reset your password.
To sign in, please click here.
If you still need help with your Facebook account password, please click here.
If your email address is registered with us, we will email you instructions to reset your password.
If you think you should have received this email but it has not arrived, please check your spam filters and/or contact for further assistance.
Comments on this article Comments (0)