Keywords
Categorization of emotionally-charged and neutral visual scenes, parameters of event-related potentials, COMT, HTR2A, BDNF genes polymorphisms.
Categorization of emotionally-charged and neutral visual scenes, parameters of event-related potentials, COMT, HTR2A, BDNF genes polymorphisms.
There are three major corrections in the article. First: genetic analyses data was corrected and genotypes frequencies were added; Second - the "procedure" section was corrected and improved. Now experimental procedure is described more accurate and understandble.Third - in the "results" section table with results of Hardy-Weinberg distribution was added.
Also there are a lot of minor corrections: "leads" corrected to "electrodes", "polymorphisms" to "genotypes", genes' symbols have been italicized etc. Most of the corrections (major and minor) were done according to reviewer reports.
See the authors' detailed response to the review by Vladimir Barabanshikov
See the authors' detailed response to the review by Sergey B. Malykh
Studying hereditary factors that determine specifics of the categorization of visual images are very important for opening up new opportunities for individualizing educational experiences, i.e. those that could take into account individual visual characteristics of students. Specifically, emotions that actualize these visual images can play an essential role in the process of categorizing visual scenes. As it was shown in our previous work, particular features of image categorization may vary dependent on genetic differences among carriers at the level of genes that control the functioning of brain neurotransmitter systems (Ermakov et al., 2017; Kovsh et al., 2018) .
From an evolutionary standpoint, emotions arose to serve as quick adaptive responses to the environment to increase chances of survival (Nesse, 1990). Modern psychophysiology entertains the idea that genetic changes that affect neurotransmitter pathways can also influence the manifestations of emotions (Alfimova et al., 2019).
In this work, we studied specific parameters of event-related potentials (ERPs) and categorization of images of visual scenes, both emotionally-charged and neutral, in carriers of different genotypes of COMT, HTR2A, BDNF genes.
The catechol-O-methyltransferase (COMT) gene encodes the production of the catechol-O-methyltransferase enzyme that regulates the inactivation of catecholamines (dopamine, norepinephrine, adrenaline). The COMT enzyme is involved in the metabolic degradation of the dopamine neurotransmitter in brain regions such as the prefrontal cortex, amygdala and striatum. Research have shown that the Val158Met polymorphism of COMT gene is associated with the activity of the brain stem, amygdala, basal ganglia and prefrontal regions, and also is involved in the modulation of neural substrate structures responsible for processing negative and positive emotions (Williams et al., 2010), motivation (Åberg et al., 2011), recognition of negative emotions (Gohier et al., 2014), and is associated with aggressiveness (van Dongen et al., 2018). There is a connection between Val158Met polymorphism of COMT gene and the thickness of the cerebral cortex in associative areas of the brain (prefrontal, parietal, and cingulate), in which dopamine content is typically high (Williams et al., 2010). As a result, carriers of the Met allele of Val158Met polymorphism of COMT gene have a thicker cortical layer in these particular areas (Miranda et al., 2019).
Our work also included genotyping of study participants on the serotonin 5-HTR2A receptor gene and the brain neurotrophic factor gene (BDNF). The genotypes for these genes (as well as for the COMT gene) could be represented in a homozygous dominant form, homozygous recessive and heterozygous forms. These genotypes are associated with different sensitivity of neuron receptors to the presence of neurotransmitters in the synaptic cleft; in the case of the HTR2A gene, the level of survival of dopaminergic neurons, while in the case of the BDNF gene, the nutrition of serotonergic neurons (Ermakov et al., 2017).
The serotonin receptor gene HTR2A is located in the 13ql4 – q21 region of the thirteenth chromosome that has two introns and three exons. It is the main excitatory G-protein-coupled serotonin receptor, and may also have an inhibitory effect on the visual and orbitofrontal cortex. Serotonin receptors encoded by the 5HTR2A gene are found in large numbers in the hippocampus and in the anterior cerebral cortex, i.e. in structures closely related to emotional processes. In the 5HTR2A gene, a -1438A/G polymorphism located in the promoter region is possible, which causes a change in the functional activity of the receptor depending on the presence of A or G alleles. The serotonin system is actively involved in the processes of cognitive and emotional control. It was also shown that the HTR2A serotonin receptor gene is involved in the emotional assessment of visual stimuli (Mills et al., 2016).
BDNF is seen as a common neurotrophin in the brain that has an activating effect on neuronal differentiation and synaptic neuroplasticity, and affects neuron survival in adulthood (Chen et al., 2004; Pearson-Fuhrhop et al., 2009). Neurotrophins are combinations of growth factors in the brain that play a key role in neuronal plasticity. The BDNF gene is located on the short arm of chromosome 11 and contains Val66Met single nucleotide polymorphism (SNP), in which guanine can be replaced by adenine (G196A). Such a substitution causes the amino acid valine to be replaced by methionine in codon 66, and the alleles of this gene are called Val and Met. The Met allele interferes with the intracellular traffic of BDNF, reducing the secretion of neurotrophic brain factor, which is associated with the transition from plasticity to stability in neural networks (Egan et al., 2003). The Met allele affects the transport of neuropeptides within the cell and reduces depolarization-dependent secretion of BDNF (Alfimova et al., 2009).
Our previous work confirmed the hypothesis that there is specific induced electrical activity in the brain associated with the analyses of emotiogenic images in individuals with reduced (Val/Met genotype of the brain neurotrophic factor BDNF) and high (Val/Val genotype of the brain neurotrophic factor BDNF gene) cortical plasticity, as well as in individuals with different genotypes for the HTR2A serotonin receptor gene (Ermakov et al., 2017).
The aim of this work is to study parameters of ERPs while categorizing images of neutral and emotionally-charged visual scenes in carriers of different genotypes of COMT, HTR2A, BDNF genes.
The use of experimental subjects is in accordance with ethical guidelines as outlined in the Declaration of Helsinki. In addition, the design of the experiment, the methodological approach, the conditions of confidentiality and use of oral consent for the subjects was performed according to the Code of Ethics of Southern Federal University (SFU; Rostov-on-Don, Russia) and approved ethically by the Academic Council of the Academy of Psychology and Pedagogy of SFU, on 22 February, 2017. Before the start, each participant was informed about the goal of the research, procedure, experimental conditions, and safety of their personal data. Oral consent was obtained from each participant before continuing with the study.
This study involved 73 participants, of both sexes, average age 23±5 years (83% - females). The study was conducted from March 24, 2017 to May 25, 2017 at the Laboratory of Psychophysiology and Experimental Psychology, Department of Psychophysiology and Clinical Psychology, Academy of Psychology and Education Sciences, Southern Federal University (Rostov-on-Don, Russia). The participants were students of Rostov universities, including the Southern Federal University (SFU). SFU students received bonus points in their academic disciplines for their participation in the study.
DNA analysis was carried out as follows: after two hours of dry hunger, buccal epithelium was collected from the inner surface of the participant’s cheeks by two sterile cotton probes. Then, probes with biological material were immersed in a transport medium and sent to the «Biologicheskie reshenija i tehnologii» (Moscow, Russia), where DNA was extracted from clinical material using the «Proba-NK» reagent kit (ООО «DNK-tehnologii», Russia). Thermocycler CFX96 «Touch» («Bio-Rad», USA) was used for real-time polymerase chain reaction (PCR).
For analysis, we used genomic DNA preparations obtained from biological samples using DNA extraction kits with the removal of PCR inhibitors and the presence of at least 100 genomic copies in 1 μl. During the genetic examination, the following DNA sections were analyzed:
– COMT catechol-O-methyltransferase gene (Genebank sequence AY341246, polymorphism 23753G> A, Val158Met, rs4680 code). Possible genotypes: Val/Val, Val/Met, Met/Met. Val158Met alleles are codominant.
– BDNF brain neurotrophic factor gene (GenBank sequence NG_011794, polymorphism 68690G> A Val66Met, rs6265 code). Possible genotypes: Val/Val, Val/Met, Met/Met.
– HTR2A serotonin receptor gene (GenBank sequence, NG_013011, polymorphism 4692G> A, rs6311 (Tr2)). Possible genotypes: G/G, G/A, A/A.
Genetic analysis showed that carriers of dominant (GG), heterozygous (GA), and minor (AA) genotypes of Tr2 polymorphism of the second type of serotonin receptor gene have similar genotypes for Tr3 polymorphism (CC, TC, TT, respectively). From now on, we will use the designation of genotypes by Tr2 polymorphism (A/G), implying the presence of a carrier of a similar genotype by Tr3 polymorphism.
The genotyping resulted in the following sample composition: COMT gene, 25 participants (34,2%) were carriers of Val/Val genotype, 41 – Val/Met (56,2%) and 7 – Met/Met (9,6%) genotypes; HTR2A gene, 19 participants were carriers of A/A genotype (26%), 29 – A/G (39,8) and 25 – G/G (34,2%); BDNF gene, 46 participants were carriers of Val/Val genotype (63%), 26 – Val/Met (35,6%) and 1 – Met/Met (1,4%).
The stimuli database (Stoletniy et al., 2020b) of the experiment, contained 445 images, has already been used in our previous works (Ermakov et al., 2016; Vorobyeva et al., 2016). 147 of them are conditionally negative, 149 are positive, 149 are neutral. Resolution of pictures is 1024х768 (16°х12° of visual angle on the 100 cm distance). The average luminance of the images wasequal to 110 of 256 greyscale (30 cd/m2). Stimuli databaseavailable as Extended data.
Participants were seated in good lit room at viewing distance of 100 cm in front of the monitor. A grey background (30 cd/m2) was on the monitor all the time of trials. Images were presented in center of screen with duration of 500 ms. The interstimuli interval was 500–1500 ms. Stimuli pictures were presented in random order regardless of their emotional valence. Participants were asked to examine the images and indicate emotion they elicit – by pressing the corresponding key on the keyboard: “1”– negative, “2” – neutral, and “3” – positive emotion. The next image appeared on the screen only after the subject evaluated the previous one and the interval between stimuli was completed. Additionally, participants were instructed to blink only when stimulus ended.
Electroencephalogram (EEG) recording was carried out using Neurovision-136 equipment manufactured by «MKS» (Russia), with a discretization frequency of 1000 Hz. ERPs were recorded at 128 leads, using «5–10» system, and with two ear referents. Bandpass filter of 0.5-50 Hz was applied.
The frequencies of emotionally different responses were processed using the REdaS Package for R, version 0.9.3., in order to calculate confidence intervals for averaged response rate (α = 0.05) (Maier, 2015). The ERPs were processed using the EEGLAB version 4.11. – an interactive Matlab/Octave toolbox for processing electrophysiological data (Delorme & Makeig, 2004). Before averaging, the recording was filtered to eliminate epochs of ERP with artifacts. For the analysis was taken interval between 100 ms before and 500 ms after onset of stimulus. ERPs were averaged and analyzed according to type of responses – negative, neutral and positive. An intragroup comparison of ERPs was carried out using unpaired Student t-test (p <0.05). ERPs to emotionally different responses were compared separately for samples of carriers of different genotypes for the COMT, BDNF, and HTR2A genes, e.g. in COMT group ERP compared as Val/Val vs Val/Met vs Met/Met carriers when they chose negative, neutral or positive answer, etc. All visualization was conducted in EEGLAB.
The results of estimating the frequency distribution of alleles and genotypes of the COMT, BDNF and HTR2A genes polymorphisms corresponded to the Hardy-Weinberg distribution. The estimation of the distribution of genotype frequencies for all loci, as well as the positions of the loci, are presented below in Table 1.
Behavioral results. The calculation of confidence intervals for assessing relative frequencies of differential responses to emotiogenic stimuli resulted in the following outcomes for participants with COMT genotypes. Participants with different genotypes of the COMT gene selected negative responses to the stimuli with approximately equal average frequency, as illustrated in Figure 1. However, the distribution of neutral and positive responses is of greater interest.

(A) Negative stimuli, (B) neutral stimuli and (C) positive stimuli. MM - Met/Met, VM - Val/Met, VV - Val/Val. Left scale - average response rate in percentage.
Participants with the Met/Met genotype reliably responded with the neutral reaction 10% more often than participants with Val/Met and 15% more often than Val/Val genotype carriers. Also, the same Met/Met subgroup of participants gave on average 10% and 13% fewer positive answers, respectively.
ERP data analysis. The analysis of ERPs in response to images of different emotional modality showed the following. When respondents viewed the presented image as emotionally negative, the amplitude of the ERP in the parietal and occipital regions of the brain (range 150 – 250 ms) in the subgroup with the Met/Met genotype was significantly lower (p <0.03, t = -2.40) than in the Val/Met subgroup (Figure 2). Comparison of ERP for the Met/Met and Val/Val subgroups when the respondents choose to evaluate presented images as emotionally negative showed a significantly higher amplitude (p <0.001; t = -0.40) for the Val/Val subgroup in the parietal-occipital leads, in the range of 180 – 220 ms. The amplitude of the ERPs in response to the negative images was also significantly higher (p <0.04; t = -0.13) for the Val/Val subgroup compared to the Val/Met subgroup in the same latency.
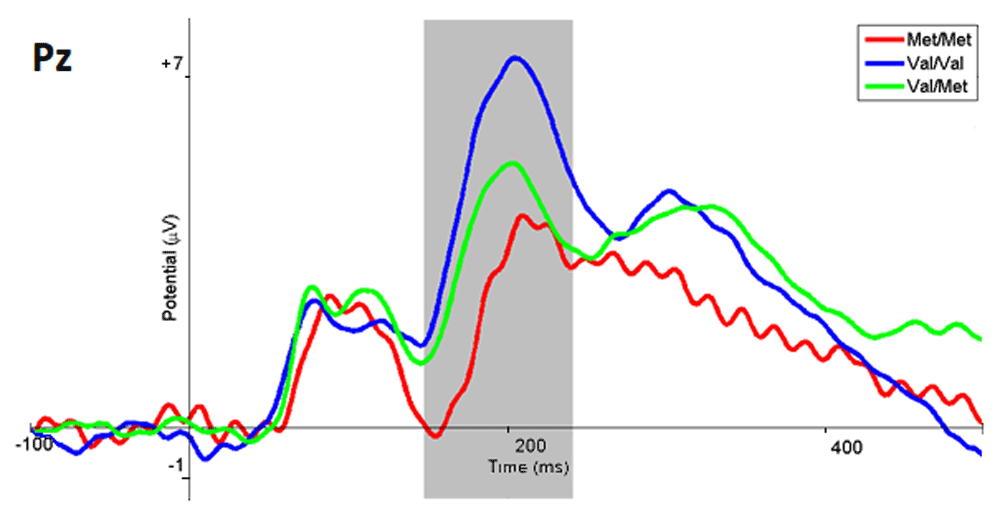
The ERP wave of the Met/Met subgroup are marked in red, Val/Val in blue, Val/Met in green, and the range with statistically significant differences in gray.
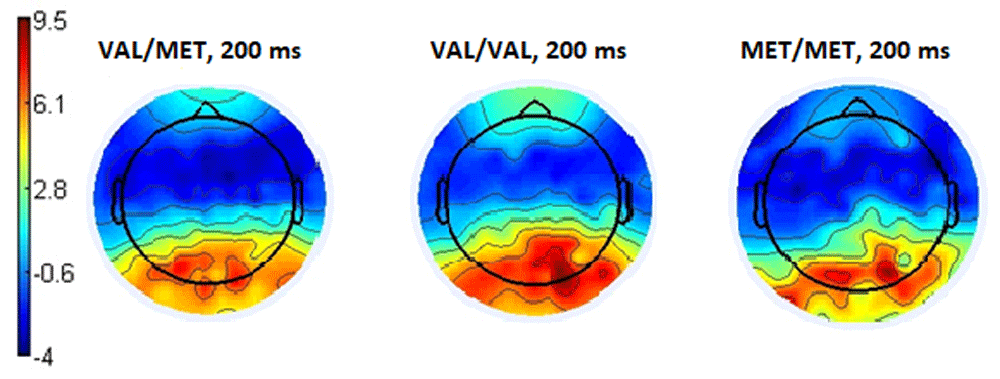
In addition, the topography of the potentials distribution also shows that the main differences in brain activity when evaluating a stimulus as being emotionally negative are observed mainly in the parietal-occipital regions of the cortex (Figure 3). Examples of amplitudes values of the ERPs of the Pz electrode are presented in Table 2.
When the respondents evaluated emotiogenic stimuli as neutral, the following electrophysiological picture was observed. In participants with the Met/Met genotype, the amplitude of the ERP in the parietal-occipital areas within the 150 – 230 ms timeframe was significantly lower than in the Val/Met (p <0.035, t = -0.18) and Val/Val (p <0.001 t = -3.59) subgroups of participants (Figure 4). Also, in the Val/Val genotype subgroup, the amplitude of ERPs in the same time range and region was significantly higher (p <0.07; t = -2.77) than for the Val/Met subgroup (Figure 4). Examples of the amplitude for the Pz electrode are presented in Table 2.
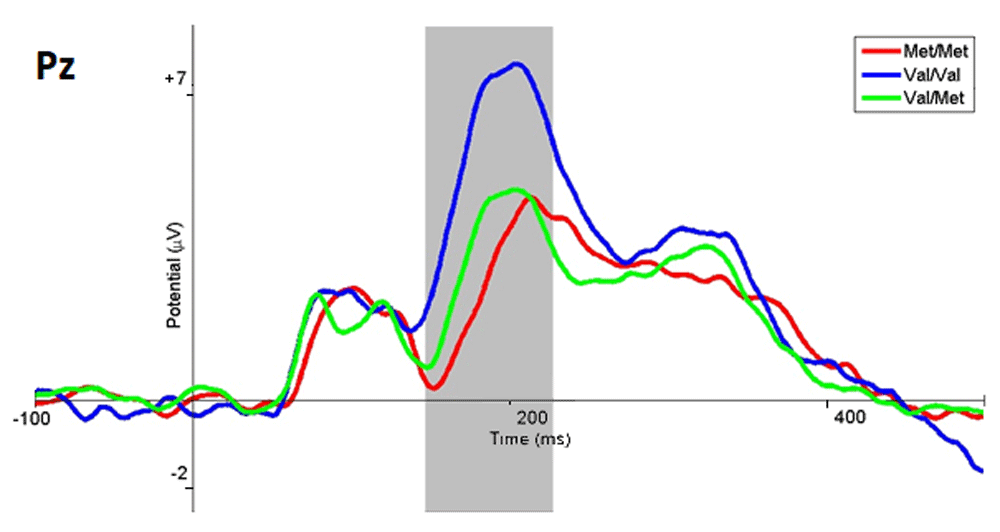
The ERP wave of the Met/Met subgroup are marked in red, Val/Val in blue, Val/Met in green, and the range with statistically significant differences in gray.
The topography of the potentials distribution also shows that the main changes in brain activity associated with the selection of neutral responses appear in the parieto-occipital regions of the cortex, as is the case with the selection of negative responses (Figure 5). Nevertheless, the amplitude and spatial differences in the latter case show that the activity of these regions in the Met/Met and Val/Met subgroups was lower, while in the Val/Val subgroup the activity was slightly higher.

When emotiogenic stimuli were evaluated to be positive, our analyses of the ERPs showed the following. In respondents with the Met/Met genotype of the COMT gene, the amplitude of ERP wave in the range from 199 to 210 ms was significantly higher than in the Val/Met subgroup (p <0.05, t = -0.09) and Val/Val (p <0.05 t = -0.28 ) subgroup (Figure 6). In respondents with the Val/Met genotype, the ERP amplitude was significantly higher than in respondents with Val/Val (p <0.469; t = -0.74) in the same time range and region (Figure 6). It is worth noting that in this case, the highest amplitude of the ERPs was observed in the Met/Met subgroup, and the lowest in the Val/Val subgroup, in contrast with the other two (negative and neutral) response options. Examples of the amplitude values for the POz electrode are presented in Table 2.
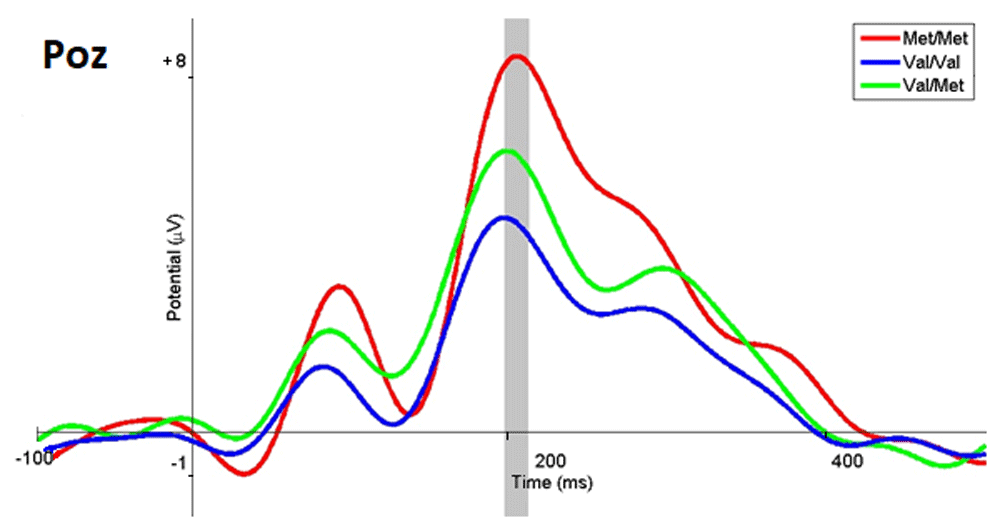
The ERP wave of the Met/Met subgroup are marked in red, Val/Val in blue, Val/Met in green, and the range with statistically significant differences in gray.
The topography of the distribution of cortical potentials (Figure 7) demonstrates higher activity at a latency of 200 ms in the parieto-occipital leads for all subgroups as the trend shown in Figure 6 reflects. Nevertheless, in comparison selecting negative and neutral options, it is apparent that the choice of a positive response required less involvement of these brain areas.
Presented below are the amplitudes of ERPs at the Pz and Poz electrodes that exemplify selection of different response options when evaluating stimuli by respondents with different genotypes of the COMT gene. Table 2 illustrates the amplitude values of the ERPs with respect to the zero reference line.
Behavioral results. The calculation of confidence intervals for the average frequency by selection of the response option showed the following for participants with HTR2A geneotypes. Confidence intervals overlap in all figures, which indicates the absence of any significant differences between the means (Figure 8). This fact indicates that the participants in this sample selected responses of different emotional modality with approximately the same frequency, regardless of which genotype of HTR2A gene they carried.

(A) Negative stimuli, (B) neutral stimuli and (C) positive stimuli. AA – A/A, GG – G/G, AG – A/G. Left scale - average response rate in percentage.
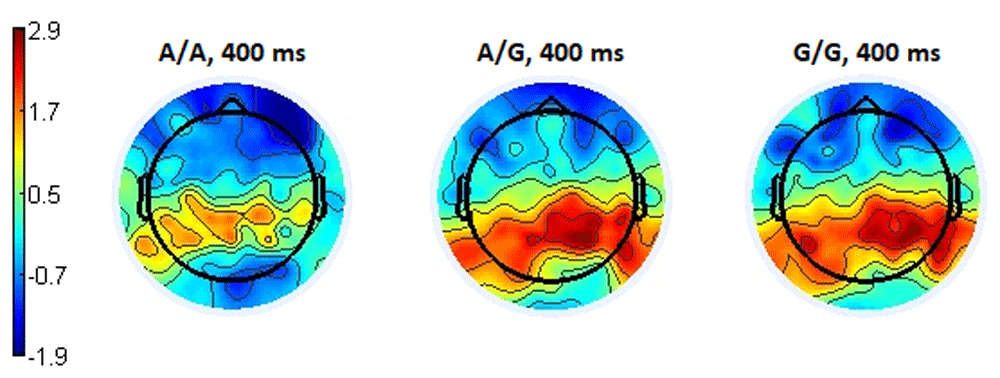
ERP data analysis. Analyses of ERPs in responses to images of different emotional modality by participants with different genotypes of the HTR2A gene showed the following. When a stimulus was evaluated as negatively emotionally charged, the amplitude of ERPs in the latency from 350 to 420 ms in participants with the A/A genotype showed a significantly more powerful increase in negativity than in participants with the A/G (p <0.007, t = -2.88) and G/G (p <0.022 t = -2.42) genotypes. At the same time, the ERP in subgroups of participants with the A/G and G/G genotypes, when compared with each other, did not have any significant differences (p <0.57, t = 0.56), and their amplitudes differed very slightly (Figure 9). Examples of the amplitude values at the Oz electrode are presented in Table 2.

The ERP wave of the A/A subgroup are marked in red, G/G in blue, A/G in green, and the range with statistically significant differences in gray.
The topography of the ERPs for the latency of 400 ms demonstrates a high and homogeneously distributed positivity in the parieto-occipital and posterior parietal regions of the brain in subgroups with the A/G and G/G genotypes compared to the A/A subgroup (Figure 10).
When a neutral response to an emotiogenic stimulus was selected in the time range from 390 to 410 ms, negativity of responses significantly increased in participants with the A/A genotype compared to the A/G (p <0.014, t = -2.58) and G/G (p < 0.008 t = -2.81) subgroups. The ERP of the A/G and G/G subgroups remained positive, and when comparing between these two subgroups, the corresponding potentials did not show significant differences (p <0.62, t = - 0.49) (Figure 11). Examples of the amplitude values at the Oz electrode are presented in Table 2.
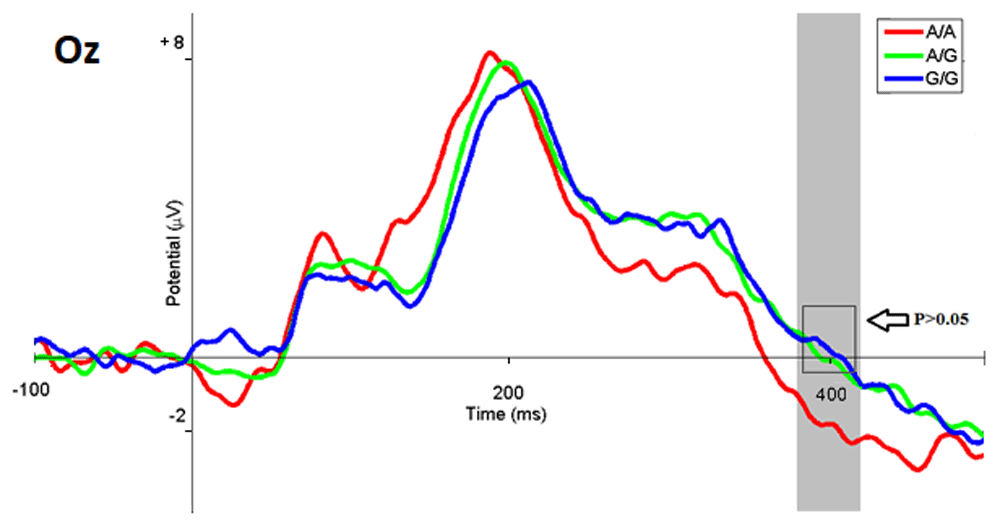
The ERP wave of the A/A subgroup are marked in red, G/G in blue, A/G in green, and the range with statistically significant differences in gray.
The topography of the distribution of ERPs for the latency of 400 ms associated with a neutral response showed a picture similar to the situation of choosing a negative response, namely spatially uniform and higher positivity in the parietal-occipital and posterior temporal regions in subgroups with the genotypes A/G and G/G, compared with the increasing negativity in the A/A subgroup in the same brain regions (Figure 12).
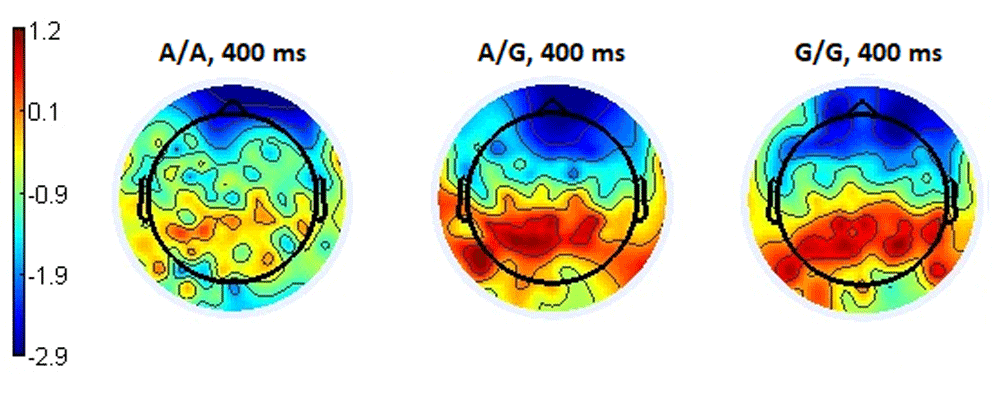
When the visual stimuli were evaluated as emotionally positive, the amplitude of the corresponding ERPs in the latency from 370 to 405 ms in participants with the A/A genotype showed increasing negativity, significantly different from that in subgroups with the A/G (p <0.004, t = -3 , 03) and G/G (p <0.04, t = -2.11) genotypes. Comparison between the A/G and G/G subgroups revealed no significant differences (p <0.75, t = 0.31), in terms of the amplitude of the indicated latency (Figure 13). It is useful to note ERPs of the A/G and G/G subgroups with the latency of 400 ms remained positive, but also expressed the tendency for further increase in negativity, similar to situations when participants selected responses of a different emotional valence (Figure 9 and Figure 11). Examples of the amplitude values at the Oz electrode are presented in Table 2.

The ERP wave of the A/A subgroup are marked in red, G/G in blue, A/G in green, and the range with statistically significant differences in gray.
The topography of the distribution of ERP for the latency of 400 ms associated with positive responses showed a picture similar to the two previous situations. The parieto-occipital and posterior temporal regions showed higher positive amplitude of event-related potentials in subgroups with the A/G and G/G genotypes compared to the A/A subgroup, which had the increased negativity in these brain regions (Figure 14).
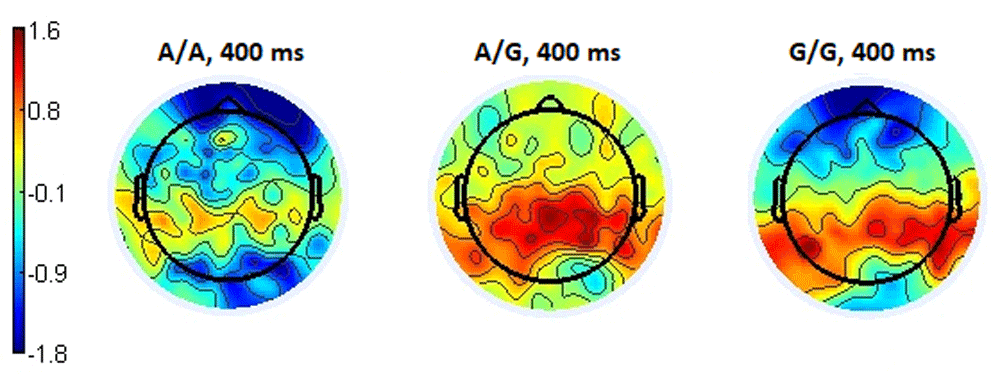
Presented below are the amplitudes of ERPs at the Oz lead that exemplify selection of different response options when evaluating stimuli by respondents with different genotypes of the HTR2A gene. Table 2 illustrates the amplitude values of the ERPS with respect to the zero reference line.
The calculation of confidence intervals for assessing the frequency of responses different in their emotional valence was carried out only for the Val/Val and Val/Met subgroups of the BDNF gene as only these subgroups were sufficiently represented in the sample. Participants with the indicated genotypes on average selected negative and positive responses to the presented stimuli with an approximately equal frequency, as illustrated in Figure 15A and C. At the same time, the Val/Val subgroup chose to judge presented visual stimuli as neutral rating significantly more often (57%) than the Val/Met subgroup did (Figure 15B).

(A) Negative stimuli, (B) neutral stimuli and (C) positive stimuli. VM - Val/Met, VV - Val/Val. Left scale - average response rate in percentage.
Analyses of brain ERPs for the BDNF subgroup was also performed only for participants with the Val/Val and Val/Met genotypes. When the presented images were evaluated negatively emotionally charged, the amplitude of the ERPs in the parietal-occipital areas within in the 180-195 ms latency for the Val/Val subgroup was significantly higher (p <0.04, T = -2.05) than for the Val/Met subgroup (Figure 16). Table 2 contains examples of the amplitude values for the Oz electrode with the latency of 190 ms.

The ERP wave of the Val/Met subgroup are marked in red, Val/Val in green, and the range with statistically significant differences in gray.
The topography of the distribution of ERPs demonstrates a higher amplitude in the parieto-occipital regions for the Val/Val subgroup of participants. It should also be noted that in the right hemisphere, the levels of activity are slightly higher than in the left, and this is true for the participants of both subgroups (Figure 17).
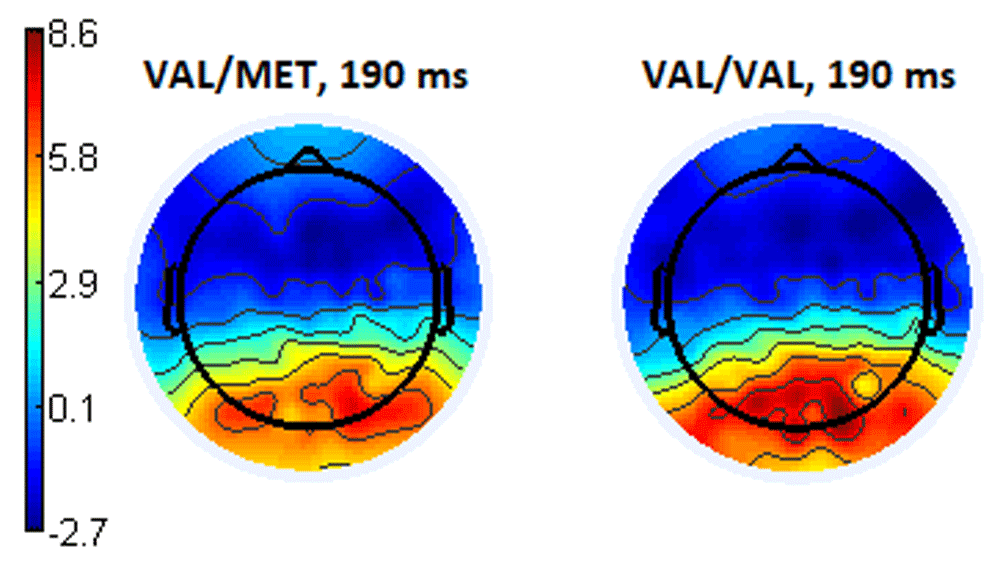
The analysis of the ERPs when participants evaluated visual stimuli as emotionally neutral showed significant differences in the latency of 130 – 180 ms from the stimulus onset (Figure 18). The amplitude of the ERPs in the subgroup with the Val/Val genotype of the BDNF gene in this case was statistically significantly greater (p <0.005, T = –2.89) than for the subgroup with the Val/Met genotype (the amplitudes for the Oz electrode are shown in Table 2). The range of significant differences is somewhat shifted towards its earlier latency in comparison with the situations when participants were selecting a negative response.

The ERP wave of the Val/Met subgroup are marked in red, Val/Val in green, and the range with statistically significant differences in gray.
The topography of the distribution of cortical potentials clearly indicates their significantly higher amplitude in the parieto-occipital regions of the cortex for the subgroup with the Val/Val genotype than the subgroup with the Val/Met genotype of the BDNF gene at the latency of 160 ms (Figure 19).

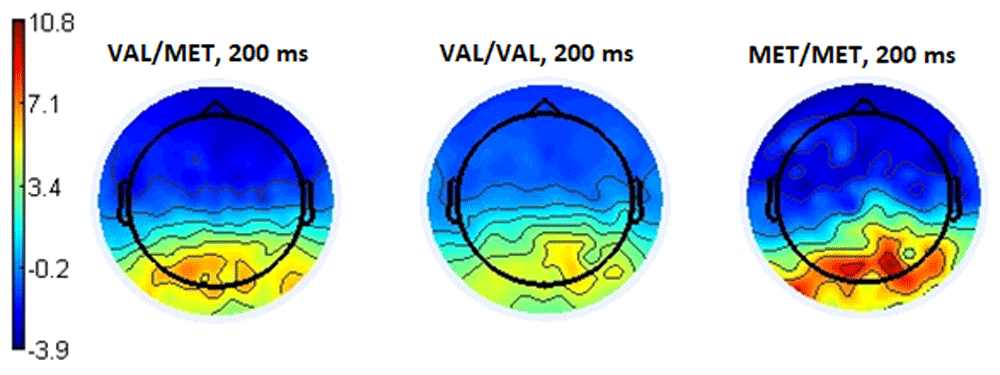
Comparison of the ERPs in response to stimuli perceived as emotionally positive by participants with different genotypes of the BDNF gene did not reveal any statistically significant differences (p> 0.05, T = -1.15) (Figure 20). Examples of the amplitude values at the Oz electrode with the latency of 200 ms are presented in Table 2.
The topography of the ERPs distribution in response to the stimuli evaluated to be emotionally positive shows an even activity of the parieto-occipital regions for 200 ms from the stimulus onset, regardless of the genotype of the BDNF gene (Figure 21).
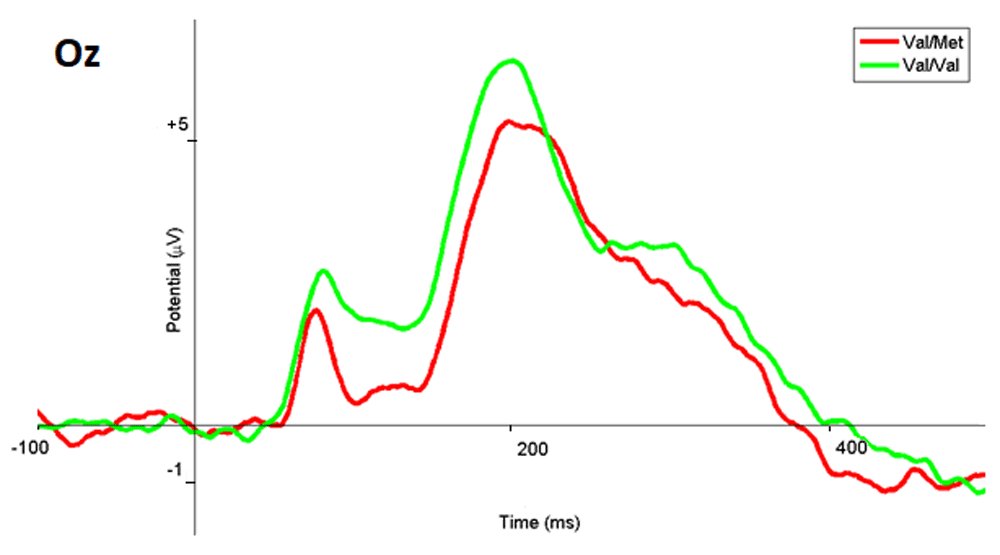
The ERP wave of the Val/Met subgroup are marked in red, Val/Val in green, and the range with statistically significant differences in gray.

Presented below are the amplitudes of ERPs at the Oz electrode that exemplify selection of different response options when evaluating stimuli by respondents with different genotypes of the BDNF gene. Table 2 illustrates the amplitude values of the ERPs with respect to the zero reference line.
A functional polymorphism of the catechol-O-methyltransferase gene (COMT), Val158Met, is involved in the catecholamine system associated with the perception of emotions. Dopamine in areas, such as the prefrontal cortex, tonsil and striatum, modulates brain activity in response to aversive stimuli and regulates the processing of emotions. For example, it was found that the COMT Val158Met gene genotype is associated with the success of the detection of emotions, and subsequent perception of the emotions’ valence (Tamm et al., 2016).
Our work demonstrates that, when asked to assess emotional valence of visual stimuli presented to them, participants with the Met/Met genotype of the COMT gene more often perceived these stimuli as neutral. At the same time, participants with the Val/Val genotype of the same gene evaluated these stimuli as emotionally positive with a higher frequency. Yet, we found no statistically significant difference between the subgroups with different genotypes of the COMT gene in their evaluation of the presented stimuli as emotionally negative.
There is a possibility that the assessment of the stimuli as negative by the study participants may be accompanied by a fear-type reaction. It is known that individual differences in dopaminergic genotypes of the COMT gene can affect the initial fear reactions (Panitz et al., 2018). Another study also found lower rates in respondents with the Val/Val genotype of Val158Met COMT gene compared with carriers of the Met allele in fear recognition (Heller et al., 2018).
By means of the analysis of the ERPs recorded during the evaluation of the emotional valence of visually presented stimuli, it was found that there are statistically significant differences between carriers of different genotypes of the COMT gene for components of the ERPs in the parietal and occipital regions in the range from 150 to 250 ms. These results could be indicative of the presence of more intense processing of visual stimuli by the carriers of the Val/Val and Val/Met genotypes of the COMT gene in response to the stimuli perceived as neutral or negative, and by the Met/Met genotype carriers of the COMT gene in response to emotionally positive stimuli.
(Storozheva et al., 2019), during studying auditory ERPs, found that the responses with the highest amplitude were given by people with the Val/Val genotype of the COMT gene, which is largely consistent with our data.
Moreover, in this work, we did not obtain statistically reliable data on the differences between the genotype subgroups of the COMT gene for the late components of ERPs. However, such data do exist in the periodicals. For instance, (McLoughlin et al., 2018) found that people with the Met/Met genotype of the COMT gene demonstrated the best task performance during the registration of event-related brain potentials, and the homozygous Met/Met genotype of the COMT gene was associated with a smaller frontal source of P3. The latter indicates that, although having more dopamine in the frontal areas of the cortex has advantages in some tasks, it can also jeopardize the reactive inhibition function.
Also, (Shalev et al., 2019) showed the presence of significant relationships between the COMT genotype and the effective threshold for visual perception, and found that insufficient or excessive catecholaminergic activity can have equally harmful effects on ability to maintain stable attention focus.
The receptor for 5-hydroxytripamine (serotonin) 2A (5-HTR2A) is a key receptor involved in monoaminergic regulation of the basic biological functions of the body and of human behavior. A polymorphic version of the HTR2A rs6313 gene (102 T> C), potentially associated with the distortion of the effectiveness of post-transcriptional processes, is considered in the medical literature to be a risk factor for cognitive pathologies. A polymorphism rs6311, located in close proximity to the promoter region of the gene, is associated with changes in the expression of the HTR2A gene (Zabotina et al., 2018). It is assumed that anomalies in emotional regulation may result from dysfunctional serotonergic regulation of the limbic and prefrontal areas, especially of the amygdala, anterior cingulate gyrus, and the prefrontal cortex. Serotonergic genes are involved in controlling recognition of emotions (Piel et al., 2018).
The MRI data obtained in the work of (Matsunaga et al., 2017), indicates that the polymorphisms of the HTR2A gene are associated with individual differences in the manifestation of empathy and in experiencing happiness. Brain structures responsible for providing a mental model of empathizing with other people, include the medial prefrontal cortex, as well as the temporoparietal region. It was also found that participants with the dominant homozygous and heterozygous GG genotypes of the HTR2A gene experienced more pronounced feelings of happiness and greater activation of a part of the mentalization network, than people with the minor homozygous AA genotype.
(Gonzalez et al., 2019) showed that the genotype of the HTR2A gene correlates with the manifestation of emotions of anger in a sample of adult males.
In our present work, when participants evaluated emotional valence presented to them via visual stimuli, there was no statistically significant difference in the frequency of assessing these stimuli as neutral, positive or negative in those with different genotypes of the HTR2A gene (A/A, A/G and G/G).
Analysis of the ERPs recorded while assessing emotional valence of presented visual stimuli found that in participants with the A/A genotype of the HTR2A gene, there was a statistically significant increase in negativity in the parieto-occipital regions (the time range of 350–420 ms) in comparison with participants who carried genotypes A/G and G/G of the HTR2A gene. This latter finding can be interpreted in support of the fact that decision-making in evaluating visual stimuli in participants with the A/A genotype of the HTR2A gene occurs more intensively (compared with subjects with the A/G and G/G genotypes), regardless of what response regarding emotional valence of a particular stimulus was selected by the participants.
Existing studies that feature data from the post-mortem analysis of the brain of mentally healthy people found that carriers of different alleles of the T102C polymorphic marker differ in the amount of 5HTR2A mRNA and synthesized on its basis protein product, where the carriers of the A/A genotype showed a lower level of the gene expression (Polesskaya & Sokolov, 2002).
The interactions between genes and the environment lead to changes in the brain, depending on emotions- and behavior-transforming experiences. A positive interaction with the environment through new experiences and physical activity can engage the neuroplasticity mechanisms to improve brain functioning. Adult neurogenesis and brain neurotrophic factor (BDNF) serve as mediators of neuroplasticity (Rogers et al., 2019).
In our work, when the study participants evaluated emotional valence of visually presented stimuli, those with the Val/Val genotype of the BDNF gene choose the neutral response significantly more often than the participants with the Val/Met genotype did.
Our analysis of the ERPs, recorded while the participants were assessing the emotional valence of visually presented stimuli, found that when negative responses were given, the amplitude of the ERPs in the parieto-occipital regions of the Val/Val subgroup was significantly higher than that of the Val/Met subgroup in the latency of 180–195 ms. Similarly, when the participants evaluated stimuli as being emotionally neutral, the amplitude of the ERPs in the range of 130–180 ms in the parieto-occipital regions was statistically significantly higher in the subgroup with the Val/Val genotype of the BDNF gene than it was in the subgroup with the Val/Met genotype. No statistically significant differences between these genotypes of the BDNF gene were detected in response to the stimuli perceived by the participants as emotionally positive.
The obtained data can be interpreted as indicating that individuals with high cortical plasticity (i.e., with the Val/Val genotype of the BDNF gene), more carefully process the details of the visual stimuli, which manifests itself as an increase in activation of the parietal-occipital zones (with a statistically significantly higher peak amplitude at 190 ms of the induced activity), as it is reflected in their responses to the images estimated to be emotionally negative or neutral.
Other authors using the method of recording event-related brain potentials showed that the carriers of the Met allele of the BDNF gene have lower electrophysiological indicators of attention compared to the carriers of the Val allele, which is manifested in a decrease in the amplitude and increase in the latent period of the P300 component (Getzmann et al., 2013; Schofield et al., 2009).
The Met allele of the Val66Met polymorphism of the BDNF gene is associated with the reduced levels of functioning of the amygdala and hippocampus. It also is implicated in manifestations of depression and post-traumatic stress disorder, with episodic memory deficit. There is a study that analyzed ERPs in response to recognition of emotionally negative, neutral and positive words. In it, a reduced late component P300 was observed in Met carriers compared with the carriers of the Val homozygotes in response to recognizing negatively- and positively-colored words, which could indicate that conscious experience of emotional recollection may differ depending on the BDNF Val66Met genotype (Jones et al., 2019).
As this experimental study shows, when assessing emotional valence of visually presented stimuli, participants with the recessive homozygous Met/Met genotype of the COMT gene at a behavioral level more often perceived presented images as emotionally neutral. In contrast, participants with the dominant Val/Val homozygous genotype of the COMT gene were more likely to evaluate the visual stimuli as emotionally positive. No statistically significant differences between carriers of different genotypes of the COMT gene were observed in response to the stimuli perceived as emotionally negative.
A stronger reaction, as reflected in the amplitude of the ERPs, in participants with the recessive homozygous Met/Met genotype of the COMT gene was observed to the stimuli, assessed as positive (in the parietal and occipital regions in the time range from 150 to 250 ms). In those with the dominant homozygous Val/Val genotype of the COMT gene, a higher amplitude of the ERPs was observed for the stimuli assessed as either neutral or negative (in the parietal and occipital regions in the time range from 150 to 250 ms). The same tendency, but to a lesser extent, was detected for the study participants with the Val/Met heterozygous genotype of the COMT gene.
There were no statistically significant differences in the frequency of evaluating visually presented stimuli as either emotionally neutral, positive, or negative, as reflected in responses of the participants with different genotypes of the HTR2A gene (A/A, A/G, and G/G).
Analysis of the ERPs associated with participants’ evaluation of presented visual stimuli as emotionally negative, neutral, or positive revealed a statistically significant increase in negativity in the parietal-occipital regions in the range of 350–420 ms in participants with the recessive homozygous A/A genotype of the HTR2A gene, compared to participants with the heterozygous genotype A/G and the dominant homozygous G/G genotype of the HTR2A gene.
When the study participants evaluated emotional valence of visually presented stimuli, those with high cortical plasticity (carriers of the Val/Val genotype of the BDNF gene) chose neutral responses significantly more often than participants with reduced cortical plasticity (carriers of the Val/Met genotype).
Participants with high cortical plasticity (Val/Val genotype of the BDNF gene), processed the visual images more thoroughly, as reflected in greater activation of the parietal-occipital zones (with a statistically significantly higher peak amplitude at 190 ms of the ERP), which is shown to be typical for people with the homozygous Val/Val genotype when they evaluate emotional valence of visual information.
There are two major limitations in this study that could be addressed in future research. The first one is the overall sample size, second – insufficient amount of carriers homozygous Met/Met genotype for BDNF gene and partly for COMT gene.
The question of sample size can be interpreted in two ways. On the one hand, the specified sample size of 73 people is sufficient for a typical ERP study, since the nature of the experiment involves a significant number of trials and their averaging. On the other hand, the analysis of genetic data requires a significantly larger number of participants in order to be as accurate as possible to extrapolate to the general population. In this point of view, it seems logical to continue similar experiments on a large number of subjects for further confirmation of the obtained results.
The second limitation most likely follows from the first, since the detection of less common genotypes requires more genetic analyzes and subsequent engagement of carriers of such genotypes in the study, which is not always possible in terms of funding and time. The lack of carriers of the Met/Met genotype for the BDNF gene did not allow to investigate how this particular genotype influence on emotional assessment of visual scenes in contrast to other genotypes.
Both of this facts reduced the value of the article to some extent. To overcome these limitations, the next logical step in our future research is to increase the number of subjects, thereby increasing the representation of deficient genotypes.
Open Science Framework: EEGLAB datasets for study of event-related potentials during categorization of emotionally-charged and neutral visual scenes in carriers of polymorphisms of the COMT, HTR2A, BDNF genes, https://doi.org/10.17605/OSF.IO/84BV6 (Stoletniy et al., 2020a).
Open Science Framework: Stimuli database for studying emotional assessment of emotionally-charged images, https://doi.org/10.17605/OSF.IO/ZYG54 (Stoletniy et al., 2020b).
Data is made available under the terms of the Creative Commons Attribution 4.0 International license (CC-BY 4.0).
| Views | Downloads | |
|---|---|---|
| F1000Research | - | - |
|
PubMed Central
Data from PMC are received and updated monthly.
|
- | - |
Competing Interests: No competing interests were disclosed.
Reviewer Expertise: behavioral genetics
Competing Interests: No competing interests were disclosed.
Reviewer Expertise: Psychophysiology, experimental psychology, general psychology
Is the work clearly and accurately presented and does it cite the current literature?
Yes
Is the study design appropriate and is the work technically sound?
Yes
Are sufficient details of methods and analysis provided to allow replication by others?
Yes
If applicable, is the statistical analysis and its interpretation appropriate?
Yes
Are all the source data underlying the results available to ensure full reproducibility?
Yes
Are the conclusions drawn adequately supported by the results?
Yes
Competing Interests: No competing interests were disclosed.
Reviewer Expertise: Psychophysiology, experimental psychology, general psychology
Is the work clearly and accurately presented and does it cite the current literature?
Yes
Is the study design appropriate and is the work technically sound?
Partly
Are sufficient details of methods and analysis provided to allow replication by others?
Yes
If applicable, is the statistical analysis and its interpretation appropriate?
Partly
Are all the source data underlying the results available to ensure full reproducibility?
Yes
Are the conclusions drawn adequately supported by the results?
Partly
Competing Interests: No competing interests were disclosed.
Reviewer Expertise: behavioral genetics
Alongside their report, reviewers assign a status to the article:
| Invited Reviewers | ||
|---|---|---|
| 1 | 2 | |
|
Version 2 (revision) 28 Aug 20 |
read | read |
|
Version 1 26 May 20 |
read | read |
Provide sufficient details of any financial or non-financial competing interests to enable users to assess whether your comments might lead a reasonable person to question your impartiality. Consider the following examples, but note that this is not an exhaustive list:
Sign up for content alerts and receive a weekly or monthly email with all newly published articles
Already registered? Sign in
The email address should be the one you originally registered with F1000.
You registered with F1000 via Google, so we cannot reset your password.
To sign in, please click here.
If you still need help with your Google account password, please click here.
You registered with F1000 via Facebook, so we cannot reset your password.
To sign in, please click here.
If you still need help with your Facebook account password, please click here.
If your email address is registered with us, we will email you instructions to reset your password.
If you think you should have received this email but it has not arrived, please check your spam filters and/or contact for further assistance.
Comments on this article Comments (0)