Keywords
Heliotropium indicum, Tridax procumbens, Cleome rutidosperma, Commelina benghalensis, Euphorbia hirta, HPLC, Antioxidants.
Heliotropium indicum, Tridax procumbens, Cleome rutidosperma, Commelina benghalensis, Euphorbia hirta, HPLC, Antioxidants.
At present, many people are cautious about synthetic drugs usage because of their side effects and high price. On the contrary, herbal medicines have been continuously used in healthcare treatment system due to their cost effectiveness, better feasibility in the human physiological system and with minimal side effects. India is a vast source of medicinal and aromatic plants. Among its diverse and rich collection of medicinal plants, we have chosen five wild ethnomedicinal weeds and those are very less characterized and available with reported various bioactivities1–4.
These weeds grow in similar habitats, though they belong to different families. Botanically, one species of plant can considered as a valuable crop or medicinal plant, while another species in the same genus can be treated as a dangerous weed. Many plants that are widely accepted as weeds are also grown in gardens and other cultivated areas; these are known as beneficial weeds1–3,5–9. The current study focuses on searching for those medicinal weeds which have enormous future prospects for pharmaceutical industries.
Heliotropium indicum Linn. (Boraginaceae) is an annual herbaceous weed commonly known as the Indian heliotrope and is native to India5. Tridax procumbens Linn. (Asteraceae) is an annual herbaceous weed and commonly known as coat buttons; it is native to tropical America6. Cleome rutidosperma DC. (Cleomaceae) is an annual herb commonly known as Fringed Spider Flower; it is native to tropical Africa7. Commelina benghalensis Linn. (Commelinaceae) is an annual herb native to tropical Asia and Africa, commonly known as Bengal dayflower8. Euphorbia hirta Linn. (Euphorbiaceae) is an annual herb commonly known as asthma plant, and is native to India and Central America9.
Leaf, stem, root or sometime the complete plant possess the property to scavenge reactive oxygen species (ROS) or reactive nitrogen species (RNS), the main causative agents of oxidative stress and cellular damage which results in numerous diseases and disorders10,11. ROS or RNS includes a variety of free radicals such as superoxide anion (O2-), hydroxyl radical (.OH), nitric oxide radical (NO.), and peroxyl radicals (ROO.), and non-free radical species like hydrogen peroxide (H2O2), ozone (O3), hypochlorous acid (HOCl), nitrous acid (HNO2)12. The primary site of ROS production in the cell is the mitochondrial respiratory chain. Natural antioxidants protect us from oxidative stress by reducing the free radicals to nontoxic products. However, healthy cells have their own natural ROS or RNS defense mechanisms which actively eliminate free radicals through enzyme-mediated systems like superoxide dismutases, peroxidases, catalases, and glutathione peroxidases10–12.
Life-threatening microbial infections brought on by various pathogens are a significant cause of morbidity and mortality within immune-compromised individuals. Plant-derived natural antioxidants can play a vital role to protect from those microbial infections13–15. Administration of α-amylase inhibitors are necessary to keep diabetic patient glucose levels under control16. Determination of in vitro anti-diabetic and free radical scavenging activities are vital because it prevents both microvascular and macrovascular complications of diabetes. Medicinal plants are the rich source of α-amylase inhibitors and can be utilized for prevention or therapeutic measures17,18.
Plant derived antioxidants have profound activities in inflammatory disorders. Free radicals are essential mediators that provoke or sustain inflammatory or autoimmune diseases like rheumatoid arthritis, and consequently, their neutralization by antioxidants can give relief from inflammation and swelling19–21.
Urolithiasis is a disorder of the urinary tract, which may happen due to the oxidative stress by free radical generations22–24 and hence natural free radical scavengers are the best answer for that disease as well. Although medicinal plants have many bioactivities, sometimes their use should be prohibited due to their toxic effects; therefore, determination of cytotoxic effects of the medicinal plants’ extracts is a pre-requisite for their ethnomedicinal use against various physiological disorders of human beings25.
The therapeutic potential of the wild plants can be determined by measuring their phytochemical constituents, in vitro medicinal properties and toxicological effect. Therefore, the need arises to estimate and analyze the phytochemical constituents of these five wild medicinal plants leaves which are basically responsible for curing several physiological disorders and complications. The current research investigation aims to quantify the phytochemical constituents, and to evaluate the in vitro antioxidant activities and other important in vitro medicinal properties of the medicinal weeds under study. Next, cytotoxicity of the leaf extracts is to be determined using a cell viability assay and compared. To the best of our knowledge, the comparative evaluations of these medicinal herbs are reported for the first time.
Fresh leaves of the five medicinal plants were collected from Salt Lake City, Kolkata, West Bengal and India and authenticated by Botanical Survey of India, Central National Herbarium, Howrah, West Bengal, and India. The fresh leaves of the herbs were washed with clean water and dried at an ambient temperature for 30 days under shade. Dried leaves were made powdered and extracted using double-distilled water or 70% ethanol (1 g of powdered leaf was extracted with 50 ml solvent). The solution of each extract was then clarified using filter paper and stored at 4°C. The extracts were appropriately diluted for during further studies.
A total of four Gram-positive (Bacillus subtilis, Bacillus cereus, Staphylococcus aureus, and Staphylococcus epidermidis) and four Gram-negative (Escherichia coli, Vibrio cholera, Pseudomonas aeruginosa, and Klebsiella pneumonia) bacterial strains were used to measure the antimicrobial activity. The bacterial strains were obtained from the Department of Microbiology, Calcutta University, West Bengal and India.
All the chemicals and reagents used in the experiments were of analytical (AR) grade and purchased from Institutional enlisted chemical suppliers. For quantitative assays, Systronics 117 model spectrophotometer was used to determine the specific optical density.
Estimation of total polyphenol content. Quantitative estimation of the total phenolic compounds was done in triplicate by using the Folin-Ciocalteu (Merck, India) method of Singleton et al.26 with slight modifications. In brief, 1500 µl of diluted FC reagent was mixed with 300 µL of leaf extract thoroughly. Next, 1200 µl 7.5% Na2CO3 was added to it, vortexed and the total reaction mixture (3 mL) was incubated at dark for 2 h. The absorbance was measured at 765 nm. Gallic acid (SD Fine-Chem, India) was used as standard. The total phenolics contents were expressed in mg gallic acid equivalent/g dry weight.
Estimation of total flavonoid content. Total flavonoids content was quantified in triplicate by the aluminium chloride (Merck, India) colourimetric assay according to standard protocol of Zhishen et al.27 Quercetin (SRL, India) was used as standard. The absorbance was read at 510 nm. The total flavonoids content was expressed in mg quercetin equivalent/g dry weight.
Estimation of total tannin content. The total tannins content was evaluated by using Broadhurst and Jones28 method in triplicate. Tannic acid (SRL-92101, India) was used as a standard reagent. The absorbance was measured at 500 nm. Total tannins content was expressed in mg tannic acid equivalent/g dry weight.
Estimation of total alkaloid content. Total alkaloids content was determined by using the method of Fazel et al.29 in triplicate. The absorbance was measured at 470 nm. Caffeine (SRL, India) was used as standard. Total alkaloid content was expressed in mg caffeine equivalent/g dry weight.
Estimation of total cardiac glycosides content. Total cardiac glycosides content was estimated according to the method of Solich et al.30 in triplicate. Digoxin (SRL, India) was used as standard. Absorbance was read at 495 nm. The total cardiac glycoside was expressed in mg digoxin equivalent/g dry weight.
Estimation of total saponin content. Total saponin content was quantified using a standard method (20% ethanol) in triplicate31,32. The saponin content was calculated by using the following equation:
Where WEP = weight of dried end product, WPS = weight of powdered sample (initial).
High-performance liquid chromatography (HPLC) profiling of the 70% ethanolic extracts. The HPLC profiling of ten important bioactive phenolic acids, gallic acid (GA), catechin hydrate (CH), chlorogenic acid (CHA), caffeic acid (CA), syringic acid (SYA), p coumaric acid (pCA), sinapic acid (SIA), coumarin (CM), quercetin (QE) and kaempferol (KMP), was carried out using an Agilent Technologies 1260 Infinity liquid chromatography. Standard reagents were purchased from Sigma-Aldrich (USA). The peak area was calculated by Open Lab CDS version 2.0 software. In the experiments the polyphenolic compounds were separated under the following conditions: Phenomenex-C18 (2)-column (250 mm×4.6 mm i.d.; Luna 5-μm particle diameter 100 Å), the diode array detector (DAD) was set at 280 nm; the mobile phase consisted of 3% acetic acid water and acetonitrile (Himedia, India). Prior to use, the solutions were degassed in an ultrasonic bath and filtered through 0.22-μm membranes. The flow rate was 0.9 ml/min in gradient conditions. The injection volume was 20 μl. All the separations are carried out at ambient temperature. The gradient elution of solvent A (water-acetic acid) and solvent B (acetonitrile) had a significant effect on the resolution of compounds according to the procedure: 0 min, 100% (A); 5 min, 95% (A); 17 min, 85% (A); 40 min, 60% (A); 60 min, 50% (A); 65 min, 50% (A); 70 min, 100% (A)33,34.
ABTS free radical scavenging capacity assay. ABTS (2, 2-azino-bis-3-ethylbenzthiazoline-6-sulphonic acid, Tokyo Chemical Industry, Japan) radical cation decolourization assays were carried out in triplicate to determine the stable free radical scavenging property of extracts by the help of the standard method of Re et al.35 with slight modifications. In brief, 5 µL of leaf extract was mixed with 2.995 µl of ABTS reagent thoroughly, vortexed and the total reaction mixture (3 mL) was incubated at dark for 30 min. Next, absorbance was read at 734 nm. Ascorbic acid (Merck, India) was used as a standard. ABTS stable free radical scavenging property was expressed in ascorbic acid equivalent as well as the inhibition percentages were determined using the following equation:35–37
DPPH free radical scavenging capacity assay. The DPPH (1, 1-diphenyl-2-picrylhydrazyl, SRL, India) stable free radical scavenging property of the extracts was carried out by the help of using the standard method of Shen et al. (2010) with slight modifications. In brief, 0.1 mM DPPH solution was made in methanol and 50 µL of leaf extract was mixed with DPPH solution thoroughly, vortexed and the total reaction mixture (3mL) was incubated at dark for 30 min. Next, absorbance was read at 517 nm. Ascorbic acid (Merck, India) was used as a standard. This experiment was performed in triplicate.
DPPH free radical scavenging property, expressed in ascorbic acid equivalents and inhibition percentages, was determined by the following formula:38,39
H2O2 free radical scavenging capacity assay. Hydrogen peroxide (H2O2, SD Fine-Chem, Mumbai, India) free radical scavenging ability was measured according to the method of Ruch et al. (1989) in triplicate. The absorbance was taken at 230 nm. Gallic acid was used as standard.
H2O2 free radical scavenging capacity was expressed in gallic acid equivalents and inhibition percentages, which were calculated by the formula:40,41
The IC50 values of standards and leaves extracts were also calculated for above three free radical scavenging assays.
β-carotene bleaching test. The β-carotene bleaching test antioxidant activity (lipid peroxidation) of the aqueous and 70% ethanolic extracts was done by the method of Minh et al. with modifications42. In brief, β-carotene (2 mg) (HiMedia, India) was dissolved in 10 ml of chloroform (Merck, India) and then 1 ml of the chloroform solution was added to 20 μl of linoleic acid (HiMedia-GRM10250, India) and 200 mg of Tween-80 (HiMedia-PCT1513, India). The mixture was evaporated at 50°C, and then 50 ml oxygenated water was added and shaken to form an emulsion. A total of 0.012 ml of leaf extracts were mixed with 0.1 ml of the emulsion. The reactions were left at 50°C, and the absorbance was read at 492 nm. All reactions were read at zero time and every 15 min up to 180 min. This experiment was performed in triplicate. Lipid peroxidation inhibition (LPI) values were expressed using the following formula:
Where A0 and A00 is the absorbance measured at the beginning of the incubation for sample and control, respectively. At and Att are the absorbance measured after the incubation of 180 min for sample and control, respectively. Higher LPI value indicates the higher antioxidant activity42,43.
Polyphenol oxidase assay. The polyphenol oxidase (PPO) assay was carried out in triplicate by using the standard protocol of Esterbauer et al.44 A total of 500 mg of fresh leaves was crushed in 2 ml extraction medium containing HCl (Merck, India), sorbitol (Himedia-MB066, India) and NaCl. In the test cuvette, 2.5 ml phosphate buffer was mixed with 0.3 ml of catechol (Loba Chemie, UN281, India) solution. The spectrophotometer was set at 495 nm. Next, 0.2 ml of extract was added, and the change in absorbance was recorded every 30 seconds up to 5 min. PPO activity was expressed as a change in absorbance at 495 nm per minute/g fresh weight44,45.
Evaluation of antimicrobial activity. Antimicrobial activity was determined using the standard Kirby-Bauer disc diffusion method. A total of 40 μl of the extracts was placed into the paper disc with sterile double distilled water (70% ethanol used as a negative control). After diffusion of the extract, the plates were incubated at 37°C for 16-18 h. Then the zone of inhibition was measured14,15,46. Four gram-positive and four gram-negative bacteria (namely, Bacillus subtilis, Bacillus cereus, Staphylococcus aureus, Staphylococcus epidermidis and Escherichia coli, Vibrio cholera, Pseudomonas aeruginosa, Klebsiella pneumonia, respectively) were used for assessing antimicrobial activity against the negative control double distilled water and 70% ethanol. In the antimicrobial activity study, concentration (µg) of total bioactive compounds in 40 µl was also calculated from the extractive values of the particular solvents.
Evaluation of in vitro anti-diabetic activity (α-amylase inhibition assay). The α-amylase activity was measured using a colorimetric method with 3, 5-dinitrosalicylic acid (DNS) reagent. α-amylase (HiMedia, India) inhibition activity was measured using a standard protocol16–18. The absorbance was measured at 540 nm. Acarbose (Sigma-Aldrich, USA) was used as a positive control. The experimental measurements were performed in triplicate.
The percentage of α-amylase inhibition was determined by using the following formula:
The concentration of inhibitors required for inhibiting 50% of the enzyme activity under the assay conditions was presented as the IC50 value.
Evaluation of in vitro anti-arthritic activity (inhibition of protein denaturation). In vitro anti-arthritic activity of extracts was done using a standard protocol, assessing the percentage inhibition of protein denaturation. The experiment was carried out by taking sodium diclofenac (Tokyo Chemical Industry, Japan) as the standard. Absorbance was measured at 416 nm. The experimental measurement was performed in triplicate.
Protein denaturation inhibition percentages were determined by applying the following formula:
The IC50 values of standard and extracts were also calculated19–21.
Evaluation of in vitro anti-lithiatic activity (percentage dissolution of calcium oxalates). Evaluation of in vitro anti-lithiatic activity by percentage dissolution of calcium oxalates was done using the standard method22–24 in triplicate with slight modifications. The complete procedure is comprises three different steps, namely (i) Experimental kidney stone (calcium oxalate stones) preparation, (ii) Preparation of semi-permeable membrane from chicken eggs, and (iii) Estimation of calcium oxalate by titration method. All the experimental protocols are given below.
Experimental kidney stone (calcium oxalate stones) preparation
An equimolar (100 mM) solution of calcium chloride dehydrate (SRL-7065, India), in double-distilled water, and disodium oxalate (Merck, India) in 10 ml of 2 N H2SO4 (Merck, India) was kept to react with distilled water in a beaker. The resulting precipitate was calcium oxalate. The precipitate was freed from traces of H2SO4 using 10% ammonia solution and it was washed with double distilled water and dried at 70°C for 5 h.
Preparation of semi-permeable membrane from chicken eggs
Shell was removed chemically by placing the chicken eggs, obtained from a local market, in 10% Glacial acetic acid (Merck, India) for 48 h, which caused complete decalcification. The egg membrane washed thoroughly with distilled water, and put into a 10% ammonia solution and stored in a refrigerator at a pH of 7.4.
Estimation of calcium oxalate by titration method
The dissolution percentage of calcium oxalate was evaluated by taking precisely 10 mg of calcium oxalate and 10 mg of the lyophilized extracts/standard (1:1 ratio), packed together in the semi-permeable membrane of the egg. This was allowed to suspend in a conical flask containing 100 ml of 0.1 M Tris buffer (SRL-2049170, India). The 1st group was set as blank containing only 10 mg of calcium oxalate. The 2nd group was established as a positive control containing 10 mg of calcium oxalate along with 10 mg of the standard drug cystone (The Himalaya Drugs Company, Bangalore, India). The 3rd and 4th groups, along with 10 mg of calcium oxalate, contained aqueous and 70% ethanol extracts, respectively. The conical flasks of all the groups were placed in an incubator and preheated to 37°C for 3 h. The contents of semi-permeable membranes were removed from each group into separate test tubes, and 2 ml of 1 N H2SO4 was added to each test tube and titrated with 0.9494 N KMnO4 (Avantor, Maharashtra, India), till a light pink colour endpoint was obtained. In the calculation 1 ml of 0.9494 N KMnO4 is counted as equivalent to 0.1898 mg of 4 Calcium. The amount of remaining undissolved calcium oxalate is subtracted from the total quantity used in the experiment, in the beginning, to know the total amount of calcium oxalate dissolved by various solvent extracts22–24.
Evaluation of in vitro cytotoxicity. A healthy male Wistar rat was purchased from Chittaranjan National Cancer Research Institute, Kolkata, West Bengal and maintained subsequently for the experiments were fed with hind liver pellet or equivalent and water ad libitum in 12 h light and dark cycle and at 30°C throughout the experimental period. The experiments were performed under the institutional ethical permission (IAEC/CU/BIOCHEM/SM (1) dated 14.12.2012) and followed the ‘Principles of Laboratory Animal Care’ (NIH publication no. 85-23, revised in 1985). The experiment was performed in triplicate. To conduct the study, a standard rat PBMC isolation technique47 and Cell Viability Assay48 was used. PBMC isolation techniques and Cell Viability Assay are given below in details.
Leaf extract preparation
A total of 100 mg dry weights of each plant leaves were mixed, vortexed in 1 ml of double distilled water and 70% ethanol separately, left overnight, centrifuged and supernatant taken.
Rat PBMC isolation
A healthy male Wister rat (160 g) was deeply anaesthetized with sodium pentobarbital (50 mg/kg body weight) followed by thoracotomy. Terminal cardiac puncture was made in ventricle using an appropriate sterile needle and blood drawn slowly and collected in PBS-EDTA solution, diluted by 1X PBS in 1:1 ratio and laid on Histopaque-1077 (HiMedia, India), a density gradient cell separation medium of ficoll and sodium diatrizoate was fixed and adjusted with a density of 1.077 g/ml, an equal volume of media and diluted blood. This Histopaque overlaid with diluted blood was centrifuged at 300g at 25°C for 30 mins. The RBCs were a thick red precipitate at the bottom of centrifuge tube, whereas the blood PBMC were found at the interface of Histopaque and the top layer of serum. PBMCs from the interphase were collected, washed twice with PBS, resuspended in 1 ml of DMEM media and this placed in Neubauer Improved Chamber (Marienfeld, Germany) and observed under Microscope Nikon Eclipse TS 100 (Nikon Corporation, Japan) to measure cell concentration.
Cell viability assay
A cell viability assay has been done with Trypan Blue. Cells were then laid in 12 well plates at a concentration of 3.6x10⁷ cells/ml with a volume of 1 ml at each well except media (DMEM) control containing 1% penicillin-streptomycin (P/S, Antibiotic Antimycotic Solution 100X, Himedia, India) along with 10% FBS and incubated in the CO2 incubator for 24 h in 5% CO2 humified environment at 37ºC (CO2 Incubator Galaxy 48S, New Brunswick, Germany). Next, 10, 5 and 2.5 µl of each of the extracts (different dose of aqueous and ethanolic extracts) were added to the wells except controls and continued in culture for another 48 hrs. Culture plates were then taken out and treated with 10 μl of 0.4% freshly prepared trypan blue solution for 5 mins and readily observed under Nikon Eclipse TS 100 Inverted Phase-contrast Microscope and documented by CCD Camera (DS-Fi2-U3) and NIS-BR Software (Nikon Corporation, Japan).
All the experimental measurements were performed in triplicate (except HPLC-DAD and antimicrobial activity study) and expressed as the average of the three analyses ±standard deviations (SD). The correlation coefficient between variables, means, standard deviations, standard errors, standard curve, IC50 values and one-way ANOVA followed by Bonferroni’s post hoc test was calculated by using MS Excel 2007 Software (Microsoft Corporation, Redmond, WA, USA). Figures are prepared in Origin Pro 8 Software (Northampton, MA, USA). A P-value <0.05 was considered as statistically significant.
The highest concentration of polyphenolics was obtained from EH aqueous and 70% ethanolic extracts (180.59±2.99 and 166.47±3.03 mg GAE/g dry weight, respectively). The lowest concentration was observed in TP aqueous and 70% ethanolic extracts (127.52±1.26 and 80.51±1.21 mg GAE/g dry weight, respectively) (Figure 1). The highest concentration of flavonoids was obtained from EH aqueous and 70% ethanolic extracts (98.05±1.30 and 77.39±1.79 mg QE/g dry weight, respectively). The lowest concentration was observed in TP aqueous and 70% ethanolic extracts (46.78±1.34 and 34.47±0.81 mg QE/g dry weight, respectively) (Figure 2). The highest tannin concentration was obtained from EH aqueous and 70% ethanolic extracts (59.21±0.15 and 42.50±0.37 mg TAE/g dry weight, respectively). The lowest concentration was observed in TP aqueous and 70% ethanolic extracts (14.83±0.37 and 11.61±0.32 mg TAE/g dry weight, respectively) (Figure 3).
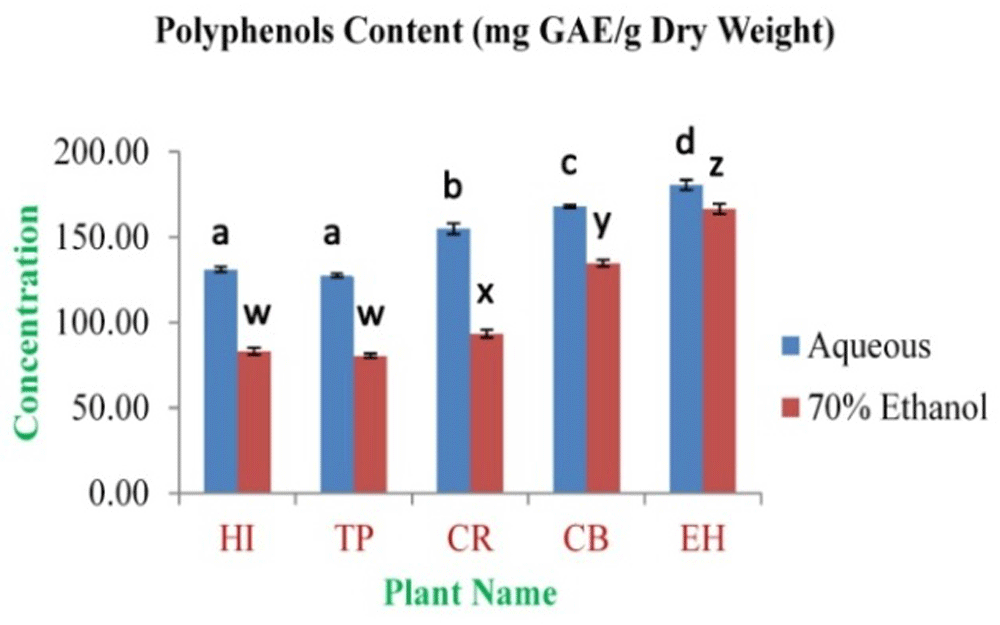
In the figure different lower case letters (a, b, c, d, e, x, y, z, w, v) in the bars indicates significant differences among means (P<0.05). The blue and red colour bars indicate the aqueous and 70% ethanolic extracts, respectively. X-axis denotes the plant name and Y-axis denotes the concentrations of total polyphenols contents (mg Gallic Acid Equivalent/g Dry Weight).
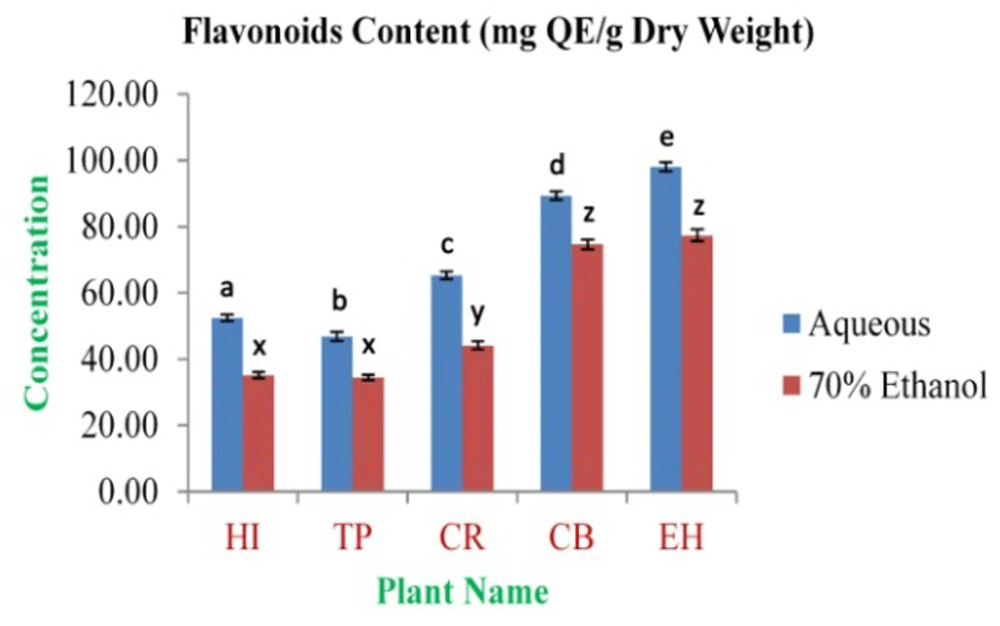
In the figure different lower case letters (a, b, c, d, e, x, y, z, w, v) in the bars indicates significant differences among means (P<0.05). The blue and red colour bars indicate the aqueous and 70% ethanolic extracts, respectively. X-axis denotes the plant name and Y-axis denotes the concentrations of total flavonoids contents (mg Quercetin Equivalent/g Dry Weight).
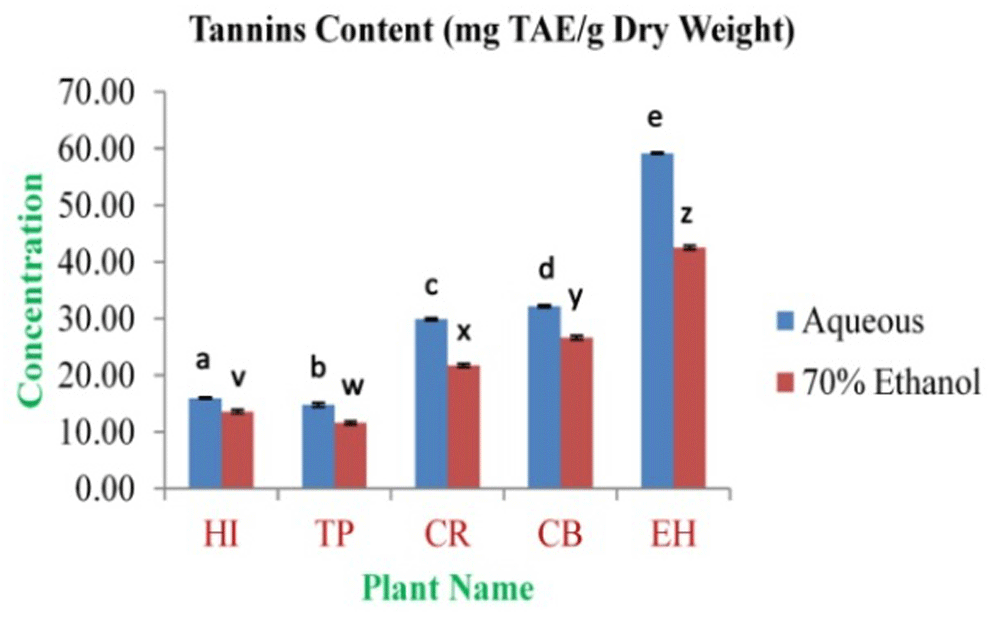
In the figure different lower case letters (a, b, c, d, e, x, y, z, w, v) in the bars indicates significant differences among means (P<0.05). The blue and red colour bars indicate the aqueous and 70% ethanolic extracts, respectively. X-axis denotes the plant name and Y-axis denotes the concentrations of total tannins contents (mg Tannic Acid Equivalent/g Dry Weight).
The highest concentration of alkaloid content was observed in HI aqueous and 70% ethanolic extracts (0.148±0.006 and 0.171±0.004 mg CE/g dry weight, respectively). The lowest concentration was observed in CR aqueous and 70% ethanolic extracts (0.017±0.006 and 0.024±0.003 mg CE/g dry weight, respectively) (Figure 4). The highest concentration of cardiac glycosides content was observed in EH aqueous and HI 70% ethanolic extracts (2.20±0.20 and 3.86±0.27 mg DE/g dry weight, respectively). The lowest concentration was obtained from TP aqueous and CB 70% ethanolic extracts (0.23±0.04 and 1.70±0.09 mg DE/g dry weight, respectively) (Figure 5). The total saponin content for these medicinal herbs dried powdered leaves 20% ethanolic extracts was estimated. The highest concentration was observed in EH (6.93±0.42%). The lowest concentration was observed in TP (3.50±0.36%) (Figure 6).
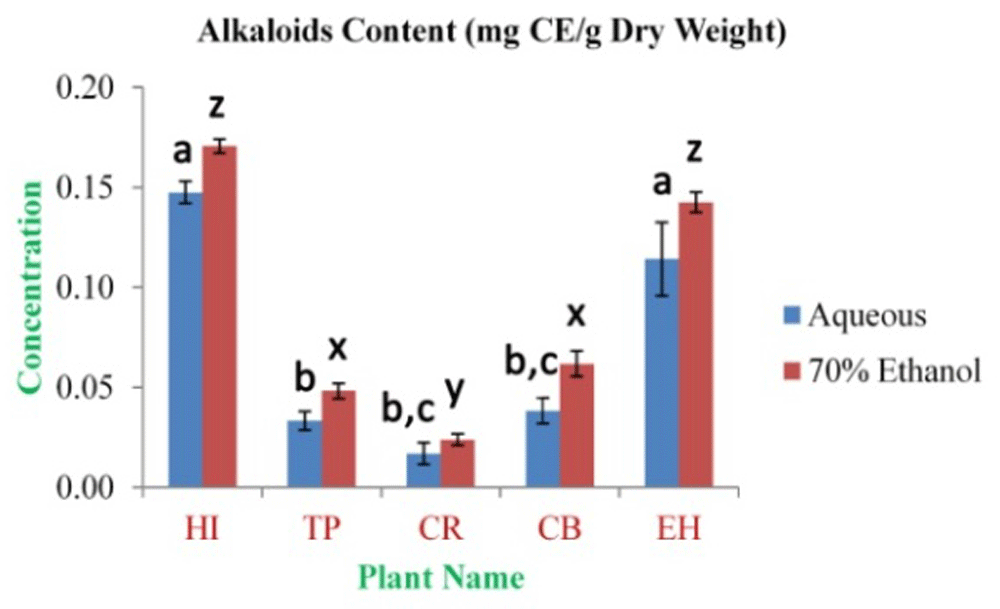
In the figure different lower case letters (a, b, c, d, e, x, y, z, w, v) in the bars indicates significant differences among means (P˂0.05). The blue and red colour bars indicate the aqueous and 70% ethanolic extracts, respectively. X-axis denotes the plant name and Y-axis denotes the concentrations of total alkaloids contents (mg Caffeine Equivalent/g Dry Weight).
In the figure different lower case letters (a, b, c, d, e, x, y, z, w, v) in the bars indicates significant differences among means (P˂0.05). The blue and red colour bars indicate the aqueous and 70% ethanolic extracts, respectively. X-axis denotes the plant name and Y-axis denotes the concentrations of total cardiac glycosides contents (mg Digoxin Equivalent/g Dry Weight).
In the figure different lower case letters (a, b, c, d, e, x, y, z, w, v) in the bars indicates significant differences among means (P˂0.05). The gray colour bars indicate the 20% ethanolic extracts. X-axis denotes the plant name and Y-axis denotes the concentrations of total saponin contents (%).
The analysis of HPLC-DAD profile obtained from the plants leaves 70% ethanolic extracts identified ten bioactive phenolic compounds GA, CH, CHA, CA, SYA, pCA, SIA, CM, QE and KMP (Figure 7 and Extended data, Figures S1, S2, S3, S4)49. Among these three compounds were present in all the extracts (chlorogenic acid, coumaric acid and coumarin). In EH and TP highest ten compounds were identified. In HI lowest six compounds were identified. In EH six compounds were found in the highest amount, and these are GA (83.258 ng/µl), CH (122.149 ng/µl), SYA (9.487 ng/µl, pCA (10.017 ng/µl, SIA (297.315 ng/µl, CM (3.719 ng/µl). In each of TP and CR two phenolic acids were found in the highest amount and these are CHA (6.405 ng/µl), KMP (5.241 ng/µl) and CA (23.006 ng/µl), QE (15.099 ng/µl), respectively. Sinapic acid was the most abundant phenolic acid present in all the leaves extracts as well as it is found in the highest amount in EH extract. Availability of coumarin among these standard phenolics is found minimum in all the extracts. The HPLC-DAD profile showed in chromatogram representation and in Table 1.
Polyphenolic compounds were separated by Phenomenex-C18 (2)-column, the Diode Array Detector was set at 280 nm; the mobile phase consisted of 3% acetic acid water and acetonitrile. The flow rate was 0.9 ml/min in gradient conditions. In the figure X-axis denotes the units of time (minutes) i.e. retention time (tR) and Y axis denotes the intensity of absorbance (milli-Absorbance units) or concentration. Ten compounds were detected in chromatogram.
In the present study, the maximum inhibition percentage of ABTS free radical scavenging assay was found to be 86.10±0.22% and 79.19±0.36% for EH aqueous and 70% ethanolic extract, respectively. The minimum is 55.33±0.64% and 37.57±0.80% for CR and TP in aqueous and 70% ethanolic extract (Figure 8 and Extended data, Figure S5)49, respectively; the inhibition percentage for standard ascorbic acid was found to be 98.29% at 0.5 mg/ml of concentration.
In the figure different lower case letters (a, b, c, d, e, x, y, z, w, v) in the bars indicates significant differences among means (P˂0.05). The blue and red colour bars indicate the aqueous and 70% ethanolic extracts, respectively. X-axis denotes the plant name and Y-axis denotes the inhibition percentages by the extracts (%).
The study reveals that the maximum inhibition percentage of DPPH free radical scavenging assay was 86.75±0.56% and 83.07±0.25% for the EH aqueous and 70% ethanolic extract, respectively. The minimum was 71.02±0.07% and 68.34±0.41% for CB and HI in aqueous and 70% ethanolic extract (Figure 9 and Extended data, Figure S6)49, respectively; this compared with the percentage inhibition of ascorbic acid which was 92.77% at 0.5 mg/ml of concentration in the present study.
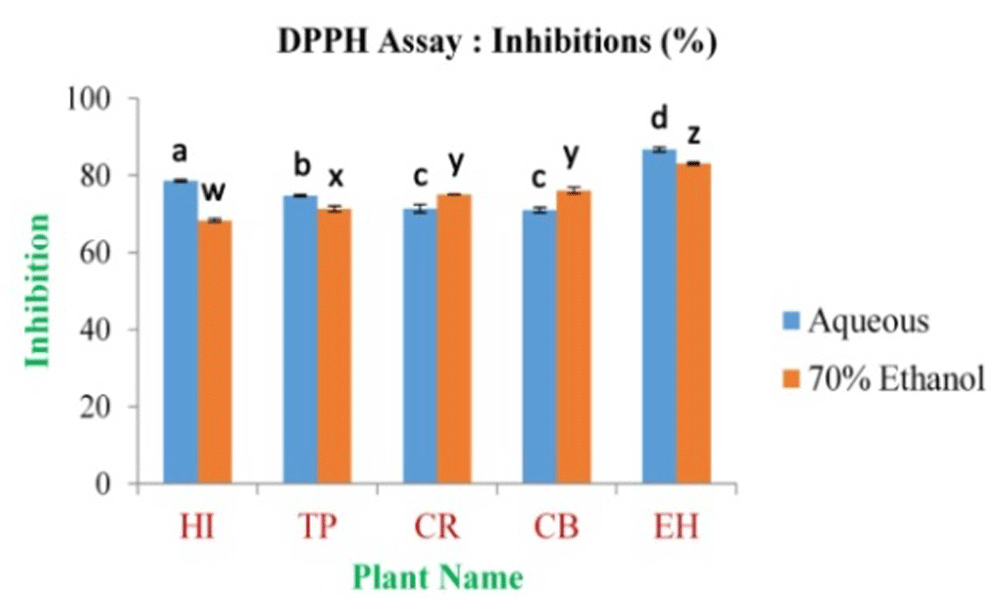
In the figure different lower case letters (a, b, c, d, e, x, y, z, w, v) in the bars indicates significant differences among means (P˂0.05). The blue and red colour bars indicate the aqueous and 70% ethanolic extracts, respectively. X-axis denotes the plant name and Y-axis denotes the inhibition percentages by the extracts (%).
The maximum inhibition percentage of H2O2 free radical scavenging assay was found to be 85.92±0.31% and 84.83±0.46% for CB aqueous and EH 70% ethanolic extract, respectively. The minimum is 56.05±0.48% and 56.57±0.36% for TP and HI in aqueous and 70% ethanolic extract (Figure 10 and Extended data, Figure S7)49, respectively; the inhibition percentage for standard Gallic acid was 95.10% at 0.5 mg/ml of concentration.
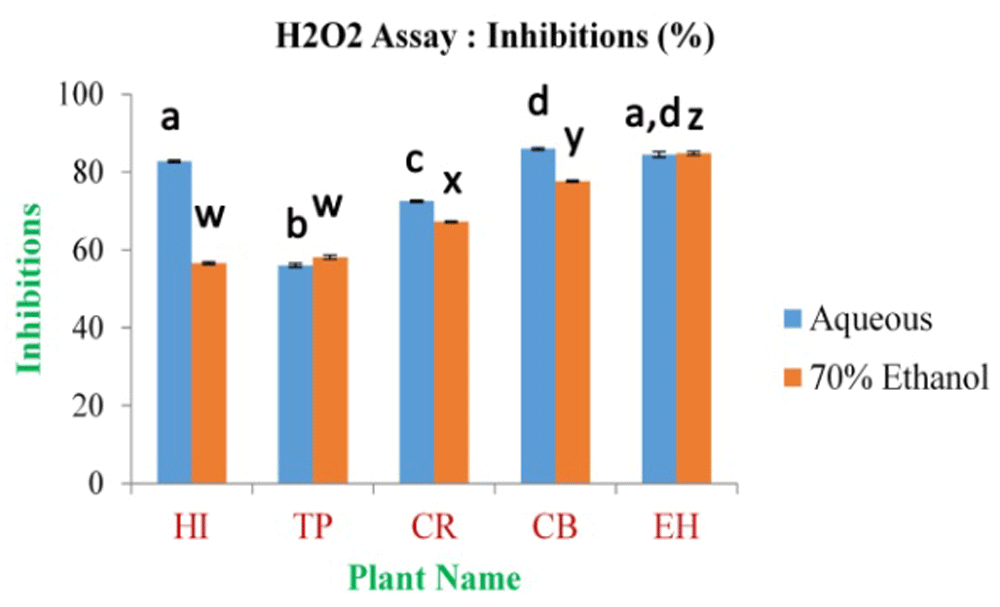
In the figure different lower case letters (a, b, c, d, e, x, y, z, w, v) in the bars indicates significant differences among means (P˂0.05). The blue and red colour bars indicate the aqueous and 70% ethanolic extracts, respectively. X-axis denotes the plant name and Y-axis denotes the inhibition percentages by the extracts (%).
In this investigation, the antioxidant activity of lipid peroxidation (LPI) by ß-carotene bleaching test concluded that the highest activity was observed in case of EH aqueous and TP 70% ethanolic extracts, and it is 62.58±6.00% and 63.89±5.87%, respectively. The lowest activity was observed in the case of TP aqueous and HI 70% ethanolic extracts, and it is 25.85±7.51% and 20.44±1.24%, respectively (Figure 11).
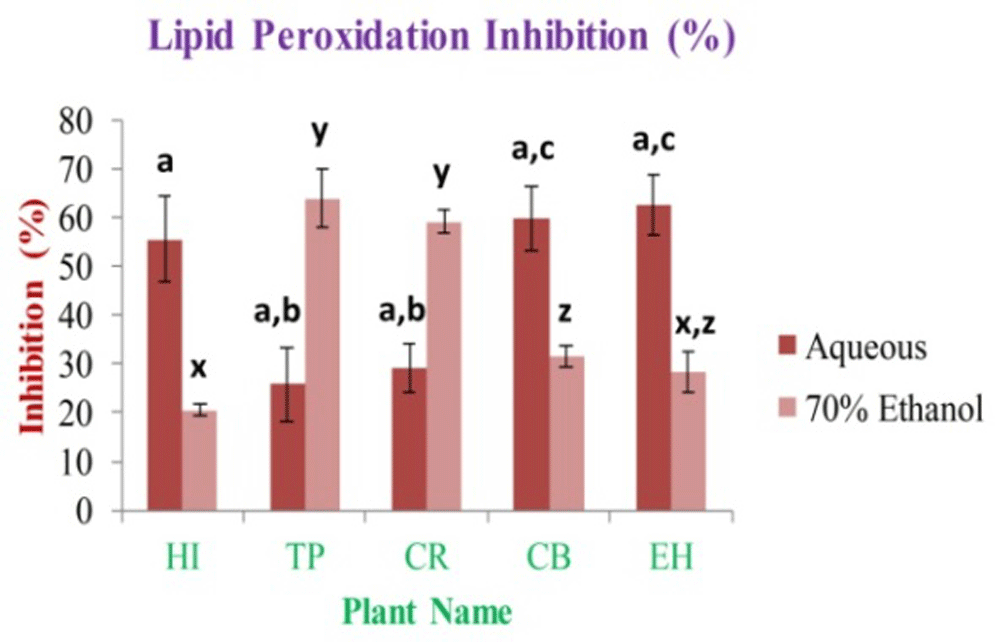
In the figure different lower case letters (a, b, c, d, e, x, y, z, w, v) in the bars indicates significant differences among means (P˂0.05). The red and pink colour bars indicate the aqueous and 70% ethanolic extracts, respectively. X-axis denotes the plant name and Y-axis denotes the inhibition percentages by the extracts (%).
In the study, the enzyme PPO activity assay concluded that the highest and lowest activity was observed in CB extracts (9.67±6.39) and CR extracts (4.77±0.32), respectively, in terms of change in absorbance at 495 nm per minute/g of fresh weight, which is greater than the control used in the PPO activity assay, i.e. 3.83±3.35 (Figure 12).
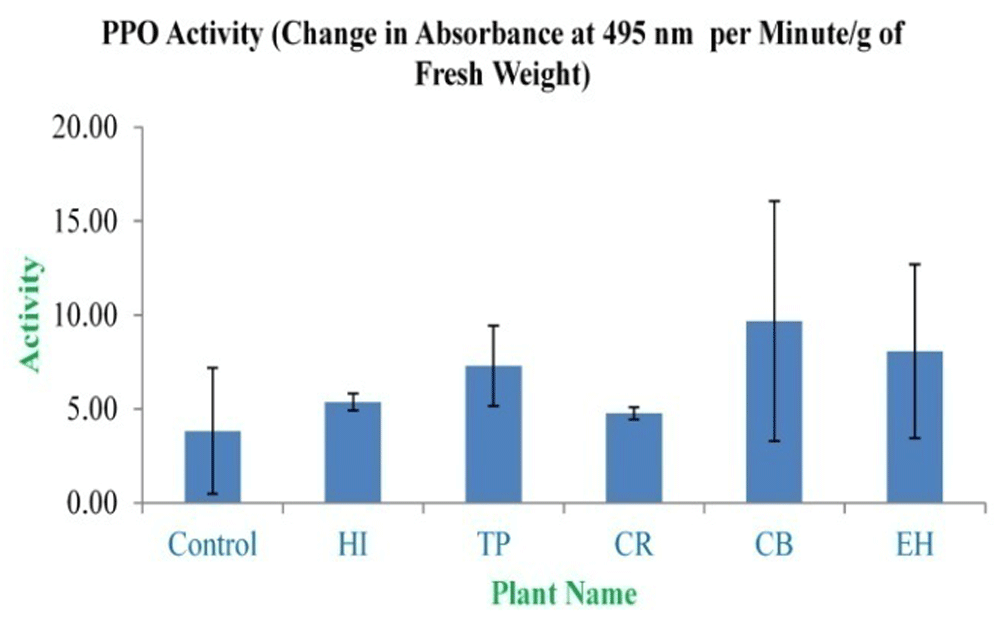
In the figure the bars indicates no significant differences among means (P˃0.05). X-axis denotes the plant name and Y-axis denotes the change in absorbance at 495 nm per minute/g of fresh weight by the extracts (%).
Zone of inhibition shown by aqueous and 70% ethanolic leaves extract indicated the presence of high antimicrobial activity. EH aqueous extracts showed the highest zone of inhibition in comparing with all the extracts. TP and CR 70% ethanolic extracts had given better antimicrobial properties than other leaves 70% ethanolic extracts. SE strains have not given any zone of inhibition in case of all the extracts (Table 2 and Extended data, Figures S8, S9, S10, S11)49. The concentration (µg) of bioactive compounds in 40 µl which was the given dose for the assay in antimicrobial activity study was determined from the extractive values of the aqueous and 70% ethanolic leaf extracts (Extended data, Table S1)49.
In the current study, different concentrations of extract were selected for the in vitro assay between 10 mg/ml and 0.0195 mg/ml. Based on the results, the maximum α-amylase inhibition percentage was found to be 72.19±1.26% and 68.14±0.71% for EH aqueous and 70% ethanolic extract, respectively. The minimum inhibition activity is 52.54±1.94% and 50.48±0.82% for TP aqueous and 70% ethanolic extract (Figure 13), respectively; this compared to an inhibition percentage for standard acarbose of 99.00% at 10 mg/ml of concentration.
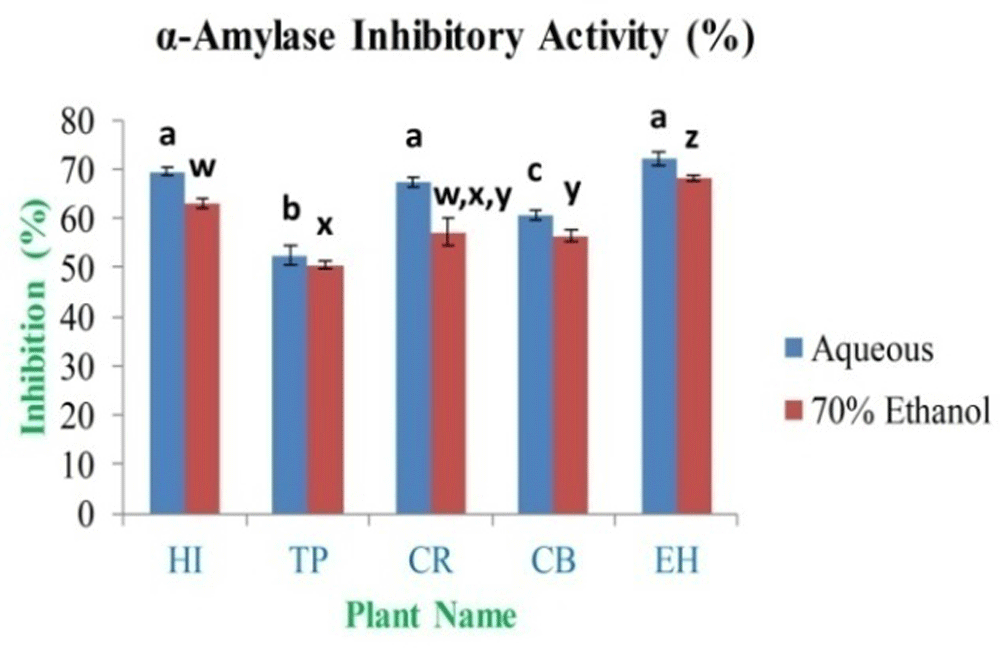
In the figure different lower case letters (a, b, c, d, e, x, y, z, w, v) in the bars indicates significant differences among means (P˂0.05). The blue and red colour bars indicate the aqueous and 70% ethanolic extracts, respectively. X-axis denotes the plant name and Y-axis denotes the α-amylase inhibition percentages by the extracts (%).
The anti-arthritic activity of aqueous and 70% ethanolic extracts was determined by the in vitro models, i.e. inhibition of protein denaturation. The various concentrations of extracts were selected for the assay between 1 mg/ml and 0.00196 mg/ml. The study observed that the maximum inhibition percentage was 70.36±0.69% and 74.54±0.75% for CR aqueous and 70% ethanolic extracts, respectively. The minimum inhibition activity is 52.28±0.91% and 53.48±0.89% for TP aqueous and 70% ethanol extract (Figure 14), respectively, as compared to inhibition percentage for standard diclofenac sodium was 97.25% at 1 mg/ml of concentration.
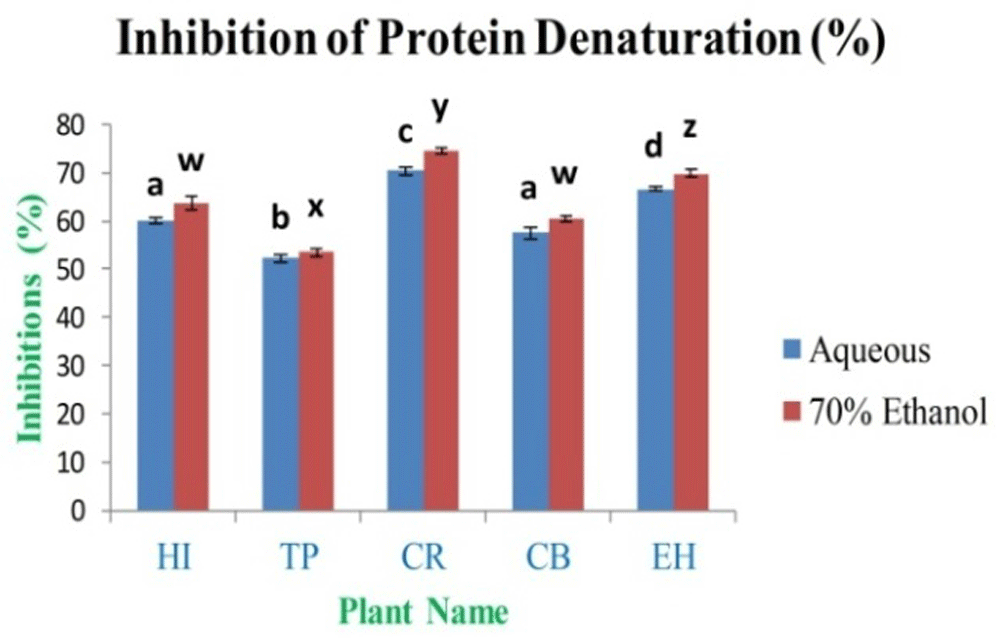
In the figure different lower case letters (a, b, c, d, e, x, y, z, w, v) in the bars indicates significant differences among means (P˂0.05). The blue and red colour bars indicate the aqueous and 70% ethanolic extracts, respectively. X-axis denotes the plant name and Y-axis denotes the inhibition percentages of protein denaturation by the extracts (%).
In the research investigation, titration was used to assess the in vitro anti-lithiatic property of aqueous and 70% ethanolic extracts using a calcium oxalate dissolution assay. Based on the results obtained in the study, the highest dissolution percentage of calcium oxalate was 79.98±0.95% and 74.41±4.43% for EH aqueous and CB 70% ethanolic extract, respectively. The lowest is 46.37±3.22% and 10.45±1.78% for TP aqueous and 70% ethanolic extract (Figure 15), respectively. The dissolution percentage of calcium oxalate for the standard drug cystone was 86.42±3.57% at 1 mg/ml of concentration.
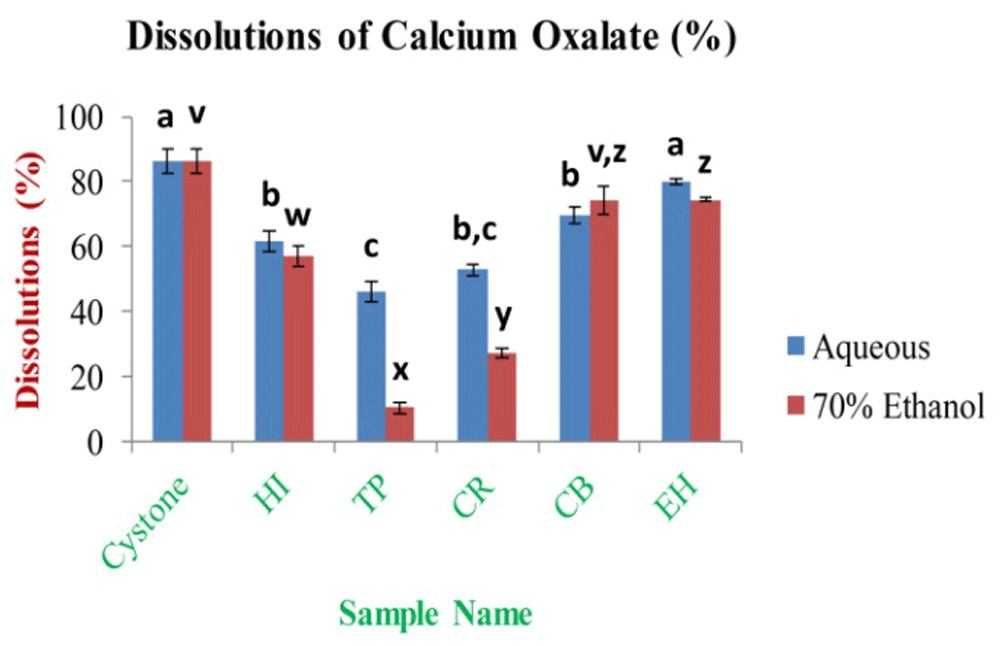
In the figure different lower case letters (a, b, c, d, e, x, y, z, w, v) in the bars indicates significant differences among means (P˂0.05). The blue and red colour bars indicate the aqueous and 70% ethanolic extracts, respectively. X-axis denotes the sample name and Y-axis denotes the percentage (%) dissolution of calcium oxalate by extracts.
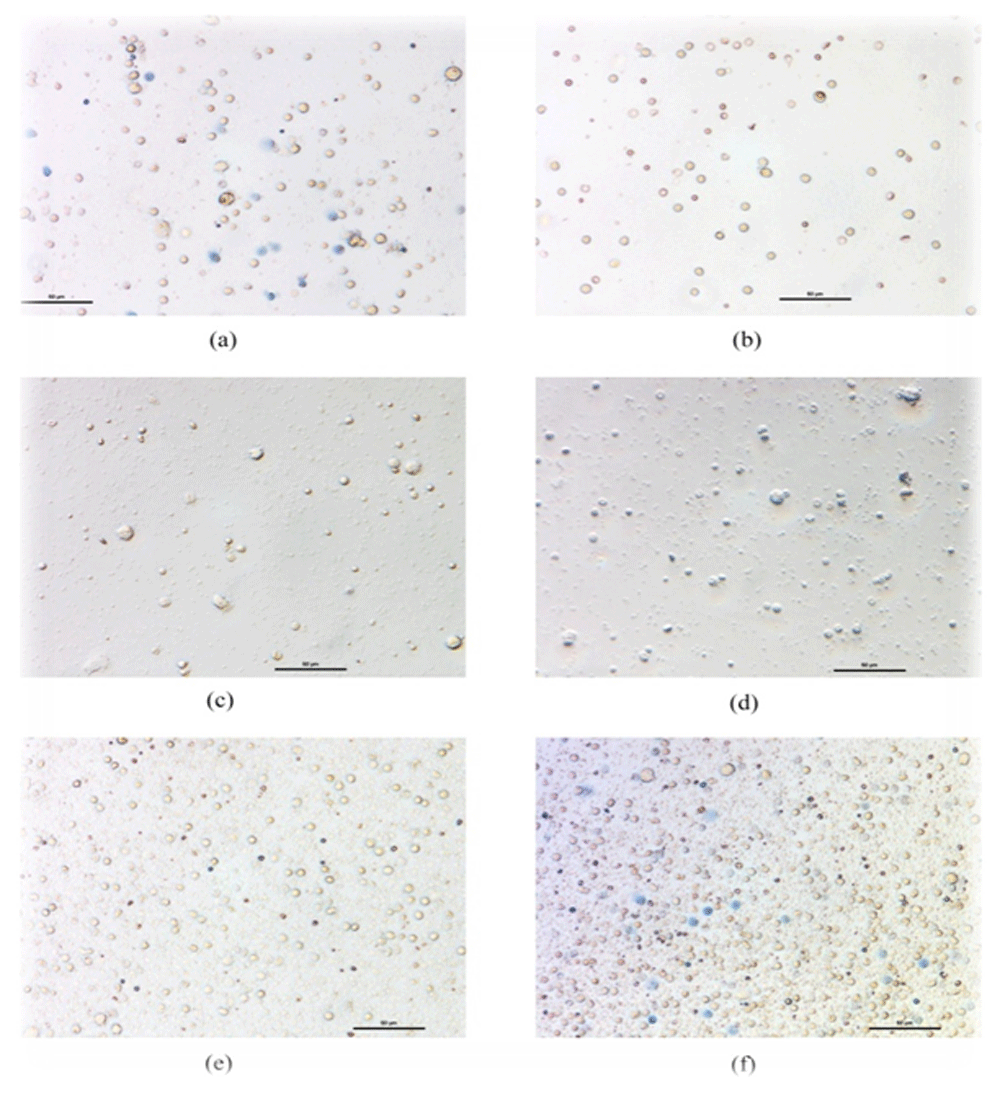
a. Cell control after 48 hrs of seeding; b. Cells after seeding with drugs; c. EH aqueous drug effect after 48 hrs; d. EH 70% ethanolic drug effect after 48 hrs; e. CR aqueous drug effect after 48 hrs; f. CR 70% ethanolic drug effect after 48 hrs; The given dose of extracts is 10 μl.
In the trypan blue exclusion assay, the absolute count of total cells in each field vs cells with characteristic trypan blue stains were counted for each plant extract-treated group. In our study, 2.5 µl and 5 µl dose of crude drugs did not show any cytotoxic effects towards PBMC. However, 10 µl of the dose showed the effects (Figure 16a–f).
The dose-dependent (10 µl of crude plant extract) cell viability assay elicited a 10-12% mortality rate of PBMC in 48 hrs of culture in the control; only the aqueous extracts of CR showed higher mortality than control, with other aqueous extracts eliciting lower mortality rates, showing some nontoxic or cytoprotective properties for PBMC or immune cells (Figure 17). However, the EH aqueous extract showed maximum cytoprotectivity showing a mortality of ~2.5%. EH 70% ethanolic extracts showed cytoprotectivity (~4%) nearly comparable to its aqueous soluble counterpart. The 70% ethanolic extracts showed higher mortality in PBMC. Particularly, CR and TP 70% ethanolic extracts are much cytotoxic, where TP found over two-fold cytotoxicity than control. Both extracts of CB showed cytoprotectivity compared to the control.
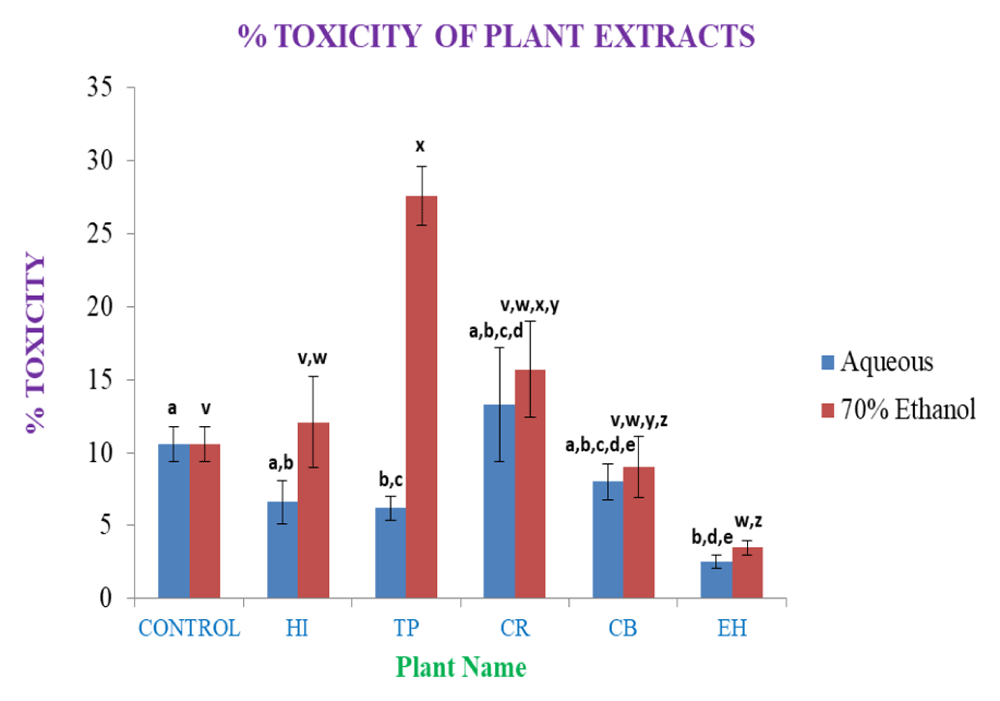
In the figure different lower case letters (a, b, c, d, e, x, y, z, w, v) in the bars indicates significant differences among means (P˂0.05). The blue and red colour bars indicate the aqueous and 70% ethanolic extracts, respectively. X-axis denotes the sample name and Y-axis denotes percentage (%) of toxicity of the plants leaves extracts towards PBMC at the dose of 10μl.
From the above results, it is observed that except CR aqueous extracts the aqueous medium is overall cytoprotective. Most of the drugs in this form are less cytotoxic than control; hence it is much preferred as a medium in pharmaceutical application purposes. EH aqueous and 70% ethanolic extracts has been found much more cytoprotective to PBMCs. Hence it can be used to treat against immune disorders after necessary processing.
Raw data of each experiment performed are available as Underlying data50.
The oxidation reactions and free radical production lead to some oxidative stress-related disorders such as diabetes, arthritis, urolithiasis and cancer. The activity of phenolic compounds against oxidative stress-related mechanism can have substantial therapeutic applications in the pharmaceutical and nutraceutical industry12,34,51–54.
Flavonoids are the category of plant secondary metabolites with high antioxidant, antimicrobial and chelating activities. Antioxidant activities of flavonoids depend on the structure and substitution pathways of hydroxyl groups. The antioxidative properties of flavonoids classes are due to various reaction mechanisms, such as scavenging of free radicals, chelation of metal ions (e.g. iron and copper), and inhibition of enzymes which are responsible for free radical production. Depending on their specific structure, it can inhibit or regulate all the possible ROS, which can cause cellular damages. Previous studies have concluded the protective ability of flavonoids against various diseases53,55,56.
Tannins are found in the stem and barks of various plants rather than in the leaves. The tannins showed excellent antioxidant, antimicrobial and anti-cancer activities. These are astringent, bitter plant polymeric compound which can be capable of tanning leathers, and can sediment proteins, amino acids, alkaloids and nitrogenous substances57. The tannin-protein complex can provide persistent antioxidant and antimicrobial properties53,56,57.
Alkaloids are essential secondary plant metabolites, and have extensive applications in present-day herbal formulations as these compounds have huge potentiality as an antimicrobial agent29,56.
The amount of cardiac glycoside found in extracts is minor compared to larger quantities that have been reported in various plant leaves. This signifies that the leaves are not toxic as glycosides act as sodium-potassium ATPase inhibitor leading to cell death. Cardiac glycosides are used for the treatment of different oxidative stress-related cardiac diseases such as congestive heart failure and cardiac arrhythmia11,30.
Saponin is an amphipathic (hydrophilic) glycoside moiety with lipophilic triterpene or steroid derivatives58. This is an important bioactive compound which plays a vital role to prevent antimicrobial activity and other biological disorders31,32. In the study, polyphenolic compounds, flavoinoids, tannins, alkaloids and cardiac glycosides contents showed very significant (p-value <0.01) presence in both the extracts as well as they are positively and variably correlated (Tables S2 and S3) with each other and antioxidant properties, too.
In the current investigation, a simple, accurate, and reproducible online HPLC-DAD method has been used and validated for the identification and quantification of phenolics. Phenolics, especially phenolic acids and flavonoids, are conventional natural products found in plants that have significant antioxidant and anti-inflammatory activity. ROS are produced by various metabolic activities and is a significant contributor to many chronic and oxidative stress-related diseases. Phenolic acids have been demonstrated as potent scavengers of ROS. These are sub-classified as benzoic acid and cinnamic acid backbone structure containing seven (C6-C1) and nine (C6-C3) carbon atoms, respectively. Hydroxybenzoic acid derivatives such as gallic acid, syringic acid and cinnamic acid derivatives like caffeic acid, chlorogenic acid, sinapic acid, p-coumaric acid are widely available in plants33,34,59,60. Masek et al., concluded that caffeic acid is the predominantly and widely available phenolic acid, and it exhibits antioxidant and iron-chelating abilities which are better than p coumaric acid61. Cinnamic acid derivative sinapic acid exhibits potent antioxidant, antimicrobial and anti-arthritic activities62. Katada et al. showed that hydroxycinnamic acid derivative chlorogenic acid act as a dietary supplement which is highly effective in oxidative stress-related diseases such as arthritis and high blood pressure63.
ABTS free radical scavenging assay serve as assessing the antioxidant property. The IC50 analysis is used for estimating the activity of an inhibitor. IC50 analysis showed that the standard ascorbic acid is required 0.237 mg/ml, whereas leaf extracts required a higher amount to reach at IC50 (Extended data, Table S4)49. ABTS assay is a free radical cation decolourization assay. In the study, potassium persulfate was used to give a stable form of ABTS radical cation35–37.
In the DPPH assay, IC50 analysis showed that the standard ascorbic acid is required 0.257 mg/ml, whereas leaves extracts required a higher amount to reach at IC50 (Extended data, Table S5)49. DPPH is a highly used free radical to determine the free radical scavenging activity of natural antioxidants. This free radical scavenging assay is based on the reduction of DPPH radicals in methanol in the presence of hydrogen-donating antioxidant due to the formation of the non-radical shape of DPPH-H. DPPH is unaffected by side reactions, like metal ion chelating and enzyme inhibitions and it is counted as one of the benefits of it. In this method, a change in colour from purple to yellow happens, and this is proportional to the concentration and radical scavenging capacity of the extracts in the form of hydrogen donating capability4,39,46,53,54.
In the H2O2 radical scavenging assay, IC50 analysis showed that the standard gallic acid is required 0.247 mg/ml, whereas extracts required a higher amount for IC50 (Extended data, Table S6)49. H2O2 becomes toxic to the cell because it is rapidly decomposed into oxygen and water and gives rise to the hydroxyl radical, which can initiate lipid peroxidation mechanisms by obtaining hydrogen atoms from unsaturated fatty acids and cause DNA strands damages. The hydroxyl radical is short-lived severely reactive free radicals, formed in the biological systems, capable of damaging a wide range of biomolecules located in the living cells through diffusion-limited reaction. Its removal is necessary for the protection of food, too4,11,12,40,41.
It has been well known that carotenoids class of compounds undergo bleaching, i.e. lose their colour, when exposed to free radicals or to oxidative species. This entire mechanism occurs by the addition of the conjugated double bond which is present in the available reaction system either by the help of cleavage or by adding one of the double bonds of molecules. This cleavage occurrence can be identified by analyzing the products that are created, which are primarily carbonyls or epoxides43,44. Membrane lipids are rich in unsaturated fatty acids which are most susceptible to oxidative mechanisms. The free radical chain reaction is widely accepted as a common process of lipid peroxidation, and it is thought that the inhibition of lipid peroxidation is caused by antioxidants due to their free radical scavenging properties13,55. Flavonoids, aglycones and glycosides showed good lipid peroxidation activities by the ß-carotene bleaching test55. Phytomolecules such as saponin, flavonoids and tannins found to protect against lipid peroxidation64.
The study showed the presence of significant level of antioxidants in the plant extracts (aqueous and 70% ethanol). The study also showed the variable degrees of correlation (Extended data, Table S3)49 between the phytochemicals content and antioxidant activity. The results of the different radical scavenging assays are found to be positively correlated (Extended data, Table S7)49 with each other, signifying the interplay between different antioxidants and their mode of action in combating cellular stress.
From previous studies and reports, it was observed that there is a positive correlation exists between antioxidant property and the bioactive compounds. It can be concluded that the bioactive compounds appear to be responsible for the significant (p-value <0.01) antioxidant property of both the solvents extracts12,13. The observation of the investigations agrees with the point that the ethnomedicinal plants are the principal source of therapeutically and nutritionally used natural antioxidants52. The study findings conclude that the aqueous extracts have maximum antioxidant activity in comparison with the 70% ethanolic extracts. EH has huge and intense potentiality towards pharmaceutical and nutraceutical importance due to the presence of high polyphenolic compounds which is comparable with the green and black teas65. Using the above in vitro test, the results suggested that EH exhibited potent antioxidant activity, and it can serve as a new source of the natural antioxidant agent12,66.
PPO is a widely distributed copper-containing enzyme in plants. It is known to be responsible for the enzymatic browning reaction occurring during the handling, storage and processing of the fruits and vegetables. The two molecular oxygen occurs in the two separate reactions when PPO shows the activity. The PPO enzyme catalyzes the oxidation of phenolic compounds into highly reactive quinones. Polymerization of PPO-derived quinones causes the postharvest browning of cut or bruised fruit, but the native physiological functions of PPOs in undamaged, intact plant cells are not well understood44,45,67,68. The p-value <0.05, which showed no significant level of enzyme PPO activity in the experimental extracts. In the present study, variable degrees of correlation (Extended data, Table S8, S9 and S10)49 are found between phytochemicals and free radical scavenging assay with the PPO activity.
The complete results obtained from the antimicrobial activity study indicated that aqueous extracts had high antimicrobial property than the 70% ethanolic extracts, which supports the previous study of Abubakar, 200969. The presence of bioactive metabolites in the extracts such as flavonoids, tannins, saponins, glycosides, alkaloids, phenolics, steroids and anthraquinone as reported earlier is likely to be responsible for the good antimicrobial property. Polyphenols and other bioactive molecules regulate the synthesis of nucleic acids of both Gram-negative and Gram-positive bacteria; that is why the proper zone of inhibition has been observed in the assay13,56,70. Perumal showed that plants with high caffeic acid levels had shown significant antimicrobial activity. In the study, 70% ethanolic extracts of CR and TP contains the highest amount of caffeic acid, and these two leaves extracts showed better antimicrobial activities which support the previous study as well71. The antimicrobial activity also depends on the ROS formation. Balanced state of the body interrupted by pathological situations due to overproduction of ROS and comparatively low amount of endogenous antioxidants in the body. It results in the reaction between ROS and intra and extracellular species leading to the emergence of oxidative stress-related disorders and pathogenesis. To control oxidative stresses, it is necessary to maintain the balance between ROS and antioxidants by administering exogenous natural antioxidants such as hydroxycinnamic acids46,62.
The in vitro anti-diabetic property evaluation of the plants leaves extracts was assessed by inhibition of polysaccharides degrading enzyme α-amylase inhibitory method. A large variety of α-amylase inhibitors have been reported from various plants, which protect against oxidative damage resulted in hyperglycemia. Inhibition of enzyme activity may be due to the presence of potentially bioactive compounds like polyphenols, alkaloids, flavonoids, tannins and glycosides. The DNS reagent assay is a widely used procedure to quantify the amount of reducing sugars produced after-treatment of the solution by α-amylase with different types of samples16–18. IC50 analysis showed that the standard acarbose is required 3.55 mg/ml, whereas leaves extracts required a higher amount to reach at IC50 (Extended data, Table S11)49. Bioactive constituents are the natural source of antioxidants and responsible for preventing the destruction of β-cells and diabetes-induced ROS formation. The anti-diabetic and antioxidant properties of the EH leaves might be due to the synergistic effect of biologically active phytochemicals present in the extracts64.
The in vitro anti-arthritic activity investigation by protein denaturation method indicated that all the 70% ethanolic extract had showed maximum inhibition when compared to the aqueous extracts and IC50 analysis showed that standard sodium diclofenac is required at 0.430 mg/ml, whereas leaf extracts had higher IC50 values (Extended data, Table S12)49. The significant in vitro anti-arthritic activity exhibited by the extracts is caused may be due to the presence of flavonoids, polyphenols and tannins. Denaturation of the protein involves the breakdown of chemical structures of the molecules and finally leads to cell death; it happens due to various stresses like a high level of salt, temperature and acidity. The processes of protein denaturation may be related with the alteration in electrostatic, hydrogen, hydrophobic and disulphide bonding. Denaturation of proteins is leading to oxidative stress-related diseases such as inflammatory situations, rheumatoid arthritis, high blood pressure, diabetes and cancer. The results concluded that leaves extracts of CR have the highest ability to control the oxidative stress-related generation of auto-antigen, which relates to the inhibition of the denaturation of proteins19–21.
The dissolution of calcium oxalate and the number of calcium ions in the solutions are inversely related. The current in vitro anti-lithiatic investigation concluded that the aqueous extracts showed higher dissolution percentage of calcium oxalate crystals (except CB) than 70% ethanolic extracts. The result of CB aqueous extract contradicts with the previous reports of Celestian et al., who showed that CB aqueous extracts had higher dissolution percentages of calcium oxalates23. According to our knowledge, the present work highlighted the in vitro anti-urolithiasis activity of HI, and CR leaves extracts for the first time. Lithiasis and its co-morbidities proceed to the development of oxidative stresses which is known to be a primary reason for inflammation. Previous research suggests that oxidative stresses and inflammation generated by one disorder, and it may happen in a particular situation which produces the development of the co-morbidities. As observed by the researchers that mildly high calcium or phosphate can promote the deposition of calcium phosphate crystals in the renal interstitium with localized swellings and deposition of collagen resulting to the production of Randall’s plaque or it may be possible that mildly high calcium and phosphate or oxalate and low citrate or magnesium levels in the urine can cause to crystallization in the collecting ducts of kidney that is oxidatively stressed and injured72. The present study reveals that the aqueous and 70% ethanolic extracts of EH can be able to dissolve the calcium oxalate stones which are higher comparing with the other leaf extracts. The result of the study concluded the necessity of EH aqueous extracts for the treatment of renal stones which agrees with the previous investigation as well73, whereas the TP extracts contradict with the previous observations74. The p-value˂0.01, which showed a very significant in vitro bioactivity in case of extracts using each solvent. In this study, the phytochemicals and antioxidant properties are variably and remarkably correlated with oxidative stress-related medicinal properties (Extended data, Tables S13 and S14)49.
It is concluded that the medicinal plants are best sources of phytochemicals and remedial agents for several disorders. In the present investigation, the extracts of HI, TP, CR, CB and EH were found to be rich in secondary plant metabolites, which showed significant in vitro antioxidant and medicinal properties as well as minimal level of cytotoxicity75. Though, for all the in vitro experiments, further studies are recommended to know and evaluate the pharmacological efficacy, potentiality and mode of action. The reasonable difference between the presence of phytochemical contents are may be due to leaves maturity, fertility, pest exposure, moisture, relative water content, pH, solubility, solvents polarity, environmental factors like pollution, solar reflectance, rainfalls, precipitation, location and temperature4,37.
In conclusions, these results suggested that among these five medicinal weeds, EH has showed the highest bioactive component presence as well as the antioxidant properties which agree with the previous studies, too12,52. EH showed better in vitro medicinal properties and prominent cytoprotectivity on dose dependant study in comparison with the other four weeds due to the presence of high amount of vital phytomolecules such as sinapic acid, gallic acid, caffeic acid or chlorogenic acid61–63. In future, Euphorbia hirta Linn. can be used as an important medicinal plant to isolate and identify the active phytocompounds for the therapeutic and natural antioxidant preparation purposes cost effectively.
Thus, the study has shown the path that traditionally used easily available weeds can be a low-cost source of important bioactive molecules with potential for herbal drug development.
Figshare: Phytochemical Composition Analysis and Evaluation of In Vitro Medicinal Properties and Cytotoxicity of Five Wild Weeds. https://doi.org/10.6084/m9.figshare.12115827.v250.
File ‘F1000 Raw Data Final’ contains the raw output data for each repeat of each experiment.
Figshare: f1000 Extended data (Phytochemistry and Phytopharmacology of 5 Medicinal Weeds). https://doi.org/10.6084/m9.figshare.1220563149.
File ‘F1000 Extended data’ contains the following extended data:
Table S1. Concentration (µg) of bioactive compounds in 40µl in antimicrobial activity study.
Table S2. Correlation between bioactive components.
Table S3. Correlation between antioxidant assays and bioactive components.
Table S4. IC50 of standard reagent and leaves extracts in ABTS free radical scavenging assay.
Table S5. IC50 of standard reagent and leaves extracts in DPPH free radical scavenging assay.
Table S6. IC50 of standard reagent and leaves extracts in H2O2 free radical scavenging assay.
Table S7. Correlation between antioxidant assays.
Table S8. Correlation between PPO and bioactive compounds.
Table S9. Correlation between PPO and Saponin.
Table S10. Correlation between antioxidant assays and PPO.
Table S11. IC50 of standard drug and extracts in α-amylase inhibitory activity.
Table S12. IC50 of standard drug and leaves extracts in inhibition of protein denaturation.
Table S13. Correlation between bioactive compounds and in vitro medicinal properties.
Table S14. Correlation between antioxidant assays and in vitro medicinal properties.
Figure S1. HI HPLC-DAD chromatogram of the phenolic compounds presents in the 70% ethanolic extract.
Figure S2. TP HPLC-DAD chromatogram of the phenolic compounds presents in the 70% ethanolic extract.
Figure S3. CR HPLC-DAD chromatogram of the phenolic compounds presents in the 70% ethanolic extract.
Figure S4. CB HPLC-DAD chromatogram of the phenolic compounds presents in the 70% ethanolic extract.
Antioxidants Concentration in Free Radical Scavenging Assay;
Figure S5. ABTS antioxidants concentration in free radical scavenging assay.
Figure S6. DPPH antioxidants concentration in free radical scavenging assay.
Figure S7. H2O2 antioxidants concentration in free radical scavenging assay.
Figure S8. HI and TP aqueous extracts antimicrobial activity assay.
Figure S9. HI and TP 70% ethanolic extracts antimicrobial activity assay.
Figure S10. CR, CB and EH aqueous extracts antimicrobial activity assay.
Figure S11. CR, CB and EH 70% ethanolic extracts antimicrobial activity assay.
Figure S12. Plant identification voucher.
Data are available under the terms of the Creative Commons Zero "No rights reserved" data waiver (CC0 1.0 Public domain dedication).
| Views | Downloads | |
|---|---|---|
| F1000Research | - | - |
|
PubMed Central
Data from PMC are received and updated monthly.
|
- | - |
Provide sufficient details of any financial or non-financial competing interests to enable users to assess whether your comments might lead a reasonable person to question your impartiality. Consider the following examples, but note that this is not an exhaustive list:
Sign up for content alerts and receive a weekly or monthly email with all newly published articles
Already registered? Sign in
The email address should be the one you originally registered with F1000.
You registered with F1000 via Google, so we cannot reset your password.
To sign in, please click here.
If you still need help with your Google account password, please click here.
You registered with F1000 via Facebook, so we cannot reset your password.
To sign in, please click here.
If you still need help with your Facebook account password, please click here.
If your email address is registered with us, we will email you instructions to reset your password.
If you think you should have received this email but it has not arrived, please check your spam filters and/or contact for further assistance.
Comments on this article Comments (0)