Keywords
vitamin D, blood pressure, elderly, 25(OH)D) levels
vitamin D, blood pressure, elderly, 25(OH)D) levels
High blood pressure (BP), or hypertension, is still regarded as one of the most influential factors for cardiovascular diseases, especially in the elderly. An increasingly aging population and the increasing prevalence of hypertension emphasize the importance of proper treatment of hypertension. Nutrient supplementation is an alternative treatment since the elderly have multiple chronic diseases and take multiple drugs1,2. Vitamin D is one kind of steroid hormone and micronutrient synthesized in the skin by exposure to ultraviolet B rays and also obtained through dietary intake or supplementation3. Most vitamin D is distributed in the human body in the form of serum 25(OH)D4.
Vitamin D deficiency has become an important public health concern because it could take place at any age, and most countries report deficiency as high in the elderly3,5. Vitamin D has an essential part in metabolism regulation and has a significant role in the pathogenesis of hypertension4. However, the result of meta-analyses has revealed that the relationship between serum 25(OH)D levels and a decrease in BP is inconsistent. Qi et al. (2017) reported that low serum 25(OH)D levels are not significantly associated with a risk of hypertension6. In contrast, other studies demonstrated a significant relationship between low serum 25(OH)D levels and hypertension3,7. Another meta-analysis also proved that the serum level of 25(OH)D was significantly associated with the risk of incident hypertension on the general population3.
The elderly is an age group susceptible to deficiency of this fat-soluble vitamin. Skin aging reduces 7-dehydrocholesterol production to 75%, which is known to play a key role as the main source of vitamin D in the human body8. The impaired eating ability in the elderly may also contribute to low levels of vitamin D. Therefore, vitamin D deficiency is often associated with various geriatric syndromes. Low levels of vitamin D affects the activity of endocrine hormones as in sufferers of diabetes mellitus type 2 (T2DM) and cardiovascular functions, such as coronary artery disease, heart failure, stroke, and hypertension9. A recent meta-analysis in individuals with vitamin D deficiency showed oral vitamin D3 reduces both systolic BP (SBP) and diastolic BP (DBP) in individuals with hypertension and decreases SBP in individuals above 50 years. In contrast, another study has revealed that in younger women, there is a strong association between high serum 25(OH)D levels and the risk of hypertension3. Since the elderly, defined as individuals of more than 60 years of age, have a high risk of vitamin D deficiency and suffer hypertension1,2,10, it is important to provide a meta-analysis of randomized controlled trials gathering the evidence of the effects of vitamin D supplementation compared to placebo on serum 25(OH)D levels and BP, specifically in the elderly population.
A comprehensive search was performed following the Preferred Reporting Items for Systematic Reviews and Meta-analyses (PRISMA) statement11. All authors searched independently correlated studies in multiple electronic database including, PubMed, ClinicalTrials.gov, and the Cochrane Library from inception until 29th March 2019 using a combination of keywords and subject headings. One of our search strategies used on PubMed using the following keywords: (vitamin D) AND ((blood pressure) OR (hypertension)) AND (elderly). Further relevant articles were then obtained using manually searching the references of retrieved articles.
All titles and abstracts were screened using Mendeley reference software, and duplications were removed manually. Full text of relevant articles were examined for eligibility criteria. The inclusion criteria were as follows: randomized controlled trial (RCT) design; participants with average age > 60 years; primary outcomes SBP change, DBP change, and serum 25(OH)D level change; and only vitamin D (cholecalciferol) intervention. The exclusion criteria were as follows: nonrandomized study; assessment of the full text of the study not possible; the study control group was not placebo; outcomes relevant to our interest not reported; intervention with combined vitamin D and other nutrients supplementation; and non-English full text.
Data from each included article were extracted by three investigators (F.F., C.F., N.Y.) by utilizing a piloted form. If there is any disagreement between the authors, the final decision was made by discussion and majority vote. The following data were extracted: year of publication, year of study, geographic location, sample size, health status of participants, mean age, intervention dose, duration of the study, mean and standard deviation (SD) of serum 25(OH)D levels, SBP, and DBP in both intervention and placebo groups at the baseline and at the end of study, and changes from the baseline.
Each RCT’s quality was evaluated using the risk of bias tools developed by Cochrane collaboration evaluating six domains. We assessed the selection bias by evaluating the study description on the method of the randomization, the method of allocation concealment, and evaluated if there is difference in baseline between the two groups. Performance and detection bias were evaluated by finding a description about the blinding method. Attrition bias was assessed by calculating the number of participants that withdrew from the study. Reporting bias and other bias were then evaluated if there found any concern not addressed in the other domain12.
The continuous data were presented as mean difference (MD) and SD. Where the change in mean (Δ Mean) was not available, we calculate the change by subtracting post intervention outcome with the baseline data. When a study did not report enough information of the change on SD (ΔSD), we calculated the data imputation applying the formula for imputing SD from baseline13:
corr = (SDbaseline2 + SDpost2 - SDchange2)/(2 × SDbaseline × SDpost)
ΔSD was then calculated as:
To calculate the estimated effect size on MD, we used random-effect model if there was heterogeneity found using X2 test and I2 test14. p value of <0.10 dan I2 > 50% were considered high. Otherwise, the fixed-effects Mantel–Haenszel model was used. We performed univariate meta-regression analyses to evaluate differences in the continuous outcome variable. Analyses of subgroups were conducted to assess predefined sources of heterogeneity. Dose of supplementation, duration of the study, treatment regimen, hypertension, and vitamin D status were considered as sources of heterogeneity. We assessed publication bias by visual assessment on graphical funnel plots with Egger’s regression test of asymmetry15.
All statistical analyses were performed using STATA 16.0 (STATA Corporation). P value < 0.05 was considered statistically significant.
Figure 1 presents the flowchart of this study. We screened 980 articles. Of those, 28 were excluded because of duplicate publication, and 42 articles were assessed for eligibility criteria. Of those, 30 were not eligible to be included. Finally, 12 RCTs16–27 were included in the quantitative synthesis. The quality assessment demonstrated that almost all of the included studies has a low risk of bias. The results for quality assessment was summarized in Extended data: Figure S128.
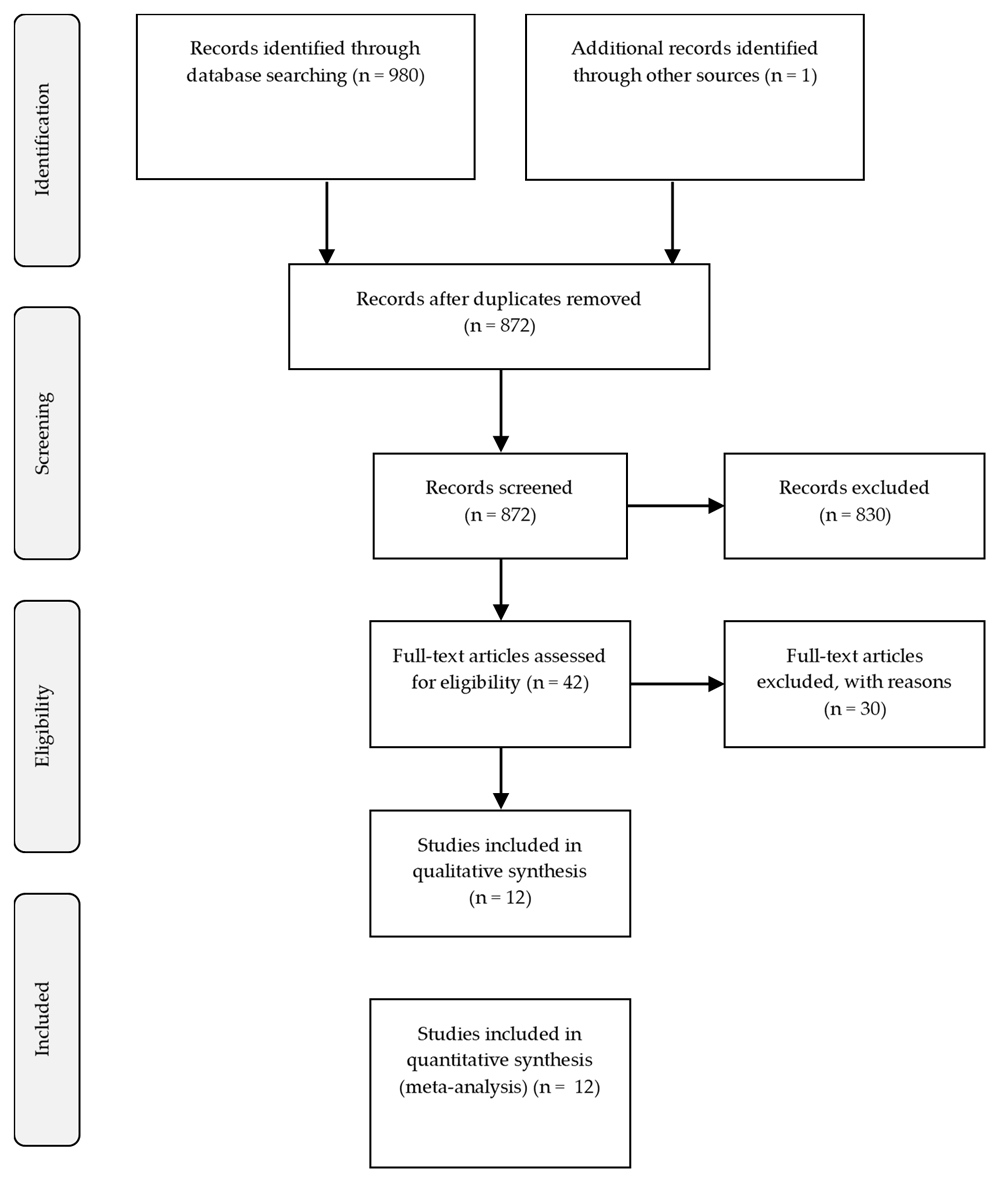
PRISMA, Preferred Reporting Items for Systematic Reviews and Meta-analyses.
Table 1 summarizes the characteristics of the included RCTs. The RCTs were conducted in different continents: Asia23, Europe19–22,25–27, America17, and Oceania18. All were placebo controlled and published in English. The mean age of the participants was 65.5 years with differing health conditions. Only three RCTs included participants without certain medical criteria but with some conditions that indicated vitamin D deficiency, including postmenopausal women16,17 and those taking vitamin D supplements < 400 IU19. In addition, several RCTs targeted conditions related to blood sugar levels, such as T2DM21,26 and prediabetes24. Hypertension patients were also the subjects of several RCTs, which focused on isolated systole hypertension (ISH)22, arterial hypertension20,25, and essential hypertension23.
| Authors | Countries, continent | n | Subject condition | Average age (years) | Before intervention | Dose | Time (wk) | After intervention | ||
|---|---|---|---|---|---|---|---|---|---|---|
| 25(OH)D ng/mL | BP (mmHg) | 25(OH)D ng/mL | BP (mmHg) | |||||||
| Chen, et al.23 (2014) | China, Asia | 126 | -HT grade I-II -Consume nifedipine 30 mg/d | 62.5±9.1 | 19.4±11.6 | SBP: 132.1±9.4 DBP: 75.1±9.1 | 2,000 IU/day | 24 | 34.1±12.2* | ∆SBP: -6.2* ∆DBP: -4.2* |
| Wood, et al.16 (2012) | UK, Europe | 265 | Healthy post-menopausal women | 63.5±1.9 | 13.12±5.2 | SBP: 128.2±13.8 DBP: 77.7±7.3 | 400 IU/day | 48 | 46.1±5.2* | ∆SBP: -2.2 ∆DBP: -2.5 |
| 64.1±2.3 | 13±5.5 | SBP: 129.2±15.6 DBP: 76.9±8.1 | 1,000 IU/day | 48 | 55.9±5.5* | ∆SBP: -1.5 ∆DBP: -0.9 | ||||
| Witham, et al.22 (2013) | UK, Europe | 159 | -ISH -25(OH)D levels <30ng/mL | 76.9±4.8 | 18±6.0 | SBP: 163±11 DBP: 78±7 | 100,000 IU/3 month | 48 | 26±6.0* | SBP: 163±18 DBP: 78±9 |
| Witham, et al.21 (2010) | UK, Europe | 61 | -T2DM -25(OH)D serum <40 ng/mL | 65.3±11.1 | 16.2±5.6 | SBP: 149.6±24.0 DBP: 81.7±12.4 | 100,000 IU once | 32 | 25.2±8 | SBP: 141.4±16.6* DBP: 77.1±11.7 |
| 100,000 IU once | 64 | 23.6±7.2 | SBP: 144.6±20.4 DBP: 79.6±11.9 | |||||||
| 63.3±9.6 | 19.2±8.4 | SBP: 145.1±25.0 DBP: 80.7±14.3 | 200,000 IU once | 32 | 31.7±12.4* | SBP: 136.8±12.9* DBP:74.4±9.8 | ||||
| 200,000 IU once | 64 | 30.5±12* | SBP: 139.5±15.4 DBP: 77.6±11.7 | |||||||
| Sollid, et al.24 (2014) | Norway, Europe | 511 | Prediabetes | 62.1±8.7 | 24±8.8 | SBP: 135.4±16.8 DBP: 83.2±10.1 | 20,000 IU/wk | 48 | 42.4±9.7* | ∆SBP: -2.9±13.7 ∆DBP: -4.6±8.9 |
| Gepner, et al.17 (2012) | Wisconsin, American | 114 | -Post-menopausal women -25(OH)D levels >10 and <60 ng/mL | 64.1±3 | 30.3±10.7 | SBP: 122.3±13.1 DBP: 72.5±7.6 | 2,500 IU/day | 16 | 46.0±9.3* | ∆SBP: -0.3±8.4 ∆DBP: -0.7±5.1 |
| Pilz, et al.25 (2015) | Austria, Europe | 188 | -Arterial HT -25(OH)D serum <30 ng/mL -Ongoing antihypertensive treatment | 60.1±11.3 | 22.0±5.5 | SBP: 131.4±8.1 DBP: 78.1±7.5 | 2,800 IU/day | 32 | 36.2±7.3* | SBP: 130.3±9.3 DBP: 77.8±8.2 |
| Sugden, et al.26 (2008) | Scotland, Europe | 34 | -T2DM -25(OH)D serum <20ng/mL -6 weeks stable medication | 64.9±10.3 | 16.1±4.1 | SBP: 145 ± 9.2 DBP: 82 ± 10.5 | 100,000 IU once | 32 | 25.3±6.7* | ∆SBP: -7.3±11.8* ∆DBP: -2.2±8.6 |
| Larsen, et al.20 2012) | Denmark, Europe | 112 | -Arterial HT -Unchanged medications during study | 61±10 | 23.0±9.0 | SBP: 132 ± 10 DBP: 77 ± 6 | 3,000 IU/day | 80 | 44.0±9.0* | SBP: 130±11 DBP: 76±7 |
| <32 | ∆SBP: -4* ∆DBP: -3* | |||||||||
| Stricker, et al.27 (2012) | Switzerland, Europe | 76 | -Chronic Peripheral Arterial Disease -25(OH)D serum <30 ng/mL | 72.9±8.7 | 16.3±6.7 | SBP: 133±18.5 DBP: 73±8.2 | 100,000 IU once | 4 | 24.3±6.2* | SBP: 136±18.7 DBP: 73±8.1 |
| Sluyter, et al.18 (2017) | New Zealand, Oceania | 517 | -Both men and women aged 50–84 years | 63.3±8.6 | 11.1±3.2 | SBP: 137.4±16.8 DBP: 78.9±10.7 | initiation 200,000 IU, next 100,000 IU/month | 48 | 23.2* | SBP: 128.9±16.1 DBP: 73.7±9.9 |
| Tomson, et al.19 (2017) | UK, Europe | 305 | -Participants aged minimum 65 years -Not taking >400 IU vitamin D daily | 71 | 15.7 | SBP: 132.7±21.1 DBP: 78±11.3 | 4,000 IU/day | 48 | 43.1±0.8* | SBP: 132.5±1.43 DBP: 77.2±0.9 |
| 72 | SBP: 131.8±17.1 DBP: 76.6±10.3 | 2,000 IU/day | 48 | 32.1±0.8* | SBP: 131.8±1.51 DBP: 76.6±0.96 | |||||
The type of hypertension affected the baseline BP of the participants. The BP varied; some participants had hypertension, whereas others had normal BP. SBP in all participants ranged from 109.2 to 174 mmHg, whereas DBP ranged from 64.8 to 95 mmHg. High SBP usually occurred in ISH and was most commonly found in the elderly. However, on average, in each RCT, the participant’s BP was categorized as prehypertension or hypertension (>120/80 mmHg). Hypertension and diabetes experienced by the elderly made it difficult for the participants to be excluded on the basis of medications. Therefore, some of the RCTs had inclusion criteria that required participants not to change their medical treatment throughout the study duration20,26,27, because the use of different drugs affects vitamin D intervention. In their study at one of the general hospitals in Beijing, China, Chen et al. (2014) included participants who were taking 30 mg/dL of nifedipine23. Another factor that may influence the effectiveness of vitamin D supplementation was baseline 25(OH)D levels before the intervention. Some of the RCTs had set serum 25(OH)D limits to <2026, 3022,25,27, 4022, or 60 ng/mL17; all these values indicate deficiency in vitamin D.
Table 1 shows that most participants revealed baseline data of mean 25(OH)D levels <20 ng/mL, and the maximum was 30 ng/mL17. Eight RCTs evaluated changes of 25(OH)D levels after giving vitamin D intervention. The 1293 participants were divided into treatment (n = 641) and control groups (n = 652). Pooling data revealed that the vitamin D group had a significant higher serum 25(OH)D levels compared to the control group (MD = 13.84; 95% CI = 10.21–17.47; P < 0.0001). We observed heterogeneity among the RCTs (I2 = 93%), so we selected a random-effects model (Figure 2).
The change of SBP and DBP was synthetized from 12 RCTS. We did not observe heterogeneity among the RCTs (I2 < 50%), so we selected a fixed-effects Mantel–Haenszel model. Pooled analysis revealed that overall, the SBP change (MD = –0.83; 95% CI = –1.88 to 0.23; P = 0.12) and DBP changes (MD = 0.40; 95% CI = –1.00–0.19; P = 0.18) in vitamin D group were not significant compared with the control group. The effects of vitamin D on SBP and DBP were summarized as forest plots presented in Figure 3 and Figure 4. The funnel plots of SBP change and DBP change are summarized in Figure 5. Our analysis showed that there was no publication bias when examining funnel plots and the result of Egger’s test of asymmetry for SBP change and DBP change (p = 0.158; p= 0.069; respectively).
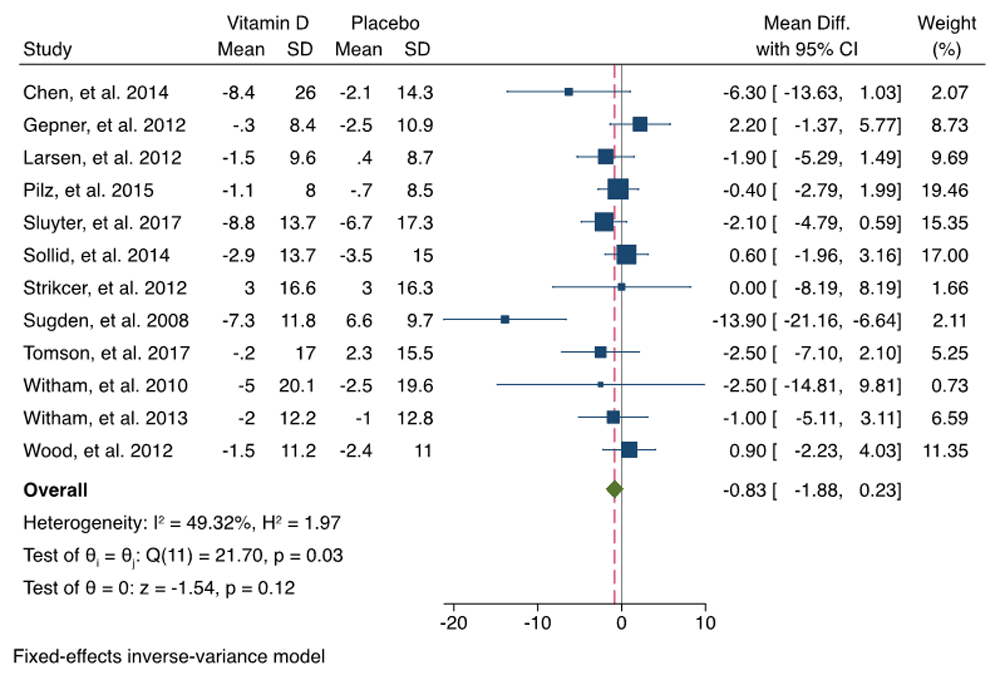
The overall effect size estimate is represented by the red dashed line. CI, confidence interval; SD, standard deviation.
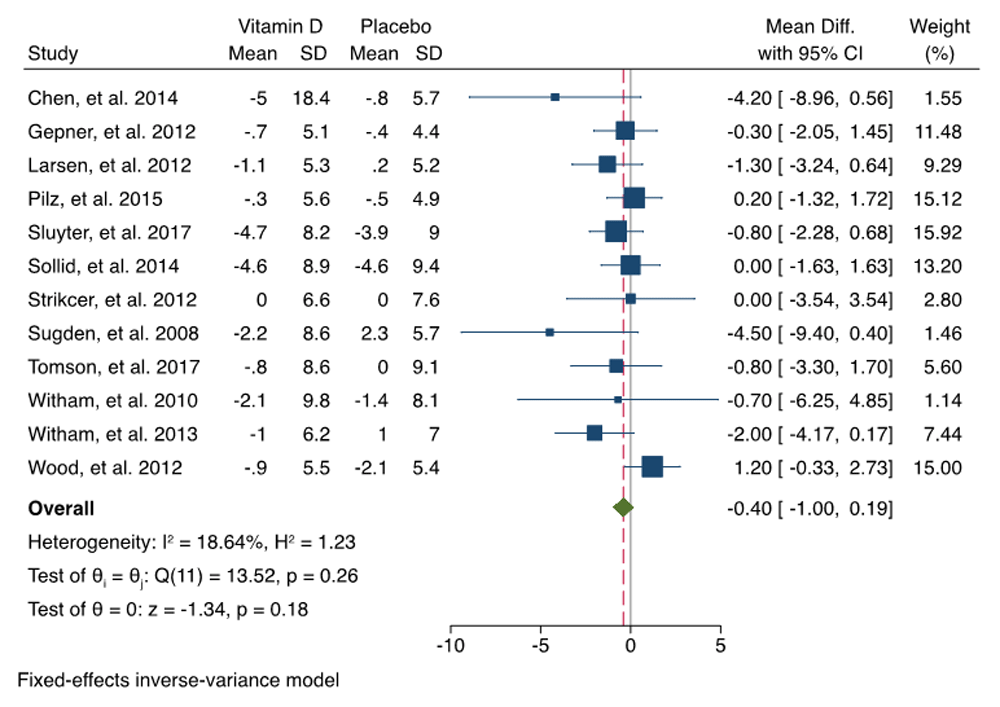
The overall effect size estimate is represented by the red dashed line. CI, confidence interval; SD, standard deviation.
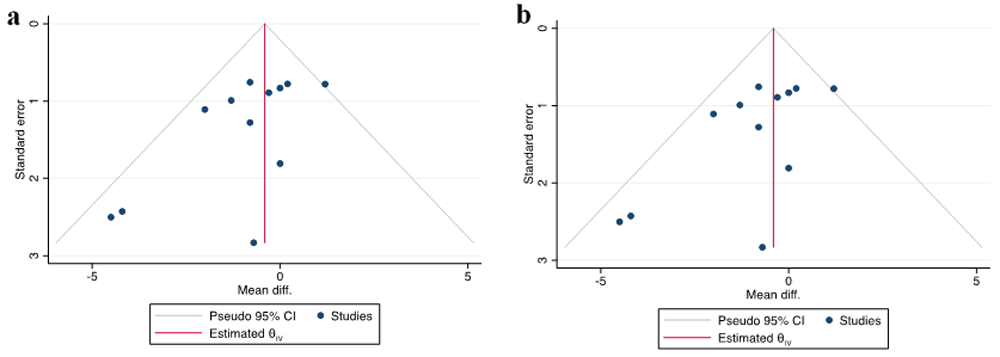
Funnel plot assessing publication bias for the effect of (a) systolic blood pressure (BP) change and (b) diastolic BP change.
Table 2 and Table 3 present the pooled estimated effect size of vitamin D on the change of SBP and DBP, on the basis of BP baseline, vitamin D status baseline, intervention dose, treatment duration, and treatment regimen. Our analysis indicate that vitamin D supplementation had no significant influence on SBP and DBP changes on the basis of dose, duration, and treatment regimen. However, subgroup analysis revealed a marginal trend toward significance in terms of DBP changes with treatment duration ≤ 6 months (MD = –0.82; 95% CI = –1.66 to –0.02; P = 0.05). Subgroup analysis by hypertensive and deficiency of vitamin D status indicated that vitamin D supplementation could significantly reduce SBP (MD = –4.01; 95% CI = –7.45 to –0.57; P = 0.02 and MD = –1.91; 95% CI = –3.48 to –0.34; P = 0.02, respectively). However, we found a significant difference in DBP changes only in the hypertensive subgroup (MD = –2.22; 95% CI = –4.1 to –0.34; P = 0.02) (Table 2 and Table 3). The forest plot of each subgroup analysis is available as Extended data: Figure S228. Our study provided enough observations to conduct univariate meta-regression, summarized in Table 2 and Table 3. The result for SBP change was presented as bubble plots in Figure 6.
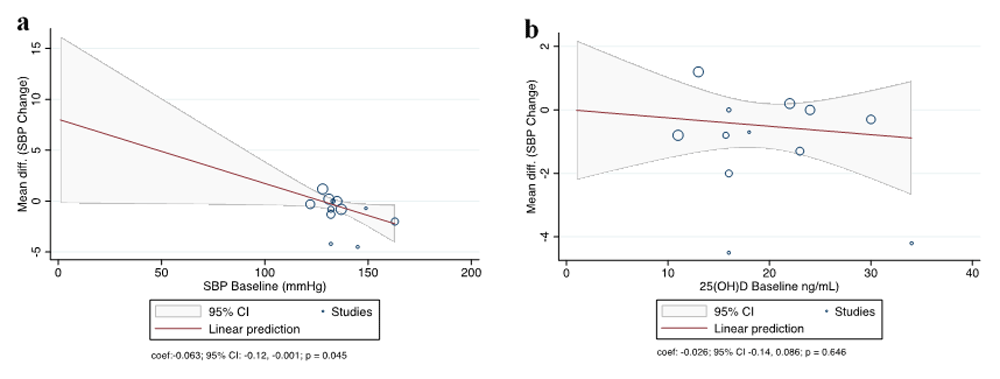
(a) Participant blood pressure baseline and the mean difference (MD) in systolic blood pressure (SBP) change; (b) Participant 25(OH)D baseline and the MD in SBP change. Each circle characterizes a study and the size of the circle reflects the influence of that study on the model. The regression prediction is represented by the solid line.
Serum 25(OH)D levels has a major role as a marker for determining vitamin D status in humans. As mentioned before, most vitamin D circulates in human body in the form of 25(OH)D. This is a result of vitamin D metabolism from the skin and vitamin D intake and binds to vitamin D-binding protein, which has a half-life of 2–3 weeks. The clinical practice guidelines issued by the Institute of Endocrinology has defined vitamin D deficiency as levels of 25(OH)D below 20 ng/mL29. In addition, the average normal value for serum 25(OH)D levels for all ages is 30 ng/mL, whereas in the elderly it is >20 ng/mL or 50 nmol/L30.
Deficiency in vitamin D could be caused by physiological and pathological factors in the elderly. One of the most common physiological factors is decreasing pre-vitamin D production in the skin. The reasons are that compared with young adults, the skin’s capacity to produce vitamin D decreases by 75% at 70 years29,31. In addition, the elderly has a tendency to wear closed clothing for fear of flu, thus causing minimal exposure to ultraviolet B rays9. Their food intake decreases because of a decrease in chewing ability and financial conditions30. Also, decreased calcium absorption results in impaired vitamin D metabolism and decreased kidney function29–34. Pathological factors are related to organs that play a role in the digestion and metabolism of vitamin D. Decreased bioavailability in the digestive tract (malabsorption due to disease) inhibits vitamin D metabolism. Patients with liver disease can suffer from vitamin D hydroxylation disorders. Kidney pathologies, such as nephrotic syndrome and chronic kidney disease, increase vitamin D activation disorders34. However, the 12 RCTs included in this study excluded participants with pathological conditions that might cause vitamin D deficiency.
One of the main findings of the present meta-analysis was vitamin D supplementation has significant effect on serum 25(OH)D levels among the elderly. It increases serum 25(OH)D levels in people that are older than 60 years old. Almost all studies included have revealed a significant increase in serum 25(OH)D levels from the baseline. The contradictory result was shown by Witham et al. (2010) that inconsistent with a previous study by Sugden et al. (2008), which has revealed a significant difference between the treatment and control groups with same doses and duration24. Another study has reported increasing serum 25(OH)D levels at follow-up in the vitamin D group, with no change in the placebo group18. The relationship between serum 25(OH)D levels and a decrease in BP is still debatable. A meta-analysis of observational cross-sectional and prospective studies on general populations has proven the relationship between serum 25(OH)D levels and the risk of incident hypertension3. However, a newer meta-analysis showed oral vitamin D3 has no significant effect on blood pressure in individuals with vitamin D deficiency5. To the best our knowledge, this is the first study that analyses the effects of vitamin D on serum 25(OH)D levels, the gold standard to measure vitamin D status in humans.
This study included research from four different continents. However, characteristically there are no specific differences for each continent. The results were random and more relevant to the baseline data and effect of the RCT itself. The present study provides evidence that although the supplementation could increase serum 25(OH)D levels, there was no significant difference in SBP and DBP changes compared with the control group. It means that the increasing serum 25(OH)D levels were not followed by decreasing BP among elderly. Several studies have revealed not only a relationship between an increase in serum 25(OH)D levels and a decrease in BP after vitamin D supplementation but also a significant change in other conditions, such as parathyroid hormone, serum calcium, renin, and angiotensin II levels16,20,23, indicating that vitamin D regulates a decrease in BP through various mechanisms. The effect of vitamin D supplementation on a decrease in BP is inconsistent in several studies. Some studies have reported that vitamin D supplementation can reduce BP, although only SBP, so vitamin D supplementation can be a supportive therapy for hypertension8,21,26. Similar to our result, a meta-analysis by Golzarand et al. has revealed that vitamin D supplementation is only associated with an increase in serum 25(OH)D levels, not SBP or DBP35. Meanwhile, according to Chen et al. (2014), vitamin D supplementation that complements 30 mg/dL nifedipine in patients with grade I or II essential hypertension can reduce SBP or DBP23. They were the first to look at the effectiveness of the interaction between vitamin D and specific drugs in contrast to other studies that only provide inclusion criteria in the form of no change in medication consumption.
Several meta-analyses have been conducted to evaluate the association between vitamin D and BP. The findings of the meta-analysis of observational studies on general populations have proven the association between vitamin D status and the risk of incident hypertension3,7,8. However, the association between vitamin D and hypertension is not causal, so placebo-controlled RCTs are required in order to prove the effects of vitamin D on BP. Previous RCTs and meta-analyses have revealed that vitamin D might be beneficial in lowering BP, especially in vitamin D-deficient patients with hypertension, which is similar to our results4,18. In contrast to our findings, Ke et al. (2015) reported no increased risk of hypertension in the elderly or in vitamin D-deficient participants; however, their research involved a prospective study design3. The newest meta-analysis has revealed that vitamin D has no significant effect on BP in vitamin D-deficient people; it reduces SBP in vitamin D-deficient people older than 50 years and in people with both vitamin D deficiency and hypertension5. However, a previous meta-analysis involved subjects between 18 and 74 years old and serum 25-OHD are lower than 20ng/mL, and subgroup analysis used criteria older than 50 years old. Meanwhile, our study involved subjects with the mean age more than 60 years, according to WHO definition for elderly10.
The other important finding in our study was significant differences in SBP and DBP changes among the hypertensive subgroup. Previous meta-analyses have also revealed a significant effect of vitamin D on BP in patients with hypertension at the baseline and no significant decrease in normotensive patients at the baseline5,36. In contrast to our findings, a meta-analysis by Golzarand et al. (2016) showed that vitamin D showed hypotensive effects in both healthy and hypertensive subjects35. To the best of our knowledge, there has been no research that suggests that there are differences in the metabolism of vitamin D in the elderly with hypertension and norm tension, except secondary hypertension associated with kidney organs37. Decreased BP also occurs in arterial hypertension patients who have vitamin D deficiency. Patients with deficiency in vitamin D may acquire the effects of vitamin D supplementation20. However, administering vitamin D to participants who meet the same criteria can give zero results with regard to a decrease in BP because of the shorter time of administration (only 8 weeks with almost the same dose)25. In addition, an updated meta-analysis’s results were similar to our study in that subgroup analysis showed vitamin D supplementation may reduce SBP and DBP in patients with low vitamin D status and hypertension5. Searching articles until the end of March 2019, our study provides the most up-to-date meta-analysis and strongly supports that vitamin D supplementation significantly decreases BP in the elderly, specifically with elevated BP and deficiency in vitamin D.
In addition to hypertension patients, T2DM patients also exhibit a decrease in BP, although only SBP, after a high dose of vitamin D supplementation21,26. Again, serum 25(OH)D levels also contributed to the effects of vitamin D supplementation on lowering BP. Pre diabetic patients reveal absolutely no effect of the same dose of vitamin D on BP because they are not vitamin D deficient24. Most of the RCTs included in this study reveal an insignificant decrease in BP after given a dose supplementation of vitamin D. In the case of ISH, which is common among the elderly, vitamin D supplementation is less effective. The reason is probably because vitamin D cannot decrease blood vessel stiffness and is effective only during the early stages of the disease. Hypertension in the elderly does not increase renin levels22. Other studies have revealed no effect of vitamin D supplementation on lowering BP in postmenopausal women17, chronic peripheral arterial disease patients20, and the elderly without certain medical conditions16,18,19. The actual conditions suffered by the elderly due to multiple chronic diseases and therefore multiple drugs should be considered as an important aspect that may influence the effects of vitamin D on BP.
This study had a few limitations. First, although we conducted a systematic review of peer-reviewed research, we did not include agency reports, dissertations, and conference proceedings. Second, we included only English-language RCTs. Third, the RCTs were heterogeneous with respect to demographic characteristics of the participants, the duration, and treatment dose.
Vitamin D deficiency is prevalent among the elderly, and vitamin D supplementation significantly increases serum 25(OH)D levels. The use of vitamin D supplementation appears to be beneficial in lowering BP, specifically in the elderly with hypertension and vitamin D deficiency. We recommend vitamin D supplementation for elderly individuals with hypertension and serum 25(OH) D levels below the target values. The actual conditions suffered by the elderly because of multiple chronic diseases and therefore multiple drugs should be considered as important factors that influence the effects of vitamin D on BP. The homogenous duration, dose intervention, and treatment regimen need to be investigated in future studies in order to determine the proper treatment for hypertension in the elderly.
All data underlying the results are available as part of the article and no additional source data are required.
Open Science Framework: Extended data for “Effects of vitamin D supplementation on 25(OH)D levels and blood pressure in the elderly: a systematic review and meta-analysis.” http://doi.org/10.17605/OSF.IO/EXF2628.
This project contains the following extended data:
Spreadsheets in .sav format containing data for supplementation efficacy outcomes in 25(OH) levels, systolic blood pressure, and diastolic blood pressure.
Supplementary figure in .doc format containing: Figure S1: results for quality assessment, Figure S2: forest plot of each subgroup analysis, Figure S3: Funnel plot and egger test results.
Open Science Framework: Extended data for “Effects of vitamin D supplementation on 25(OH)D levels and blood pressure in the elderly: a systematic review and meta-analysis.” http://doi.org/10.17605/OSF.IO/EXF2628.
Data are available under the terms of the Creative Commons Zero "No rights reserved" data waiver (CC0 1.0 Public domain dedication).
| Views | Downloads | |
|---|---|---|
| F1000Research | - | - |
|
PubMed Central
Data from PMC are received and updated monthly.
|
- | - |
Alongside their report, reviewers assign a status to the article:
| Invited Reviewers | ||
|---|---|---|
| 1 | 2 | |
|
Version 3 (revision) 03 Sep 20 |
read | read |
|
Version 2 (revision) 08 Jul 20 |
read | read |
|
Version 1 22 Jun 20 |
||
Provide sufficient details of any financial or non-financial competing interests to enable users to assess whether your comments might lead a reasonable person to question your impartiality. Consider the following examples, but note that this is not an exhaustive list:
Sign up for content alerts and receive a weekly or monthly email with all newly published articles
Already registered? Sign in
The email address should be the one you originally registered with F1000.
You registered with F1000 via Google, so we cannot reset your password.
To sign in, please click here.
If you still need help with your Google account password, please click here.
You registered with F1000 via Facebook, so we cannot reset your password.
To sign in, please click here.
If you still need help with your Facebook account password, please click here.
If your email address is registered with us, we will email you instructions to reset your password.
If you think you should have received this email but it has not arrived, please check your spam filters and/or contact for further assistance.
Comments on this article Comments (0)