Keywords
Organic farming, Sandy loam, Tropics, Northeast Thailand, Taguchi method
This article is included in the Agriculture, Food and Nutrition gateway.
Organic farming, Sandy loam, Tropics, Northeast Thailand, Taguchi method
See the authors' detailed response to the review by Oskar Franklin
See the authors' detailed response to the review by Jianwei Li
The application of synthetic nitrogen is a key technology used in agriculture; however, it decreases soil microbial biomass (SMB) and results in soil degradation (Mulvaney et al., 2009). Conversely, the application of organic matter with a high C/N ratio increases SMB and helps degraded soil to recover (Chaudhary et al., 2009; Goyal et al., 1999). The problem that remains is nitrogen starvation (van Iterson, 1904). However, some fields are highly productive under conditions of nitrogen starvation (Nakatsuka et al., 2016; Oda et al., 2014).
The possible mechanism underlying this high productivity under nitrogen starvation conditions is the large flow of low concentrations of nitrogen. Possible sources of this nitrogen include decomposed organic matter, turnover of SMB, and microorganisms in the root zone (Geisseler et al., 2010). Previous studies have mentioned a correlation between SMB and crop yield (Entry et al., 1996; He et al., 1997); however, these studies also found a correlation between soil total nitrogen (TN) and crop yield at the same extent. Although there is also a study that did not find a similar correlation (Holt & Mayer, 1998). Logically, the correlation between SMB and crop yield occurs in one of three ways: 1) both SMB and crop yield are related to other factors such as TN; 2) SMB is related to crop yield; or 3) crop yield is related to SMB.
In this study, we created nitrogen starvation conditions by applying organic matter with a high C/N ratio (waste mushroom bed) to fields and performed repeated lettuce cropping with different crop management practices. We analyzed correlations among crop yield, SMB, and TN to verify the above three possibilities. In addition, we analyzed the correlation between the rate of decomposition of the organic matter and SMB to verify whether the nitrogen source of the SMB is the organic matter.
We found that the correlation between SMB and crop yield is not a causal relationship and the nitrogen source for both is biological nitrogen fixation. The application of organic matter enhances this by occurring nitrogen starvation but not providing nitrogen source.
This study was conducted at a site with a tropical savanna climate in a lateritic loamy sand field in Tha Phara village, Khon Kaen Province, Thailand (16° 34′ N, 102° 83′ E), during 2011 and 2012. The site had ideal conditions for this study because sandy soils at a high temperature have a low level of soil organic matter and high microbial activity. Conducting the study during the dry season avoided any effects from rainwater.
We chose waste mushroom bed (gifted by a local farmer) as an organic material because of its adequate C/N ratio (40) for producing nitrogen starvation and its homogeneity. We applied the material to the fields at a fresh-weight rate of 1 kg m−2 (equivalent to a C application rate of 300 g m−2, equivalent to 30% of the initial topsoil) and mixed it well with the topsoil (about 14 cm) at each time of planting. This ensured that the nutritional input was the same for all plots. We generated a gradient of SMB and crop yield by altering crop management practices, including watering (1.5 mm twice per day, 3 mm once per week, or none); urea application with mushroom waste as a starter of decomposition (at a rate of 10, 0.1, or 0 g m−2, the 0.1 g m−2 application performed as a solution in 1.0 l of water); waste mushroom bed application method (incorporated, applied to the soil surface, or incorporated after killing the fungi by packing the material in plastic mulch film and exposing it to sunlight for 1 d); and planting density (standard, double, or none). No other materials were used.
The four factors of the three levels of practice (Table 1) were assigned to an L18 orthogonal array (Taguchi, 1986). Such a design enables each effect to be evaluated at an accuracy of six replications. The plot (3 × 3 m) locations were first randomized then fixed.
The practice of plant density 0 was used to verify the independence of SMB from crop growth in the experiment, because an increase in the size of the root zone is associated with an increase in microbial activity (Alam et al., 2014). The yield of plant density 0 reflects no effect of any practice on the yield, but the problem is evenly allocated to all factors. It should be noted that the aim of the present study was not to evaluate the effects of each factor.
Sequential cropping is thought to be an essential condition for achieving high SMB (Oda et al., 2014). Therefore, we planted water spinach during the rainy season (seeded Aug 25, harvested Sep 26), then planted lettuce during the dry season (transplanted and harvested on Oct 20 and Dec 7; Dec 8 and Jan 17; and Jan 23 and Mar 1, respectively). Total precipitation for the first to fourth crop seasons was 248, 7, 0, and 0 mm, respectively. The plants were free from disease and insect pests; no plant protection procedures were used. The field was kept free of weeds by hand weeding.
We harvested the whole crop of lettuce and immediately oven-dried and weighed it to obtain the dry weight. Topsoil (to a depth of about 14 cm, bulk density 1.22) was sampled from each plot just after the crops were harvested. A composite sample from ten sampling points was collected from the field just before starting treatments. A composite sample from ten sampling points was collected from each plot after harvest. Additionally, sampling was conducted on day 15 of season 4 for checking the decomposition rate in the middle of the crop season. Each soil sample was sieved through a 2-mm sieve (the mushroom waste could pass through it) while moist, and 500 g of each sample was stored at 2°C until the SMB-N content was measured. The SMB-N content was measured using the fumigation–extraction method (Amato & Ladd, 1988). The inorganic nitrogen concentration of each sample was determined by extracting the sample with 2 M KCl and performing NH4+ and NO3− assays on the extract (Keeney & Nelson, 1982). The remaining portion of each sample was air-dried, and the total nitrogen and total carbon content (TC) of the soil was determined using an NC analyzer (SUMIGRAPH NC 200F; Sumitomo Chemical, Tokyo, Japan) using the dry combustion method.
We achieved nitrogen-starved soil by applying waste mushroom bed followed by repeated lettuce cropping under different crop management practices, then analyzed correlations among crop yield, SMB, and TN.
The NO3-N content of the soil during the lettuce crop season was very low (2.3–3.1 μg g−1) compared with the threshold of fertilizer application used for conventional cultivation (20 μg g−1) (Breschini & Hartz, 2002; Fox et al., 1989). Table 2 shows the changes in soil properties. The maximum lettuce yield (45 g DM m–2) was higher than the average obtained through conventional farming in Thailand (33 g DM m–2, Department of Agricultural Extension 1996–2001; calculated as 4.1% DM, Food composition table ver. 7). No correlation between soil NO3-N content and yield was found. The order of the yield corresponded with the practices and resulted in correlations among the dry seasons in terms of yield (Figure 1).
| Yielda as dry matter g m−2 | SMB-Nb content in soil μg g−1 | Total N content in soil μg g−1 | ||||||||||||
|---|---|---|---|---|---|---|---|---|---|---|---|---|---|---|
| Crop season | 1d | 2 | 3 | 4 | 1 d | 2 | 3 | 4 | init.c | 1 d | 2 | 3 | 4 | |
| Watering | 0 | 54 | 10 | 13 | 4 | 78 | 35 | 235 | 231 | 407 | 405 | 382 | 362 | 340 |
| Once per week | 59 | 26 | 39 | 22 | 83 | 36 | 399 | 307 | 430 | 397 | 422 | 415 | ||
| Twice per day | 54 | 38 | 37 | 29 | 76 | 48 | 424 | 283 | 418 | 422 | 362 | 412 | ||
| Waste mushroom bed | Alive, mixed | 56 | 29 | 45 | 21 | 85 | 45 | 410 | 319 | 387 | 410 | 383 | 417 | |
| Surface | 44 | 21 | 19 | 17 | 73 | 35 | 323 | 222 | 423 | 380 | 372 | 355 | ||
| Dead, mixed | 67 | 23 | 25 | 16 | 79 | 40 | 324 | 281 | 443 | 410 | 390 | 395 | ||
| Plant density | Standard | 70 | 29 | 33 | 21 | 85 | 37 | 369 | 293 | 415 | 437 | 402 | 387 | |
| Double | 41 | 20 | 26 | 15 | 69 | 35 | 283 | 278 | 403 | 352 | 367 | 355 | ||
| 0 | 83 | 47 | 406 | 251 | 435 | 412 | 377 | 425 | ||||||
| N application g m−2 | 0 | 57 | 28 | 20 | 18 | 75 | 32 | 334 | 250 | 347 | 345 | 317 | 328 | |
| 0.1 | 45 | 18 | 33 | 18 | 91 | 50 | 348 | 264 | 500 | 418 | 380 | 397 | ||
| 10 | 66 | 27 | 37 | 19 | 72 | 38 | 375 | 308 | 407 | 437 | 448 | 442 | ||
| Average | 56 | 24 | 30 | 18 | 79 | 40 | 352 | 274 | 407 | 418 | 400 | 382 | 389 | |
| Min | 41 | 10 | 13 | 4 | 69 | 32 | 235 | 222 | 407 | 347 | 345 | 317 | 328 | |
| Max | 70 | 38 | 45 | 29 | 91 | 50 | 424 | 319 | 407 | 500 | 437 | 448 | 442 | |
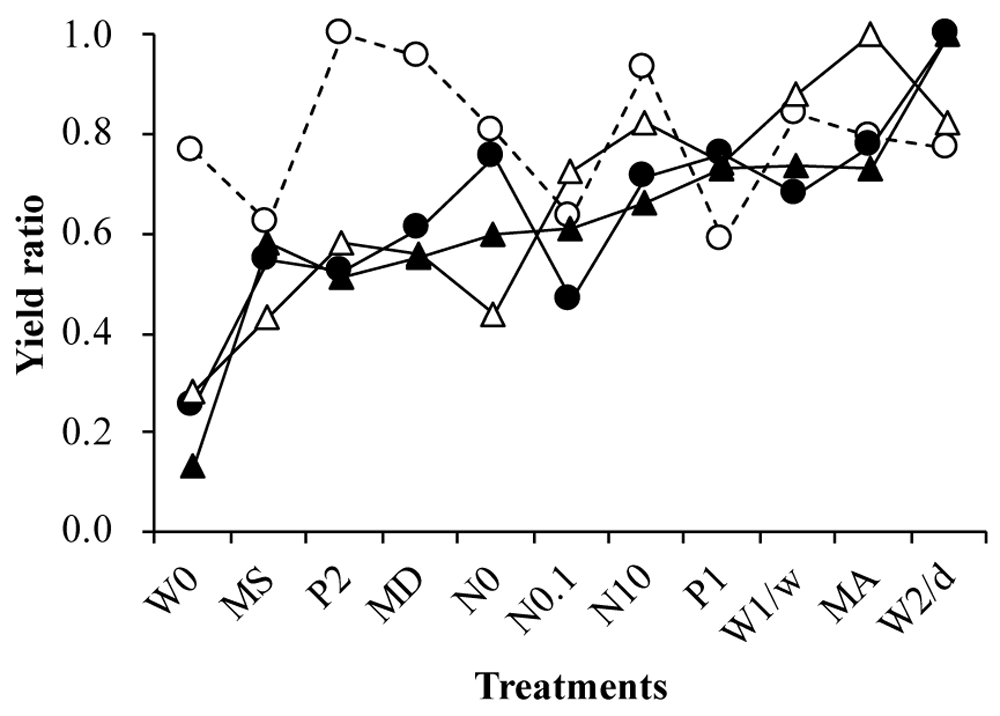
◯Season 1, ●Season 2, △Season 3, ▲Season 4 Mean values (n=4) for different crop management practices are shown. Season 1 was during the rainy season (water spinach) and the others were during the dry season (lettuce). W: Watering (0: none, 1/w: once per week, 2/d: twice per day); M: Material position (S: surface, A: incorporated, D: incorporated following disinfection by the sun); P: Plant density (1: standard, 2: double); N: Nitrogen application (0: none, 0.1: 0.1g m-2, 10: 10g m–2).
The SMB increased remarkably during seasons 3 and 4 (Figure 2). The maximum SMB-N content (424 μg g−1) was an order of magnitude larger than that found in previous studies (Entry et al., 1996; He et al., 1997; Holt & Mayer, 1998). The SMB was lower in season 4 than season 3. The low soil moisture content during the later dry season affected the SMB because of the large effect of watering practice (Table 2). The SMB changed largely according to the practice used to input the same quantity of material. SMB showed a strong correlation with crop yield. The correlation (r = 0.977, p < 0.01) with SMB was stronger than that with TN (r = 0.588, p = 0.06). The SMB was independent of the crop yield because the SMB-N of plant density = 0 was approximately the average for that of the practices (Figure 3).

◯Season 1, ●Season 2, △Season 3, ▲Season 4 Mean values (n=4) for different crop management practices are shown. Season 1 was during the rainy season (water spinach) and the others were during the dry season (lettuce). SMB-N: soil microbial biomass – nitrogen; TN: total nitrogen.

Mean values for different crop management practices for seasons 3 and 4 (n=8). W: Watering (0: none, 1/w: once per week, 2/d: twice per day); M: Material position (S: surface, A: incorporated, D: incorporated following disinfection by the sun); P: Plant density (0: none, 1: standard, 2: double); N: Nitrogen application (0: none, 0.1: 0.1g m-2, 10: 10g m–2); SMB-N: soil microbial biomass – nitrogen.
Despite the 1 kg m–2 crop–1 of waste mushroom bed application (equivalent to 30%, totally 120 %, of the initial topsoil TC contents), TC contents of the initial and the seasonal average were stable (5837, 6071, 5438, 5582, and 5174 μg C g soil−1). The waste mushroom bed applied decomposed within the crop season. This rapid decomposition of organic material in the sandy soil of the tropics is consistent with the findings of a previous study (Chivenge et al., 2011). Soil TN contents were the same (Table 2). The amount of nitrogen applied was 7.5 g m–2 crop–1 (equivalent to 10% of the initial topsoil). The 0.6 g (average DM 24 g * 0.023; Food composition table ver. 7) of nitrogen removal by the crop was negligible compared with the input of nitrogen. There was no leaching because there was no rainfall. Finally, the same amount of nitrogen input was lost to the air by denitrification. We used the 3.1 of the K factor (Amato & Ladd, 1988) multiplied for the calculation of SMB-N and non-fumigation nitrogen; however, that overestimated the nitrogen because the total was larger than TN. The K factor could be different, e.g. 2.5, according to the soil (Joergensen & Brookes, 1990). The K factor does not affect the conclusion from the correlation analysis.
The rate of decomposition differed among the different practices. The rate was slow when there was no fertilizer, surface application, and no watering (Table 3). The application of even a small amount of nitrogen remarkably enhanced the rate of decomposition. A strong correlation was found between the change in TN and the change in TC (0.899 in the first half and 0.935 in the second half). The correlation coefficient for the first half increased to 0.959 excluding the 10g nitrogen addition treatment. The change of TN had a –7.79 of negative correlation between in the first half and the latter half. There were no significant correlations between the release (decrease) of nitrogen and SMB (r = 0,244 and 0.163 for the first and the latter half respectively).
A conventional yield was achieved under conditions of nitrogen starvation. The order of the yield stably corresponded with the management practice used from season 2. From season 3, SMB increased remarkably; the quantity corresponded with the practice in the similar order as the crop yield. As a result, SMB showed a strong correlation with crop yield from season 3. The applied nitrogen contained in the waste mushroom beds was lost via denitrification, and the rate of decomposition (amount of released nitrogen) showed no correlation with yield or SMB. Accordingly, we concluded 1) the correlation between SMB and crop yield is not a causal relationship, 2) the nitrogen source for both is biological nitrogen fixation.
We achieved a conventional yield with a very low NO3-N level. This is inconsistent with nitrogen stock. The same quantity of material was applied each time and the nitrogen equivalent to the applied amount was lost with every crop because TN contents of the initial and the seasonal average were stable, and the change of TC was strongly correlated to that of TN; Namely, no nitrogen from the input remains in the next crop season. In addition, the difference in released nitrogen did not affect either crop yield or SMB. These findings led to the conclusion that the stock-based nutrition balance (including TN) is no longer effective under conditions of nitrogen starvation. On the other hand, crop management practices made a remarkable difference. We conclude the treatments make difference in the flow if there is no difference to the stock.
A robust correlation was seen between yield and SMB. However, this was the same response as seen with the different practices. The response was seen in yield from season 2 earlier than the response in SMB from season 3. Therefore, it is unlikely that the nitrogen flow occurs from SMB to crops.
The reason why the SMB suddenly increased from season 3 is unclear. This may have been affected by changes in the soil, such as structural changes due to aggregation, changes in microbial flora, or the accumulation of substances. In the present work, non-fumigation nitrogen increased monotonously.
As mentioned above, applied nitrogen was not utilized by plants or SMB, and the applied nitrogen was lost by denitrification. Despite the denitrification, SMB was still seen to increase considerably in season 3 and 4. This means that SMB obtains nitrogen via biological fixation. Crops also obtain nitrogen by biological fixation because it is unlikely that the nitrogen flow occurs from SMB to crops. This leads to the idea that the application of organic matter with a high C/N ratio enhances the biological nitrogen fixation in the crop root zone by occurring nitrogen starvation, but not providing nitrogen. The amount of the fixed nitrogen is calculated at most 32.1 g m−2 from the difference of the max and min of SMB in season 3. However, this would be overestimated because the K factor of Amato’s may be unsuitable for our experimental conditions. Microbes within the rhizosphere, endosphere, and phyllosphere of plants interact with crops through numerous mechanisms including nitrogen fixation are gradually clarifying (Compant et al., 2019).
We examined nitrogen flow under conditions of nitrogen starvation through correlation analyses among crops, SMB, and TN. The results showed that the correlation between SMB and crop yield; however, the correlation arises from similar responses to management practices. Namely, the correlation between SMB and crop yield shows no causal relationship. Furthermore, the nitrogen source of both SMB and crop yield are considered biological nitrogen fixation because no correlations were found between the release of nitrogen from applied organic matter and SMB or crop yield. The application of organic matter enhances biological nitrogen fixation by occurring nitrogen starvation but not acting as a nitrogen source. Crop management practices largely affect crop yield. The effect of applying a small amount of nitrogen should be studied to investigate how it can enhance microbial activity. Further study, utilizing 15N natural abundance, will be conducted to determine the source of nitrogen.
Figshare: SMB&Yield.xlsb, https://doi.org/10.6084/m9.figshare.11760963.v1 (Oda & Sukchan, 2020).
Data are available under the terms of the Creative Commons Zero "No rights reserved" data waiver (CC0 1.0 Public domain dedication).
| Views | Downloads | |
|---|---|---|
| F1000Research | - | - |
|
PubMed Central
Data from PMC are received and updated monthly.
|
- | - |
Provide sufficient details of any financial or non-financial competing interests to enable users to assess whether your comments might lead a reasonable person to question your impartiality. Consider the following examples, but note that this is not an exhaustive list:
Sign up for content alerts and receive a weekly or monthly email with all newly published articles
Already registered? Sign in
The email address should be the one you originally registered with F1000.
You registered with F1000 via Google, so we cannot reset your password.
To sign in, please click here.
If you still need help with your Google account password, please click here.
You registered with F1000 via Facebook, so we cannot reset your password.
To sign in, please click here.
If you still need help with your Facebook account password, please click here.
If your email address is registered with us, we will email you instructions to reset your password.
If you think you should have received this email but it has not arrived, please check your spam filters and/or contact for further assistance.
Nevertheless, two main remarks can be made:
- It would have been relevant
... Continue reading The protocol is not easy to understand, so it is difficult to comment on the results obtained.Nevertheless, two main remarks can be made:
Nevertheless, two main remarks can be made: