Keywords
stretching, gait, performance, balance, physical therapy
stretching, gait, performance, balance, physical therapy
Gait is a highly complex motor skill that is classically considered as an integrative measure and a predictor of health in older adults (e.g. 1; cf. also 2 and 3 for recent research topics on this matter). The loss of gait or its alteration with pathological conditions are known to be related to mortality, especially in the elderly (e.g. 4,5), stressing the importance of addressing gait disorders in physiotherapy. Gait requires body propulsion and balance control for safe progression, two “subtasks” that require the coordination of multiple skeletal muscles and the integration of sensory information arising from the vestibular, visual and somatosensory systems6–8. As such, gait may expose populations with sensory or motor deficits to the risk of falling with serious consequences for health and autonomy. For these reasons, improving gait is a major aim in rehabilitation for most neurological/orthopaedic disorders, such as stroke or Parkinson’s disease, and for frail older adults. Various therapeutic methods have been used to improve gait, such as resistance training9, endurance training10, balance training11, whole body vibrations (for a complete review, see Fischer et al., 201912), multi-component exercise programs13 and stretching14.
The successful completion of numerous daily life activities is conditioned by the ability to move efficiently through a sufficient range of motion (ROM)15. Recent studies on gait initiation16–18 and seat-to-stand task19,20 showed that the experimental restriction of postural chain ROM induced by orthosis wear in young healthy adults led to instability and lower motor performance. It is well established that ROM significantly decreases with aging21–26 and more generally with reduced functional demand (e.g. sedentarity, immobilization, disease etc.)15. Consequently, stretching has become an important part of many sport and rehabilitation programs to maintain or improve ROM, reduce stiffness and promote physical activity. This method has been applied in older adults27,28, patients with stroke29, Parkinson’s disease30, multiple sclerosis31, plantar fasciitis32 and spastic paraplegia33, for example. In sport programs, the influence of stretching on motor performance remains an issue of debate, although recent reviews conclude that maximal muscle performance (e.g. force, power, jump height, reaction time, etc.) is impaired primarily immediately after long durations of stretch (>90 seconds)34,35. To date, no review has collected results on the relationship between stretching and locomotor performance in rehabilitation programs.
Hence, the purpose of this article is to analyse the effects of a stretching program on gait in each patient category by means of a systematic literature review and meta-analysis, comparing the gait outcomes of the intervention groups with the control groups. It will contribute to provide evidence-based practice from scientific data in order to integrate stretching in rehabilitation programs in a reasoned manner.
The Preferred Reporting Items for Systematic Reviews and Meta-Analyses (PRISMA) methodology was employed in this systematic review36. A completed PRISMA checklist was submitted to an online repository (Reporting guidelines).
PubMed, Science Direct, Springer and Sage databases were used for a comprehensive systematic literature search for articles published prior to 28 April 2020 with no time limit. In addition, a manual search was conducted using the reference list of selected studies. The keywords used for the search strategy in PubMed were: “stretching” AND (gait OR walk). We included only articles published in English or French.
The selection procedure was conducted by two experts in rehabilitation (TV and AD). Disagreements were discussed with a third expert in a group until a mutual consensus was reached. First, a review was performed on all available titles obtained from the literature search with the selected keywords. All relevant or potentially relevant titles were included in the subsequent phase. Then, the abstracts were reviewed with all relevant or potential articles included in the following phase. Finally, full-text articles were reviewed to ensure that only relevant studies were included. In the same way, reference lists of all included articles were reviewed to possibly include articles through cross-referencing.
We included randomized controlled trials (RCT) and controlled clinical trials (CCT) published in peer-reviewed journals that aimed to explore the effects of stretching on gait parameters. We included all categories of subjects, all stretching techniques and different durations of treatment since standardized protocols are lacking in the purpose of the present study. Gait could be evaluated by functional tests, electromyographic (EMG) or biomechanical analysis. The following exclusion criteria were used: lack of gait assessment, non-application of muscle stretching, multimodal exercise programs, no control group, case report and review.
Data were extracted from the selected articles by one of the authors (TV). The extracted data were checked by another author (AD) and disagreements were resolved with a third (EY).
The following data were extracted for each selected article: (1) the names of the authors and the date of publication; (2) the number of subjects involved in the experiment with their characteristics and breakdown in each group; (3) stretching training details (in the following order: number of participants, stretching technique, muscle groups stretched, number of sets, duration of stretch, frequency, protocol duration); (4) control group details; and (5) the main outcomes related to gait with the main results. When information could not be provided, it was indicated by a “?”.
The PEDro scale was used to assess the risk of bias, and thus the methodological quality of the selected studies37. This scale was chosen for its ability to provide an overview of the external (criterion 1), internal (criteria 2–9) and statistical (criteria 9 and 10) validity of clinical trials. The scale is divided into 11 criteria, but the first is not calculated in the total score. The output of each criterion could be either “yes” (y), “no” (n) or “do not know” (?). A “y” was given a score of one point, while an “n” or “?” was assigned zero points. Studies with a total score of 5–10/10 (≥ 50%) were considered to be of high quality, and scores of 0–4/10 (<50%) of low quality38. Two evaluators independently assessed the quality of the included studies. In the event of disagreement, a group discussion was held with a third expert to reach a consensus.
Estimates of effect sizes (comparing the intervention group and the control group) accompanied with a measure of statistical uncertainty (95% confidence interval [95% CI]) were calculated for each outcome when sufficient data were reported. Estimates of effect sizes were reported by standard mean difference (SMD) and their respective 95% CI. In this way, the magnitude of the overall effect can be quantified as trivial (<0.2), small (0.2–0.49), moderate (0.5–0.79) or large (≥0.8)39,40. When data were lacking to calculate estimates of effect sizes, exact p values were reported.
When at least two studies used the same outcome, meta-analysis was performed, comparing the intervention groups with the control groups. When outcomes were identified in only one study, no meta-analysis could be performed but the effect of intervention was still calculated, reporting the estimate of effect size and its 95% confidence interval. Statistical analysis and figures (i.e. forest plot to facilitate the visualization of values) were produced using a random-effect model in Review Manager software (RevMan, v 5.3, Cochrane Collaboration, Oxford UK). A random-effect model was used to take into account heterogeneity between study effects. Statistical heterogeneity was calculated using the I2 and Cochrane Q statistic tests39. Statistical significance was set at p<0.05.
The strength of evidence of primary outcomes was established as described by Van Tulder et al. 200341 based on effect size estimates with a measure of statistical uncertainty (SMD; 95% CI), statistical heterogeneity (I2) when applicable (multiple studies) and risk of bias (PEDro scale). The level of evidence was considered strong with consistent findings among multiple high-quality RCT (at least two RCT with a PEDro score ≥5/10 that were statistically homogenous: I2 p≥0.05). The level of evidence was considered moderate with consistent findings among multiple low-quality RCT and/or CCT (two trials with a PEDro score <5/10 that were statistically homogenous) and/or one high quality RCT. The level of evidence was considered limited when only one low quality RCT and/or CCT was identified. The level of evidence was conflicting when there was inconsistency among multiple trials (I2 p < 0.05).
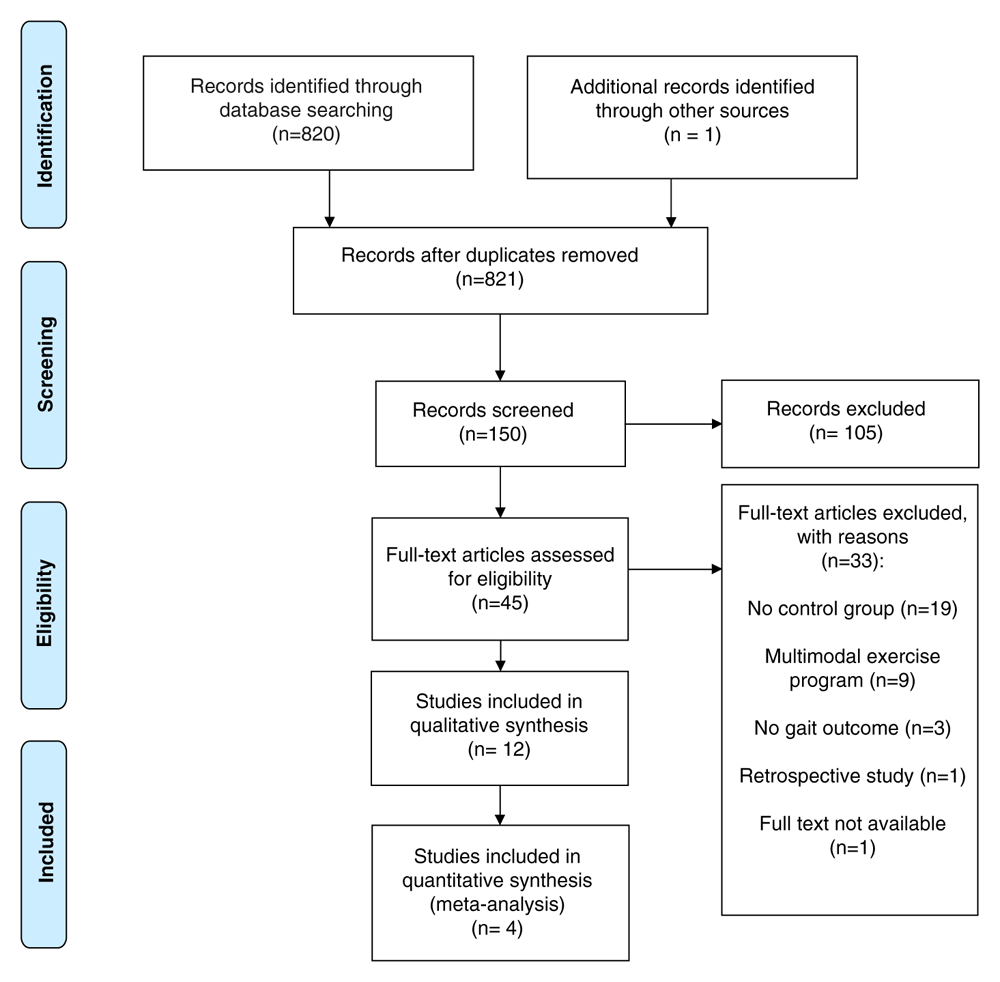
A total of 821 titles were screened in the first search stage, one more was included through cross-referencing, and 671 were excluded because they did not concern our research question. Following exclusion, 150 studies were considered for an abstract review. A further 105 were excluded in this second stage because they did not meet the inclusion criteria. Finally, 45 full-text articles were assessed for eligibility with 33 not accepted (Figure 1).
Thus, 12 articles were ultimately included in this systematic review. Six studies evaluated the effects of stretching in healthy older adults14,42–46, one in a frail elderly population47, one study in an elderly population with stable symptomatic peripheral artery disease48, one in stroke patients49, one study in adults with limited ankle ROM associated with a history of lower limb overuses injury50, one study in healthy adults with limited ankle dorsiflexion range of motion51 and one in healthy young adults52. A summary of the studies selected is provided in Table 1, and their quality assessment is reported in Table 2. The results in different patient categories are reported below.
| Studies | Population | Stretching group | Control group | Outcomes and main results |
|---|---|---|---|---|
| Kerrigan et al., 200344 | 96 healthy older adults, ? (≥65 years) | n= 47, static stretching, hip flexors, 4 sets, 30 seconds, twice daily, 10 weeks | n=49, static shoulder deltoid-stretching, same protocol | No significant difference between groups for hip extension (SMD= 0.22; 95% CI: -0.18, 0.62), hip torque (SMD= 0.35; 95% CI: -0.06, 0.75), anterior pelvic tilt (SMD= -0.35 ; 95% CI : -0.76, 0.05), ankle plantar flexion ROM (SMD= -0.05, 95% CI : -0.45, 0.35), ankle plantar flexion power (SMD= 0.00 ; 95% CI : -0.40, 0.40), hip extension (SMD= 0.22 ; 95% CI : -0.19, 0.62) and hip torque (SMD= 0.35; 95% CI: -0.06, 0.75) |
| Gajdosik et al., 200514 | 19 community dwelling older women, ? (65–89 years) | n=10, static stretching, ankle plantar flexors, 10 sets, 15 seconds, 3 times per week, 8 weeks | n=9, no exercise. | No significant difference between groups for 10MWT (SMD= -0.76; 95% CI: -1.70, 0.18) |
| Christiansen, 200842 | 40 healthy older adults, 72.10±4.70 years | N= 20, static stretching, hip flexors, 3 sets, 45 seconds, twice daily, 8 weeks | n=20, maintain their current level of physical activity | No significant difference between groups for gait speed (SMD= -0.32; 95% CI: -0.97, 0.33), hip extension (SMD= 0.22; 95% CI: -0.43, 0.86), stride length (SMD= - 0.14 ; 95% CI : -0.79, 0.50), ankle dorsiflexion (SMD= 0.29 ; 95% CI : -0.36, 0.94) |
| Cristopoliski et al., 200943 | 20 healthy elderly women, 65.90±4.20 years | n=12, static stretching, hip flexors and extensors, ankle plantar flexors, 4 sets, 60 seconds, 3 sessions per week, 12 sessions | n=8, no specific activity in this period | Significant improvement in favor of stretching group for gait speed (SMD= 1.32 ; 95% CI : 0.32, 2.32), anterior pelvic tilt (SMD= -2.52 ; 95% CI : -3.77, -1.27), stand phase duration (SMD= -1.92; 95% CI: -3.04, -0.81), swing phase duration (SMD= 1.92 ; 95% CI : 0.81, 3.04), double support phase duration (SMD= -1.69; 95% CI: -2.76, -0.62), step length (SMD= 1.37 ; 95% CI : 0.36, 2.38) and pelvic rotation (SMD= 1.37 ; 95% CI : 0.36, 2.38) No significant difference between groups for cycle duration (SMD= - 0.24 ; 95% CI : -1.14, 0.66), heel-contact velocity (SMD= -0.46 ; 95% CI : -1.37, 0.45), toe clearance (SMD= 0.91 ; 95% CI : -0.04, 1.86), lateral pelvic tilt (SMD= 0.93 ; 95% CI : -0.02, 1.88) and knee range of motion (SMD= 0.23 ; 95% CI : -0.67, 1.12) |
| Watt et al., 201146 | 82 healthy elderly subjects, 72,6±6 years | n= 43, static stretching, hip flexors, 2 sets, 60 seconds, 2 sessions daily stretching, 10 weeks | N= 39, shoulder abductor static stretching, same protocol | Significant improvement in favor of stretching group for gait speed (SMD= 0.47; 95% CI: 0.03, 0.91) No significant difference between groups for hip extension (SMD= 0.18; 95% CI: -0.25, 0.62), anterior pelvic tilt (SMD=0.07 ; 95% CI : -0.36, 0.51), stride length (SMD= 0.54 ; 95% CI : -0.01, 1.08) |
| Locks et al., 201245 | 23 healthy older individuals, 67.5±2.12 years | n=10, static stretching, knee extensors, ankle dorsiflexor, knee flexors, ankle plantar flexors, 4 sets, 60 seconds, twice a week ,12 weeks | n=13 a one-hour seminar on healthy living every four weeks and did not perform any physical or therapeutic exercise. | No significant difference between groups for 6MWT (SMD= -0.04; 95% CI : -0.86, 0.79) |
| Watt et al., 201147 | 74 frail elderly subjects, 77.00±8.00 years | n=33, static stretching, hip flexors, 2 sets, 60 seconds, 2 sessions per day, 10 weeks | n=41, shoulder abductor stretching program, same protocol | No significant difference between groups in peak hip extension, (SMD= 0.22; 95% CI: -0.24, 0.68), anterior pelvic tilt (SMD= -0.05; 95% CI: -0.51, 0.41) and cadence (SMD= 0.13; 95% CI: -0.33, 0.59) Significant improvements in favor of the stretching group in walking speed and stride length (both SMD= 0.49; 95% CI: 0.03, 0.96) |
| Hotta et al., 201948 | 13 elderly patients with symptomatic peripheral artery disease, ? | n= 13, static stretching, ankle plantar flexor stretching, 1 set, 30 minutes, 5 sessions per week, 4 weeks | n= 13, no stretching intervention (cross- over intervention) | Significant improvements in favor of the stretching group for both total walking distance and continuous walking distance with large effect sizes (SMD= 1.56; 95% CI: 0.66, 2.45 and SMD= 3.05; 95% CI: 1.86, 4.23 respectively) |
| Kim et al., 201349 | 24 patients with stroke, 53.30±3.16 years | n=12, static stretching, ankle plantar flexors, 1 set, 20 minutes, 4 times a week, 4 times a week, 6 weeks | n= 12, conventional physical therapy as in in the stretching group | No significant difference between groups in sway of the center of pressure (SMD=0.75; 95% CI: -0.09, 1.58) |
| Johanson et al., 200650 | 19 adults with limited passive ankle- dorsiflexion range of motion (less than 8 degrees) and a history of lower limb overuse injury, 30.30± 9.80 years | n=11, static stretching, ankle plantar flexors, 5 sets, 30 seconds, 2 times daily, 3 weeks | n= 8, continue all of their usual activities | No significant difference between groups in ankle dorsiflexion during gait in both right and left ankle (SMD= 0.50; 95% CI: -0.42, 1.43 and SMD= 0.41; 95% CI: -0.52, 1.33 respectively) and for time-to-heel-off during the stance phase of gait in both right and left ankle (SMD= -0.50; 95% CI: -1.43, 0.43 and SMD= -0.48; 95% CI: -1.41, 0.45 respectively) |
| Johanson et al., 200951 | 16 healthy adults with limited passive ankle- dorsiflexion range of motion (less than 5 degrees), 27.40±8.20 years | n=8, static stretching, ankle plantar flexors, 4 sets, 30 seconds, 2 times daily, 3 weeks | n=8, no physical activity or stretching programs involving the lower extremities for 3 weeks | No significant difference between groups in ankle dorsiflexion (SMD= 0.53; 95% CI: -0.48, 1.53), maximum knee extension (SMD= -0.07; 95% CI: -1.05, 0.91), medial and lateral gastrocnemius activities (SMD= 0.37; 95% CI: -0.62, 1.36 and SMD= 0.00; 95% CI=: -0.98, 0.98 respectively) |
| Godges et al., 199352 | 16 healthy, athletic, male college students, 21.00±l.00 years | n=9, static stretching, hip flexors, 3 sets, 2 minutes, 2 sessions per week, 3 weeks | n=7, continue their current activity levels | No significant difference between groups in gait economy (SMD= 0.83; 95% CI: -0.21, 1.87) |
Healthy older adults
Description of the studies and quality assessment
Six studies examined the effects of stretching on healthy elderly subjects14,42–46. Regarding the characteristics of the subjects, the average sample size was 46.6±33.9 subjects (ranging from 1914 to 96 subjects44) and the mean age was 70.1±3.6 years (ranging from 65.4043 to 75.30 years14). Regarding the characteristics of the training programs, the average training duration was 8.6±2.7 weeks (ranging from 443 to 12 weeks45), with an average frequency of 8.3±6.2 sessions per week (ranging from 245 to 14 sessions42,44,46). The average number of sets per session was 4.5±2.8 sets (ranging from 246 to 10 sets14), with an average stretching time of 45.0±18.9 seconds (ranging from 1514 to 60 seconds43,45,46). Static stretching was provided in all studies. The muscle groups stretched were the hip flexors42–44,46, ankle plantar flexors14,42,43,45, ankle dorsiflexors45, hip extensors43, knee extensors and flexors45. There was great heterogeneity in gait outcomes. Angular variables during gait included peak hip extension42,44,46, ankle plantar flexion during gait44, ankle range of motion during gait43, anterior pelvis tilt43,46, knee range of motion43, pelvic rotation43, lateral pelvic tilt43 and hip range of motion43. Spatiotemporal variables were: gait speed42,43,46, stance and swing durations43, double support phases43, step length43 and stride length43,46. Kinetic variables were hip torque44 and ankle plantar flexion power44. Finally, two functional tests were used: the 10-meter walk test (10MWT)14 and the 6-minute walk test (6MWT)45. Regarding the quality of the studies, the average PEDro score was 4.6±1.6 and one study was identified as a non-randomized trial45. The range of score varied from 345,46 to 714.
Meta-analyses
Four meta-analysis were conducted for the following outcomes (Figure 2): gait speed, stride length, hip extension during gait and anterior pelvic tilt.
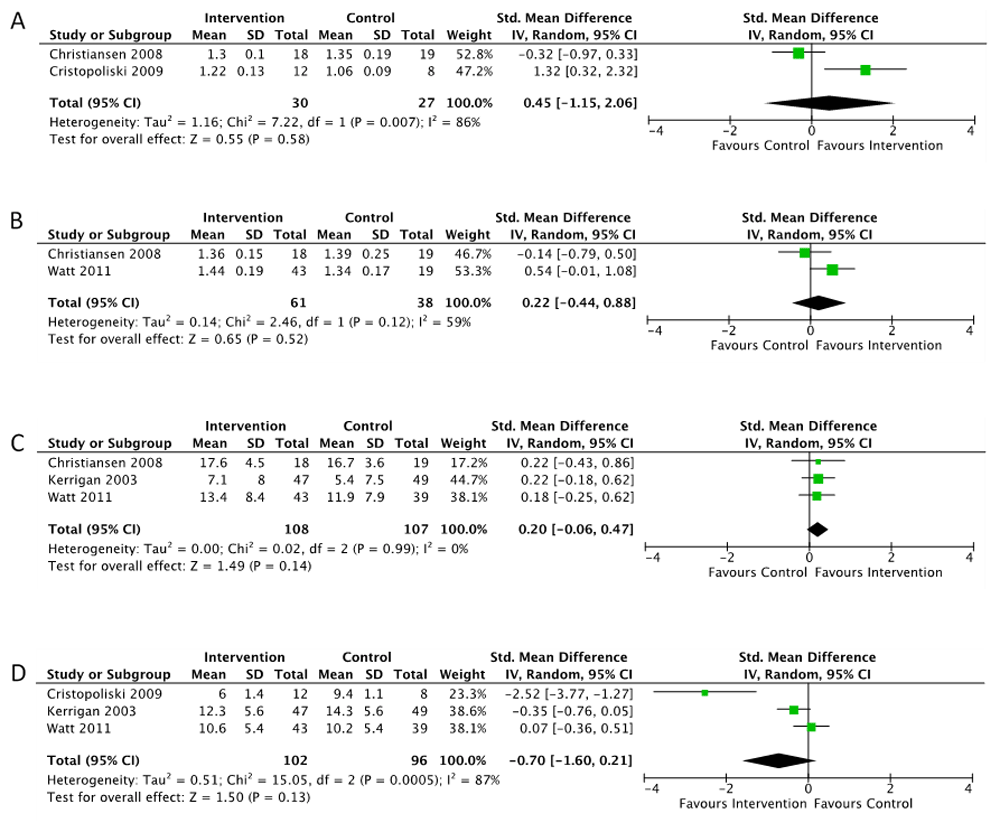
Comparisons between intervention and control groups for gait speed (A), stride length (B), hip extension (C) and anterior pelvic tilt (D) in healthy older adults.
Gait speed: For gait speed (Figure 2A), two studies were included in the meta-analysis42,43. One study was excluded because intervention and control groups were not similar at baseline46. Statistical analysis showed no significant difference between groups (SMD= 0.45; 95% CI: -1.15, 2.06), with heterogeneous results (I2=86%, p=0.007). Thus, the level of evidence was conflicting.
Stride length: For stride length (Figure 2B), two studies were included in the meta-analysis42,46. Statistical analysis showed no significant difference between groups (SMD= 0.22; 95% CI: -0.44, 0.88), with consistent results (I2=59%, p=0.12). Only one study was of high quality42, thus a moderate level of evidence supports the lack of beneficial effect of stretching to improve stride length in the elderly.
Hip extension: For hip extension during gait (kinematic data) (Figure 2C), three studies were included in the meta-analysis42,44,46. Statistical analysis showed no significant difference between groups (SMD= 0.20; 95% CI: -0.06, 0.47), with consistent results (I2=0%, p=0.99). Two studies were of high quality42,44, thus a strong level of evidence supports the lack of beneficial effect of stretching to improve hip range of motion during gait in the elderly.
Anterior pelvic tilt: For anterior pelvic tilt (Figure 2D), three studies were included in the meta-analysis42,44,46. Statistical analysis showed no significant difference between groups (SMD= -0.70; 95% CI: -1.60, 0.21), with heterogeneous results (I2=87%, p<0.01). Thus, the level of evidence was conflicting.
Effects of interventions in other outcomes
For the outcomes below, no meta-analysis could be performed because only one study was identified. Nevertheless, for each outcome, effect size estimates with a measure of statistical uncertainty (95% CI) were provided.
Angular variables during gait initiation: The study of Christiansen et al. (2008)42 showed no significant difference between stretching and control groups for ankle dorsiflexion during gait (SMD=0.29; 95% CI: -0.36, 0.94) with a moderate level of confidence (PEDro score: 5/10). The study of Kerrigan et al. (2003)44 showed no significant difference between groups for ankle plantar flexion (SMD=-0.05; 95% CI: -0.45, 0.35), with a moderate level of confidence (PEDro score: 6/10). The study of Cristopoliski et al. (2009)43 showed no significant difference between groups for lateral pelvic tilt (SMD= 0.93; 95% CI: -0.02, 1.88) and knee range of motion (SMD= 0.23; 95% CI: -0.67, 1.12), with a moderate level of confidence (PEDro score: 6/10).
Kinetic variables: The study of Kerrigan et al. (2003)44 showed no significant difference between groups for hip torque (SMD= 0.35; 95% CI: -0.06, 0.75) and ankle plantar flexion power (SMD=0.00; 95% CI: -0.40, 0.40), with a moderate level of confidence (PEDro score: 6/10).
Spatiotemporal variables: The study of Cristopoliski et al. (2009)43 showed no significant difference between groups for cycle duration (SMD= -0.24; 95% CI: -1.14, 0.66), heel contact velocity (SMD= -0.46; 95% CI: -1.37, 0.45) and toe clearance (SMD= 0.91; 95% CI: -0.04, 1.86). However, the study showed significant decreases with large effect sizes in stance phase duration (SMD=-1.92; 95% CI: -3.04, -0.81), double support phase duration (SMD= -1.69; 95% CI: -2.76, -0.62) in favour of the stretching group as compared to the control group. Additionally, the authors found significant increases with large effect sizes of swing phase duration (SMD=1.92; 95 CI: 0.81, 3.04) and step length (SMD=1.37; 95% CI: 0.36, 2.38) in favour of the stretching group as compared to the control group. The study obtained a PEDro score of 6/10, thus, the level of evidence for these outcomes was moderate.
Functional tests: The study of Gajdosik et al. (2005)14 showed no significant difference between groups for the 10MWT (SMD= -0.76; 95% CI= -1.70, 0.18), with a moderate level of confidence (PEDro score: 7/10). The study of Locks et al. (2012)45 showed no significant improvement of the 6MWT in favour of the stretching group as compared to the control group (SMD= -0.04; 95% CI:-0.86, 0.79) with a limited level of confidence (low quality CCT with a PEDro score of 3/10).
Frail elderly
Description of the study and quality assessment
The study of Watt et al. 2011 examined the effects of stretching on frail elderly subjects47. Regarding the characteristics of the subjects, 74 subjects were included, and the mean age was 77.0±8.0 years. Regarding the characteristics of the training programs, the stretching program lasted ten weeks, with a frequency of 14 sessions per week (two sessions per day). Participants performed two sets per session, holding the stretch for 60 seconds (static stretching), alternating the right and left limb (four minutes in total). The muscle group stretched was the hip flexors. The outcomes were cadence (steps/minute), walking speed (meters/second), stride length (meters) peak hip extension (degree) and peak anterior pelvic tilt (degree). Regarding the quality assessment, the study was identified as RCT and had an average PEDro score of 3 (low level of evidence).
Effects of intervention
The study of Watt et al. (2011) showed no significant difference between groups in angular variables, i.e. peak hip extension and anterior pelvic tilt (SMD= 0.22; 95% CI: -0.24, 0.68 and SMD= -0.05; 95% CI: -0.51, 0.41 respectively). There was also no significant difference for cadence (SMD= 0.13; 95% CI: -0.33, 0.59). However, the study showed significant improvements in favour of the stretching group with small effect sizes in some performance-related variables, i.e. walking speed and stride length (both SMD= 0.49; 95% CI: 0.03, 0.96).
Elderly with symptomatic peripheral artery disease
Description of the study and quality assessment
The study of Hotta et al. (2019) examined the effects of stretching in elderly with symptomatic peripheral artery disease48. Regarding the characteristics of the subjects, 13 subjects were included and the mean age was not mentioned. Regarding the characteristics of the training programs, the stretching program lasted four weeks, with a frequency of five sessions per week. Participants performed one set daily, holding the stretch for 30 minutes (static stretching with splints). The muscle group stretched was ankle plantar flexors. The gait outcome was 6MWT. Regarding the quality assessment, the study was identified as RCT and had an average PEDro score of 5 (moderate level of evidence).
Effects of intervention
The study of Hotta et al. (2019) showed significant improvements in favour of the stretching group for both total walking distance and continuous walking distance with large effect sizes (SMD= 1.56; 95% CI: 0.66, 2.45 and SMD= 3.05; 95% CI: 1.86, 4.23 respectively).
Stroke
Description of the study and quality assessment
The study of Kim et al. (2013) examined the effects of stretching on stroke patients49. Only a static muscle stretching training group and control group were included in the analysis. Regarding the characteristics of the subjects, 24 subjects were included, and the mean age was 53.3±3.1 years. Regarding the characteristics of the training programs, the stretching program lasted six weeks, with a frequency of four sessions per week. Participants performed one set per session, holding the stretch for 20 minutes (static stretching). The muscle group stretched was ankle plantar flexors. The outcome was the sway of the centre of pressure during the stance phase. Regarding the quality assessment, the study was identified as CCT and had an average PEDro score of 3 (low level of evidence).
Effects of intervention
The study of Kim et al. (2013) showed no significant difference between groups in the sway of the centre of pressure (SMD=0.75; 95% CI: -0.09, 1.58).
Young adults with limited ankle range of motion and a history of lower limb overuse injury
Description of the study and quality assessment
The study of Johanson et al. (2006) examined the effects of stretching on healthy adults with limited passive ankle-dorsiflexion range of motion (less than eight degrees) and a history of lower limb overuse injury50. Regarding the characteristics of the subjects, 19 subjects were included and the mean age was 30.3±9.8 years. Regarding the characteristics of the training programs, the stretching program lasted three weeks, with a frequency of two sessions per day. Participants performed five sets per session, holding the stretch for 30 seconds (static stretching). The muscle group stretched was ankle plantar flexors. The outcomes were ankle dorsiflexion and time-to-heel-off during the stance phase of gait. Regarding the quality assessment, the study was identified as RCT and had an average PEDro score of 5 (moderate level of evidence).
Effects of intervention
The study of Johanson et al. (2006) showed no significant difference between groups in ankle dorsiflexion during gait in both the right and left ankle (SMD= 0.50; 95% CI: -0.42, 1.43 and SMD= 0.41; 95% CI: -0.52, 1.33 respectively). There was also no significant difference between groups for time-to-heel-off during the stance phase of gait in both the right and left ankle (SMD= -0.50; 95% CI: -1.43, 0.43 and SMD= -0.48; 95% CI: -1.41, 0.45 respectively).
Young adults with limited ankle range of motion
Description of the study and quality assessment
The study of Johanson et al. (2009) examined the effects of stretching on young adults with limited passive ankle-dorsiflexion range of motion (less than five degrees)51. Regarding the characteristics of the subjects, 16 subjects were included, and the mean age was 27.4±8.2 years. The characteristics of the training programs were the same as described above50. The muscle group stretched was the ankle plantar flexors. The outcomes were maximum ankle dorsiflexion, maximum knee extension and EMG amplitude of the gastrocnemius during the stance phase of gait. Regarding the quality assessment, the study was identified as RCT and had an average PEDro score of 6 (moderate level of evidence).
Effects of intervention
The study of Johanson et al. (2009) showed no significant difference between groups in angular variables during gait, i.e. maximum ankle dorsiflexion and maximum knee extension (SMD= 0.53; 95% CI: -0.48, 1.53 and SMD= -0.07; 95% CI: -1.05, 0.91 respectively). There was also no significant difference between groups for EMG variables, i.e. medial and lateral gastrocnemius activity (SMD= 0.37; 95% CI: -0.62, 1.36 and SMD= 0.00; 95% CI=: -0.98, 0.98 respectively).
Healthy young adults
Description of the study and quality assessment
The study of Godges et al. (1993) examined the effects of stretching on healthy young adults52. Only a static hip extension stretching group and control group were included in the analysis. Regarding the characteristics of the subjects, 16 subjects were included, and the mean age was 21.0±1.0 years. Regarding the characteristics of the training programs, the stretching program lasted three weeks, with a frequency of two sessions per week. Participants performed three sets per session, holding the stretch for two minutes (static stretching). The muscle group stretched was the hip flexors. The outcome was walking economy (ml/kg/min). Regarding the quality assessment, the study was identified as RCT and had an average PEDro score of 5 (moderate level of evidence).
Effects of intervention
The study of Godges et al. (1993) showed no significant difference between groups in gait economy in terms of oxygen consumption (SMD= 0.83; 95% CI: -0.21, 1.87).
The aim of this systematic review was to determine the effects of a stretching program on human gait by means of a systematic literature review and meta-analysis. Twelves studies were identified in six different patient categories. Statistical analyses showed no strong level of evidence supporting the beneficial effect of a stretching program to improve any gait outcome. The major issue in conducting meta-analyses and establishing strong level of evidences was the great heterogeneity in gait variables. The results obtained in the different patient categories are discussed in detail below.
The healthy older adult population was the most studied. Two muscle groups were systematically stretched in the six identified studies: hip flexors42–44,46,47 and ankle plantar flexors14,42,43. Hip flexor stiffness, associated with reduced hip extension during gait has been demonstrated in the elderly and may alter gait53,54. In the same way, decreased calf muscle length associated with restricted dorsiflexion range of motion is well documented in older adults26,55,56. A decreased ankle dorsiflexion ROM has been correlated with poorer balance test scores in the elderly57 and may contribute to an increased risk of falls58. All the studies included in the present analysis showed that specific stretching programs were efficient to improve passive range of motion of the targeted joints, but results are more heterogeneous regarding gait performance and dynamic ROM. This led to inconsistency in the results or the impossibility to conclude with a strong level of evidence that a stretching program improves gait in healthy older adults. Moreover, when improvement in ROM or gait performance occurred, it was not associated with a significant increase in dynamic hip extension or ankle dorsiflexion. Only trends toward increased dynamic ROM after stretching interventions were observed42,44,46. This observation was consistent in young adults.
In stroke patients, ankle plantar flexor stretching has been successfully used to improve ankle stiffness59–62. Decreased plantar flexors stiffness may have a beneficial effect on postural control during gait because triceps surae is known to play an important role during gait63–65 and an increase in muscle stiffness might alter synergistic muscle activities during human gait. However, only one non-randomized study49 was identified and included in the current systematic review. Other studies that used stretching in multicomponent programs66–68 or in control groups69,70 were identified but excluded because of the addition of resistance training or the lack of a control group. Nevertheless, it should be noted that some studies showed improvements between pre- and post-stretching conditions. Forrester et al. (2014) showed that both robotic ankle mobilizations and manual ankle stretching improved gait velocity in stroke patients at hospital discharge compared to baseline69. Similarly, Park et al. (2018) showed that both static ankle stretching and ankle mobilizations improved gait speed after four weeks of treatment compared to baseline70. Other authors showed that one week of immobilization in dorsiflexed position (casting) followed by one week of plantar flexor stretching and gait training improved gait performances in 10MWT and 6MWT66. Hence, these encouraging results suggest that further randomized controlled trials of good quality are needed to explore the ability of ankle stretching to improve gait parameters in stroke or in other neurological diseases exposing patients to joint stiffness, e.g. Parkinson’s disease71.
In healthy adults, the interest of practicing stretching to improve gait seems limited as they are assumed to have sufficient mobility for walking. Moreover, the included study involved athletic males52, a population that is known to be more flexible than inactive persons72. Even in young adults with limited ankle ROM, stretching did not improve dynamic dorsiflexion during gait50,51. Stretching programs in apparently healthy adults should be more indicated after a prolonged period of reduced functional demand (e.g. immobilization, sedentarity), when ROM is insufficient to practice a specific activity or when high levels of flexibility are required for sport performance (e.g. gymnastics or dance) and in sports that involve stretch-shortening cycles (e.g. basketball, volleyball)15.
Twelve studies were identified, involving a total of 442 subjects. Despite some improvements in isolated studies, statistical analyses showed no strong level of evidence supporting the beneficial effect of using stretching alone to improve gait outcomes in rehabilitation programs. The major obstacle in conducting meta-analyses and establishing strong levels of evidence were the great heterogeneity in gait variables and the low quality of the included studies. Because the effects of stretching are not clear, further randomized controlled trials of good quality are needed to understand the impact of stretching on human gait. Currently, stretching is more recommended to maintain and improve ROM rather than improve gait parameters and should be integrated in multicomponent programs.
All data underlying the results are available as part of the article and no additional source data are required.
Harvard Dataverse: PRISMA checklist and PRISMA flow diagram for ‘Effects of stretching exercises on human gait: a systematic review and meta-analysis’, https://doi.org/10.7910/DVN/N8ZXNB73.
Data are available under the terms of the Creative Commons Zero "No rights reserved" data waiver (CC0 1.0 Public domain dedication).
| Views | Downloads | |
|---|---|---|
| F1000Research | - | - |
|
PubMed Central
Data from PMC are received and updated monthly.
|
- | - |
Provide sufficient details of any financial or non-financial competing interests to enable users to assess whether your comments might lead a reasonable person to question your impartiality. Consider the following examples, but note that this is not an exhaustive list:
Sign up for content alerts and receive a weekly or monthly email with all newly published articles
Already registered? Sign in
The email address should be the one you originally registered with F1000.
You registered with F1000 via Google, so we cannot reset your password.
To sign in, please click here.
If you still need help with your Google account password, please click here.
You registered with F1000 via Facebook, so we cannot reset your password.
To sign in, please click here.
If you still need help with your Facebook account password, please click here.
If your email address is registered with us, we will email you instructions to reset your password.
If you think you should have received this email but it has not arrived, please check your spam filters and/or contact for further assistance.
Comments on this article Comments (0)