Keywords
mobile elements, atlas, large-scale, genome-wide, standardized, plants
This article is included in the Bioinformatics gateway.
This article is included in the Genomics and Genetics gateway.
mobile elements, atlas, large-scale, genome-wide, standardized, plants
The growing number of sequenced plant genomes is providing unprecedented opportunities for biological studies, evolution, and growing of many algal and Viridiplantae species. We estimate more than 13k plant genomes have been released (NCBI), revealing that plant genomes are faintly explored. High diversity in terms of ploidy, heterozygosity, and genome size, probably due to a dynamic set of old and recent bursts of transposable elements (TEs), are common hallmarks of many plant genomes.1 TEs can comprise between 32% to 56% (Utricularia genomes),2,3 to up to 90% in many plant genomes,4–6 e.g., maize7 and wheat.5,8,9
TEs can be organized into two main classes. Each class is hierarchically organized into orders, superfamilies, families, and subfamilies. This terminology is primarily associated with the type of their transposition mechanisms.3,10 They are classified into: (i) retrotransposons (Class I), which are propagated by a “copy-and-paste” mobility mechanism and are the most redundant TE class in plant genomes; and (ii) DNA transposons (Class II), which are known for the “cut-and-paste” mechanism that allows them to move to a completely different position. Moreover, both Classes may contain autonomous members10,11 for which the transposition mechanism depends on an autonomous and cognate type of TE.11,12
However, despite their significance, in-depth identification and analysis of TEs content in the sequenced plant genomes remains barely explored.13,14 The lack of concise data available may prevent the enrichment of in silico, functional genomics research and compromises the appearance of new strategies to investigate TEs. Recently, many computational models and entire wet-lab efforts have increasingly been helping to understand these sequences.15–18 For example, Ensembl Plants19 provides high-quality, primary genomic information for 67 plant (in the broad sense, including green plants, green and red algae) genomes, assembled near or at chromosome scale; however, mobile sequences are poorly systematized and have a humble coverage.
These observations prompted us to standardize tools and methods aiming to improve TE detection, annotation and standardization. In this work, we developed a new method for systematic annotation of plant TEs, using the 67 genomes available at Ensembl Plants assembled at chromosome scale as a starting point. Our identification was standardized, applying the same methodologies to all genomes and delivering a concise Atlas of TEs annotation in plant genomes. We also provided an updated analysis of non-coding RNAs (ncRNAs) overlapping TEs. This annotation is accessible on the Atlas website for exploration and download, which might be relevant to any type of research involving mobile sequences.
All genomes (Supplementary Material 1, Extended data) were downloaded from the Ensembl Plants19 database, version 41 (57 genomes) and 45 (plus 10 new genomes).
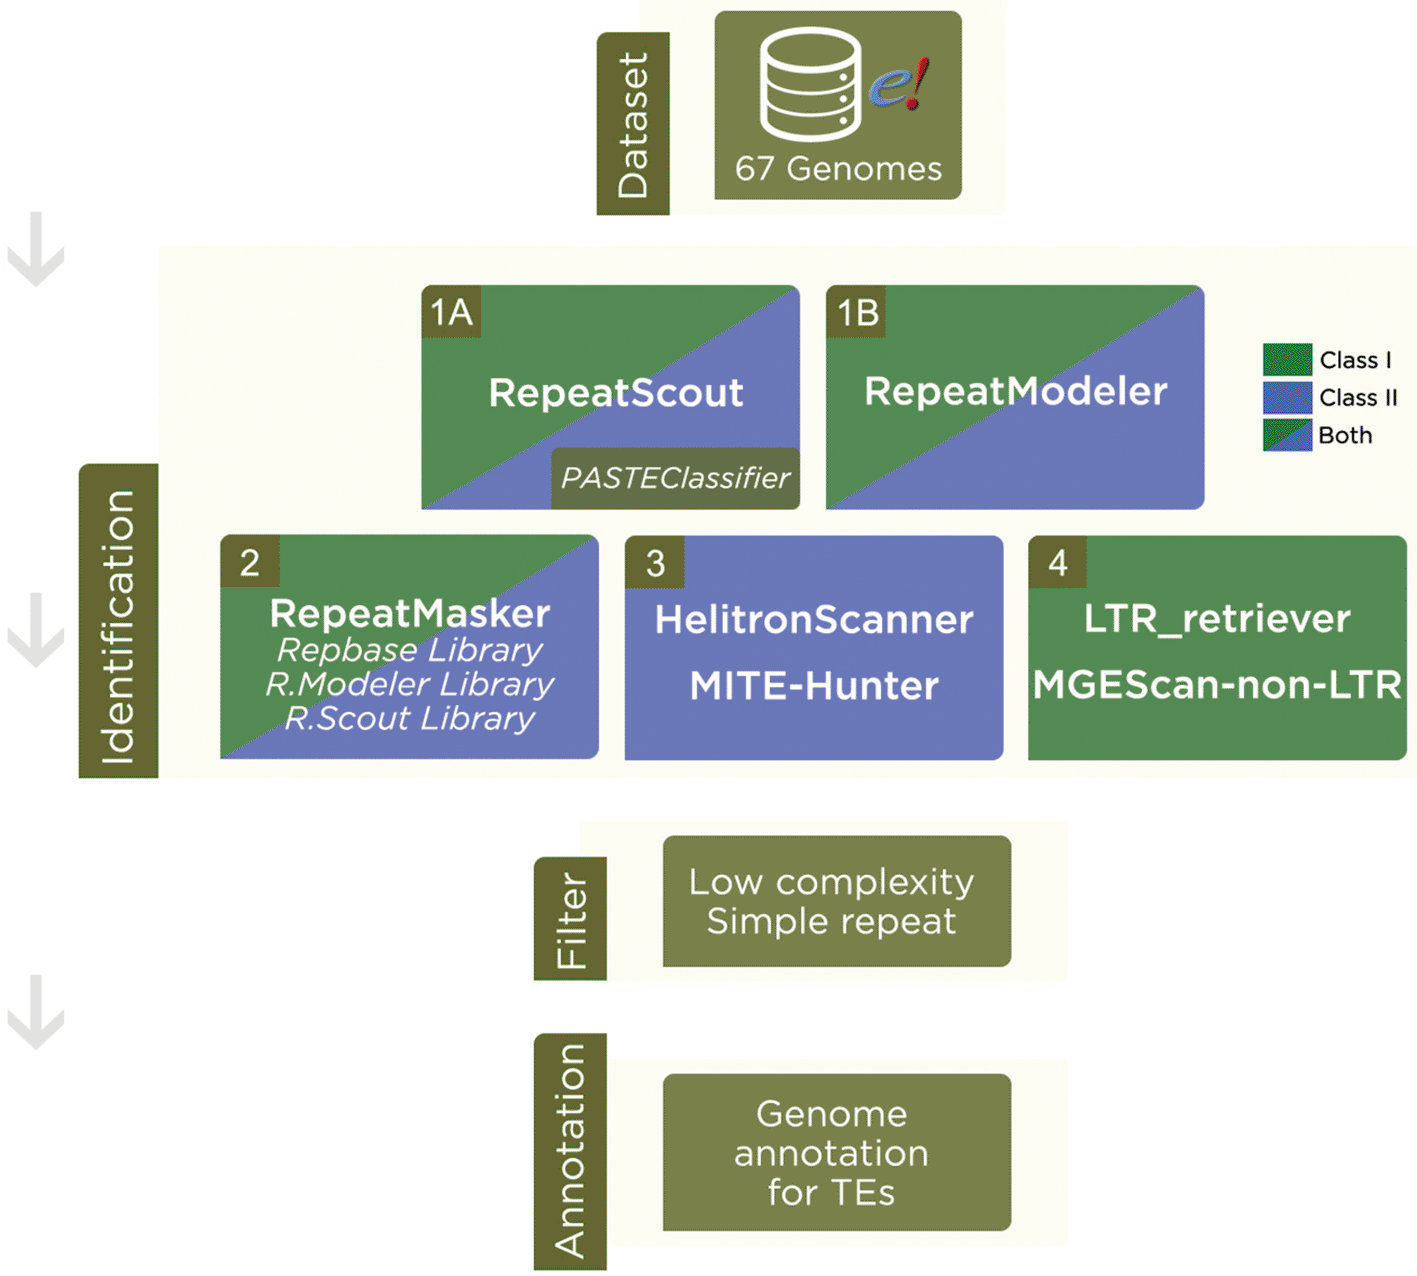
We used similarity-based methods and de novo techniques to build a collection of putative transposable elements, based on the SPTEdb pipeline.21 We refined, extended and increased steps in order to produce a novel annotation (Figure 1). Our reformulated steps (details in Supplementary Material 2, Extended data) guarantee a comprehensive knowledgebase of these TEs.

Dataset: Genome assemblies were downloaded from Ensembl Plants. Identification: 1A) RepeatScout was used to search for putative repetitive sequences and further classification by PASTEClassifier, resulting in a library. 1B) RepeatModeler was also used to find a consensus of TEs sequences. 2) RepeatMasker was run with Repbase library and libraries from RepeatModeler and RepeatScout. 3) For Class II - Subclass 2 TEs, we also used HelitronScanner and MITE-Hunter. 4) In order to find LTR and Non-LTR retrotransposons, we used LTR_retriever and MGEScan-non-LTR, respectively. Filter: A cut-off filter was applied to remove low complexities, simple repeats and other nomenclatures that were not classified into TEs. Annotation: In result of the pipeline, we have a Transposable Element annotation for each genome analyzed.
RepeatScout was performed separately; the output was unified in a library to be labeled by PASTEClassifier32 and later combined into a final annotation. To automate the pipeline, an in-house framework in Perl language was developed for each software output to be uniformized, described in steps 1 to 4. A main script in Bash starts the process of automatization using Perl scripts. All steps were supervised by researchers, carefully checked, and the output was manually verified at each step for each genome. Records classified as low complexity, simple repeat and other nomenclature not related to Class I or Class II TEs were discarded.
Due to the extensive genome sizes of Triticum aestivum (14,5 Gb), Triticum dicoccum (10,4 Gb) and Triticum turgidum (10,4 Gb), we adapted our pipeline for their analysis, based on the approach of Jamilloux et al.24 For these species, we applied our pipeline on chromosome 1 (which is the longest pseudomolecule), as the large genomes were eventually duplicated into new copies, increasing the number of these same repeats in the genome, and did not significantly impact discoveries related to new or different TEs families.24
TE evidence score
To test the reliability of our TE annotation pipeline, we scored sequences that had duplicated annotation in the same loci (Figure 2). We developed a statistical metric (labeled as TE-Score, shown in each record as the ninth column for each genome annotation file) that identify and ponder sequences types that have been identified by the programs. The TE-Score is a metric (0 to 1) that is given by
where QIP = Quantity of identification by program and QP = Quantity of programs. To illustrate an average of the amount sequences annotation by programs, see Figure 2.To test for correlations between genome size and transposable elements percentage by genome in base pairs, we first normalized using log10, and then we applied the Pearson Correlation Coefficient in SPSS version 25.
APTE is hosted at the Universidade Tecnológica Federal do Paraná (Cornélio Procópio, PR, Brazil). It uses Debian 11 as operating system, Apache 2 as web server, PHP 5.6 as web programming language. We also used Zend Framework 2, which implements model, view, controller (MVC), a methodology for web development that can be expanded for any future additional functionality. On the front-end, we used HyperText Markup Language 5 (HTML5), Cascading Style Sheet 3 (CSS3) and JavaScript to perform dynamic functions that provide user-friendly navigation. A built-in genome browser (JBrowse, version 1.14.1) is available to visualize and download the data as well.
To run the pipeline described in Figure 1, we used three platforms: (i) to runRepeatModeler,25,26 RepeatScout,26,27 RepeatMasker,27 LTR_retriever,28 MITE-Hunter29 and HelitronScanner30; (ii) to perform MGEScan-non-LTR31 and PASTEClassifier32; and (iii) to unify and filter outputs to the main annotation. The hardware utilized were (i) Xeon E7540 2.00 GHz 256GB memory, Xeon E5-2620v3 2.40 GHz 64GB memory, 2x Intel i7-3820 3.60Ghz 32GB memory and Intel i7-3820 3.60Ghz 64GB memory, (ii) Intel i7-3820 3.60Ghz 64GB memory, and (iii) Intel Core 2 Duo 2.4 GHz 8GB memory, a total of 30 physical cores and 456 GB of memory. In order to present a scale of time elapsed to measure, filter and standardize the results, we estimate that for the A. thaliana genome, the time needed to get the final annotation was ~18 hours, using all resources mentioned, including post-processing scripts (detailed on our website).
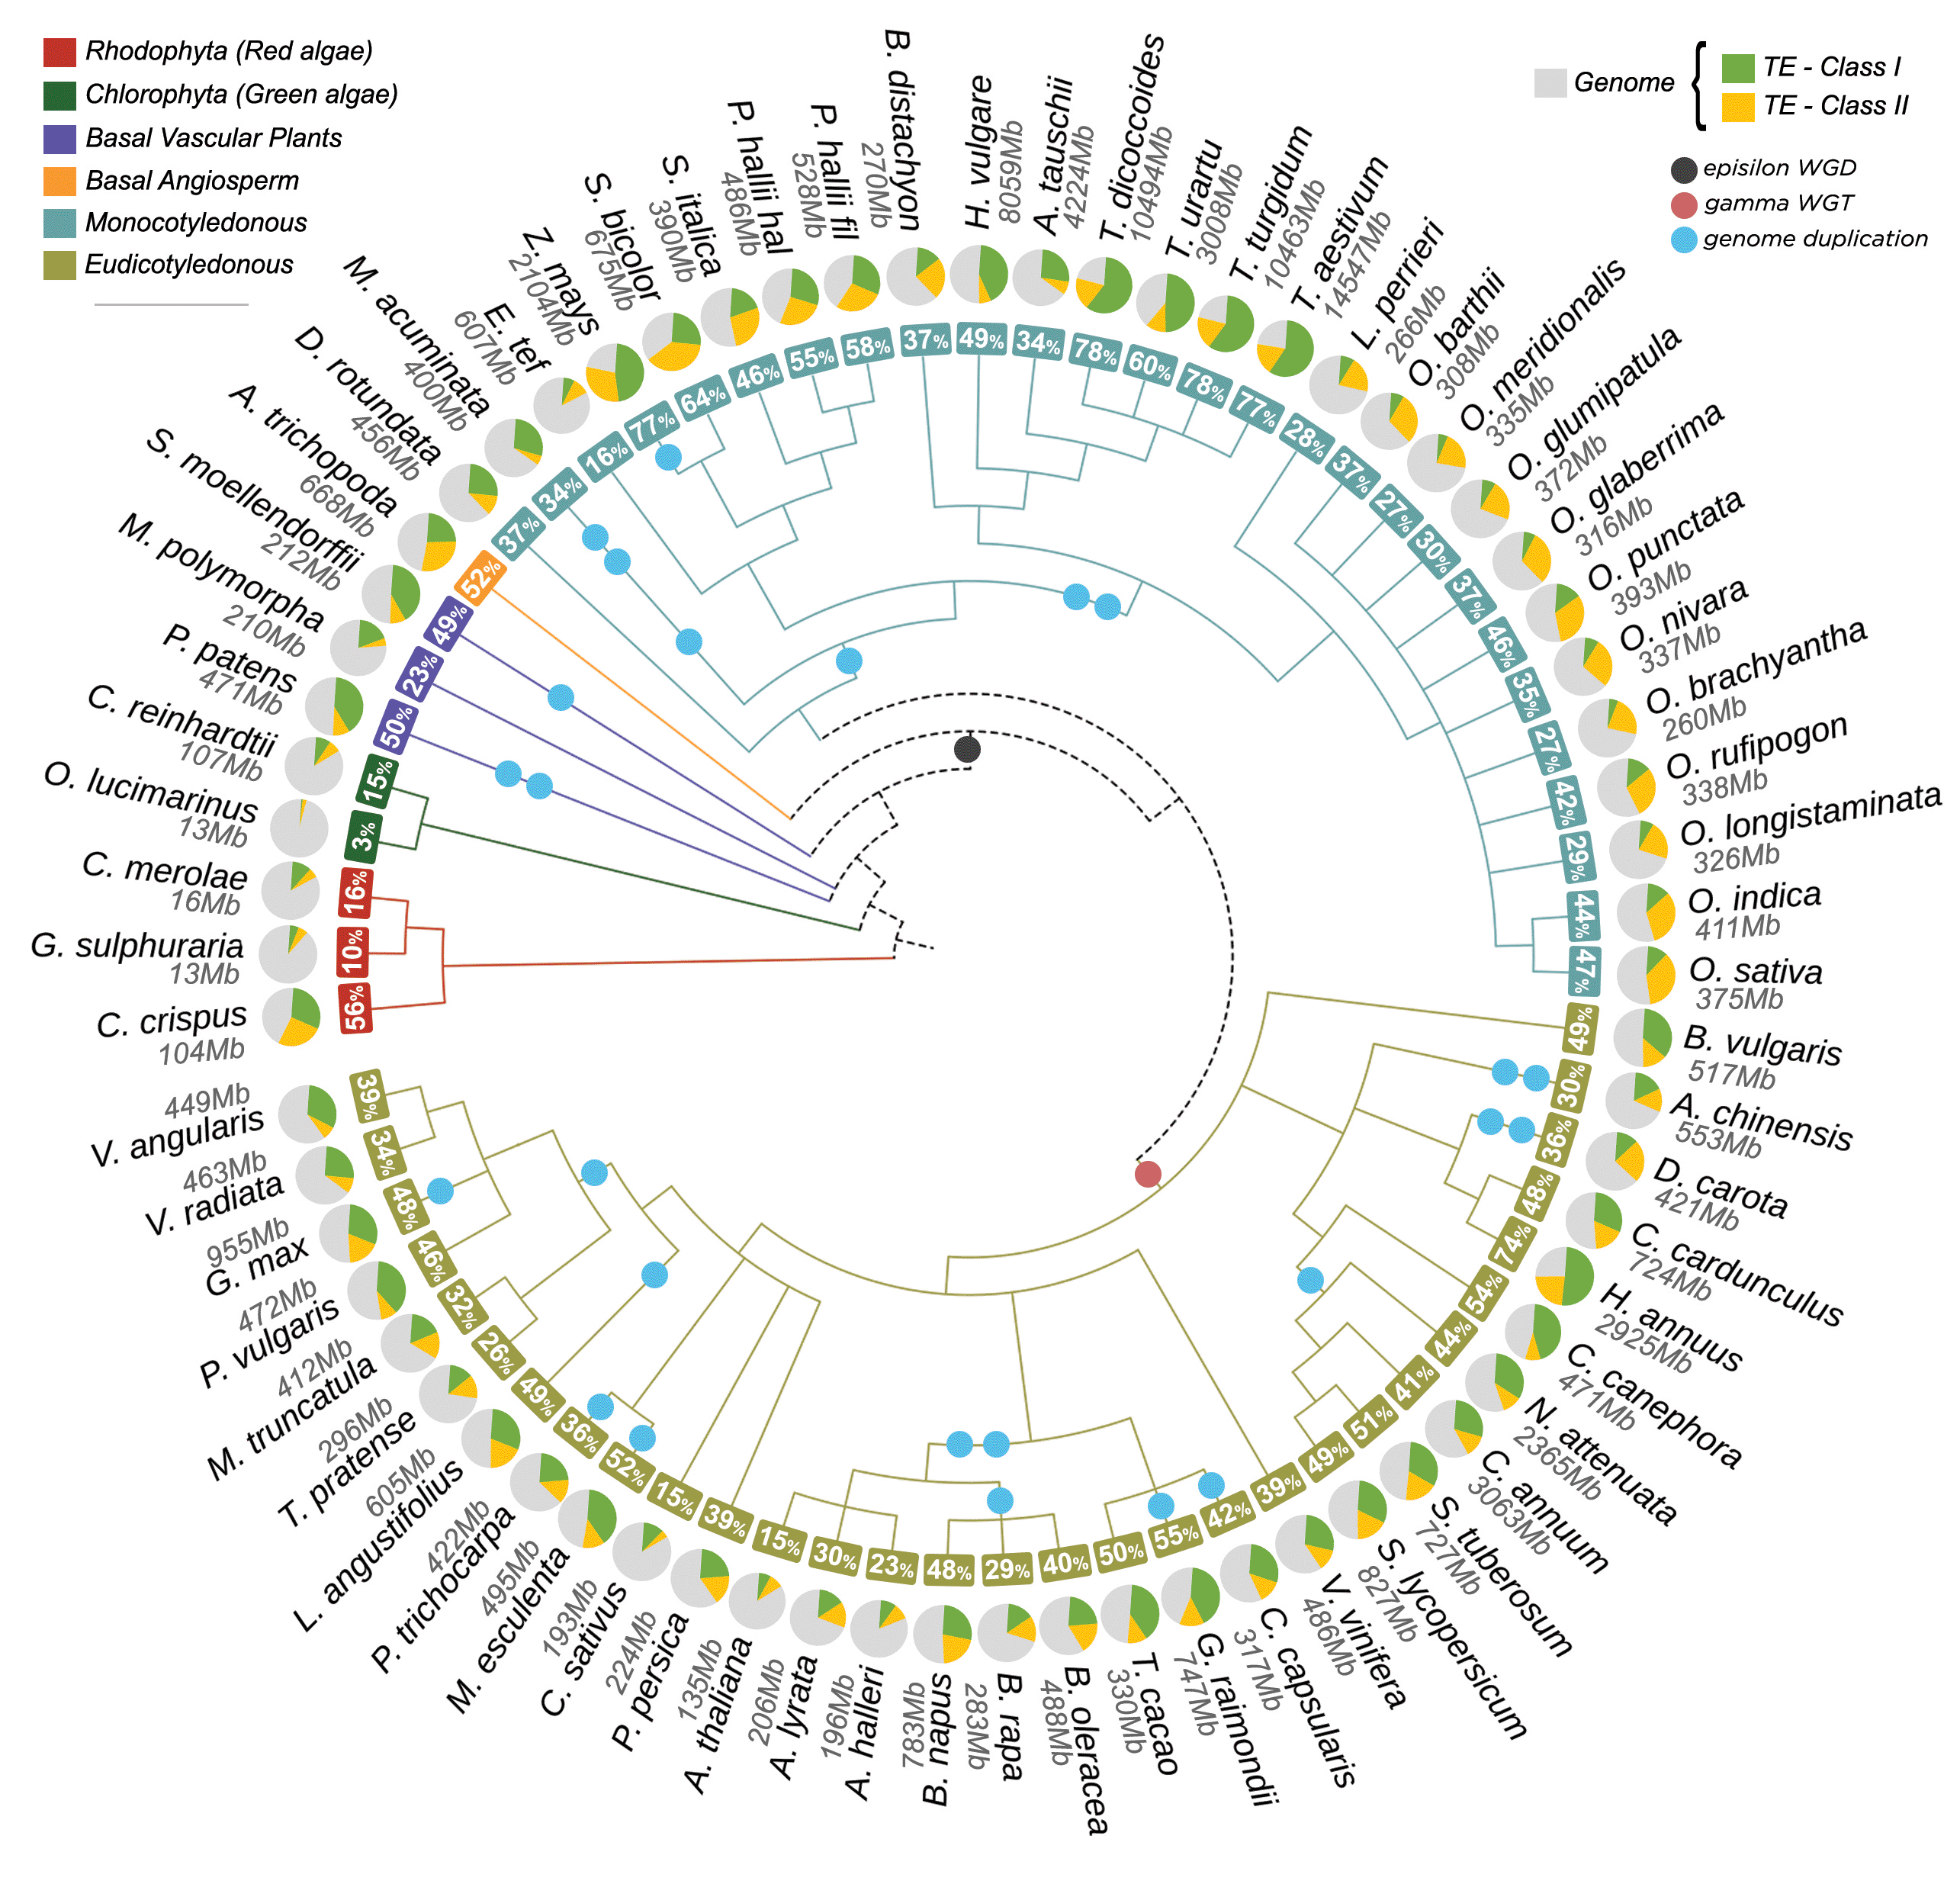
We retrieved a total of 49,802,023 TE records from 67 plant genomes, representing a total of 47,992,091,043 (~47,62%) base pairs (bp) of the total genomic space. This information is distributed in ~57,36% (28,565,034) TEs organized into class, order and superfamily. In addition, ~42,64% (21,236,989) elements could not be assigned to any type of known TE and they were labelled as unknown. They likely represent chimeric and/or partial elements for which we were not able to perform the full classification. For known TEs, we identified that ~62,85% were retrotransposons, and ~37,15% were DNA transposons. All assigned classifications of TEs identified along the 67 genomes are shown in Figure 3. The distribution of TEs in the analyzed genomes are somewhat similar (Figure 4), especially in genomes that have a shorter phylogenetic distance (e.g., Oryza spp, Triticum spp). However, even close-related genomes exhibit uneven TEs distribution (e.g., Arabidopsis spp). Two main hypotheses might explain the variation of TE content: (a) different evolutionary stories, since the two major genome duplication events are shared by all seed plants (epsilon) and flowering plants (gamma), followed by the lineage-specific duplication events,20 and (b) specific pressures to maintain, expand and purge TEs in each lineage.

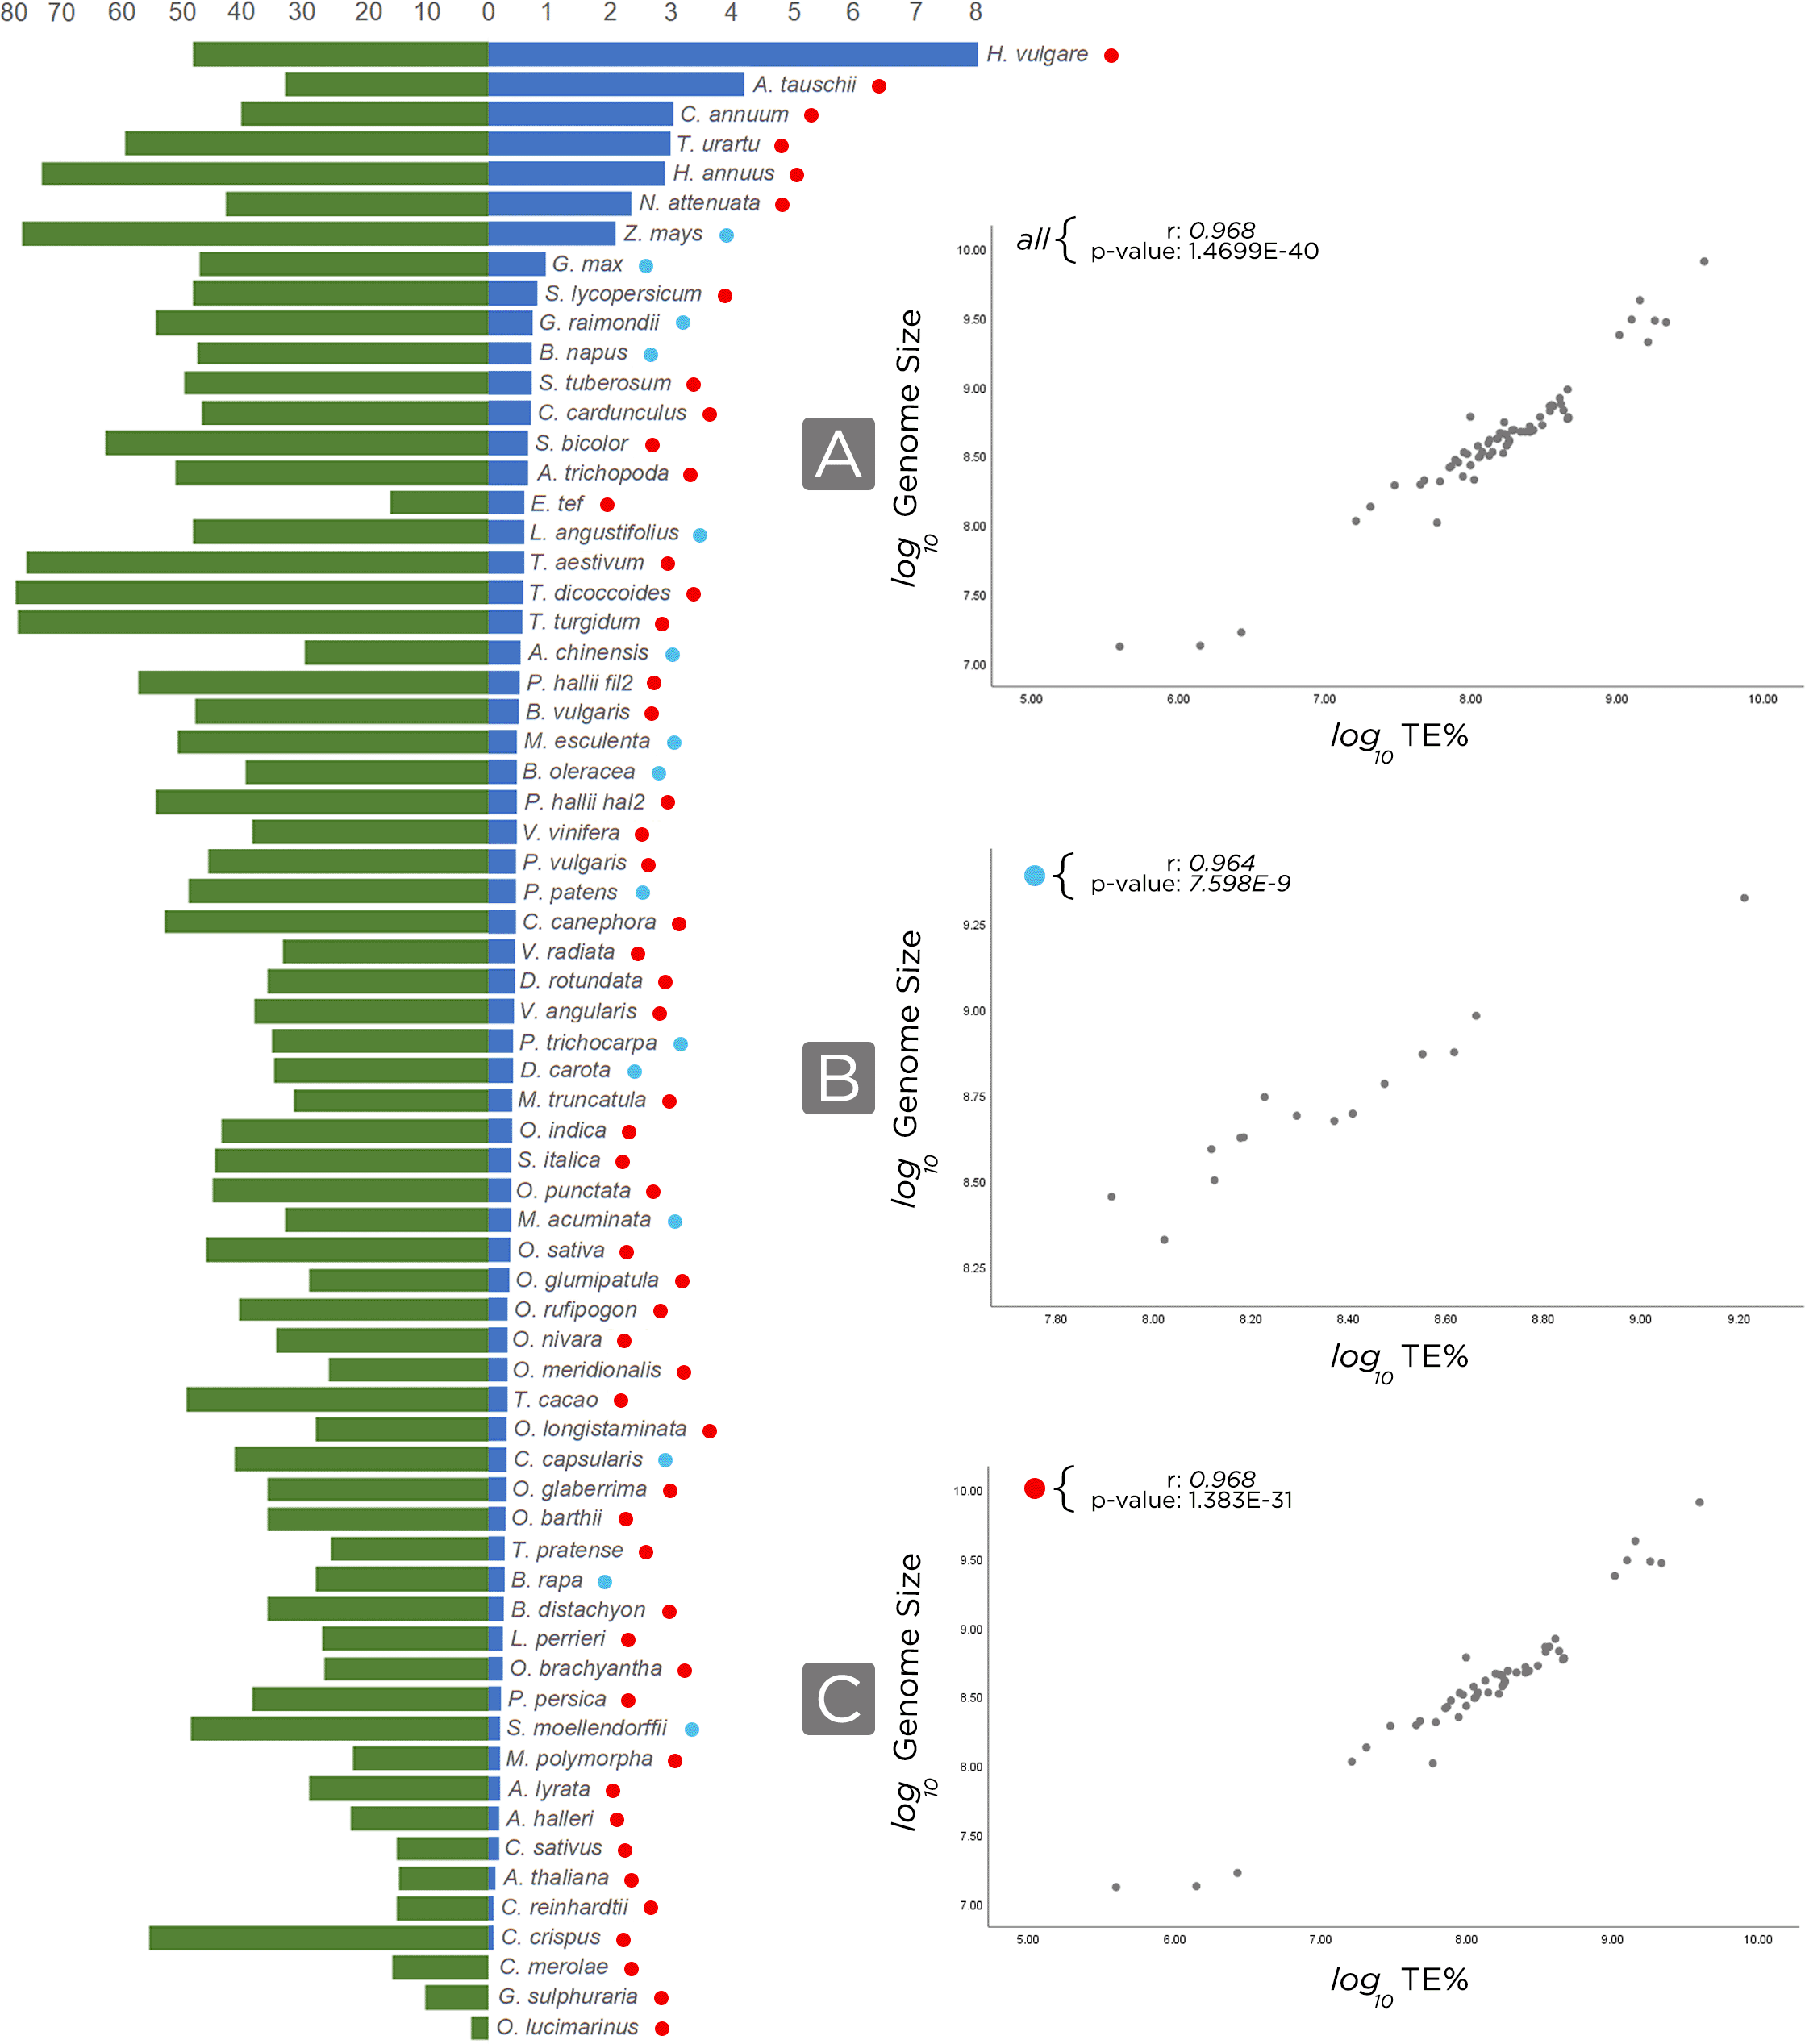
We have noted that our approach permitted better TE annotations in genomes assembled at chromosome scale, and we also observed that the amount of TEs is generally related to the genome size, since larger genomes have higher occurrences of TEs (Figure 5). However, for incompletely and draft-assembled genomes, it tends to decrease the number of TEs, once the assembly into small parts (scaffolds or contigs) may impact the genome assembly quality, collapsing repeated contigs (mostly TE- derived) and interfering with the proper identification of these TEs.

On the left, the bar chart in blue, the genome size (in Gb), and, in green, the transposable elements distribution in analyzed genomes (in percentage). On the right, we normalized, in base pair, genome size and TE using log(10) and then we correlated (Pearson) the genome size by transposable elements. r and p-value are shown in the top-left of each chart. A) Using all the 67 annotated genomes; B) For all genomes with recent WGD (Whole Genome Duplication) events, blue circles; C) Excluding genomes that experienced recent WGD, red circles.
To compare the results of the identification performed and to ensure the reliability (details in Supplementary Material 1, Extended data) of our approach, we used SPTEdb21 annotation data of the genome Populus trichocarpa (black cottonwood), which is explored in Table 1. The second comparison of TE annotations was performed for the Glycine max (soybean) genome, in which we used SoyTEdb22 to compare the amount vs. type of TEs, shown in Table 1. A third comparison used data from GrTEdb23 to explore the amount of TEs in Gossypium raimondii (cotton), available in Table 1.
Our analysis brought an exhaustive, systematic and comprehensive genome identification in plant genomes, using seven programs to annotate TEs in plant genomes. In both TE classes, several orders and superfamilies were found ubiquitously in all genomes. Additionally, 21,236,989 out of 49,802,023 mapped TE sequences could not be classified into any of the nomenclatures known for TEs, and were labeled as “Unknown” in GFF3, a standard file format for gene annotation.
For plant species whose TE complement may be quite well-annotated, i.e., Arabidopsis thaliana, we yielded an increased number of identified TEs. In species with less curated annotation in Ensembl, we were able to deliver a more detailed identification of TEs. For example, in three particular genomes, i.e., Populus trichocarpa (black cottonwood), Glycine max (soybean) and Gossypium raimondii (cotton), we increased the TE identification levels by 2,295%, 900% and 2,643%, respectively. We observe that for several other genomes, new types of TEs were identified and annotated; this ensures that our pipeline delivers not only the same TE identification, but also new ones, making the annotation process possible to use for any species.
In this study, we contributed to expand the knowledge on TEs, by providing a large-scale, organized and standardized TE Atlas. We integrated all annotations to make it available to download in each genome separately from the Atlas of Plant Transposable Elements (APTE) website. An example how our pipeline works using the A. thaliana genome, software dependencies, and in-house scripts developed, which can be downloaded, used and changed freely, are available from https://github.com/daniellonghi/te_pipelinehttps://github.com/alerpaschoal/apte_pipeline/.
All data underlying the Plant TE Atlas is available in the portal http://apte.cp.utfpr.edu.br/.
Zenodo: Datasets from An Atlas of Plant Transposable Elements, https://doi.org/10.5281/zenodo.5672122.33https://doi.org/10.5281/zenodo.5574528
This project contains the following extended data:
- SuppMat_1.xlsx (the gen ome assembly reference access from Ensembl Plants species used)
- SuppMat_2.docx (a brief transposable elements annotation steps used in this work)
Data are available under the terms of the Creative Commons Zero “No rights reserved” data waiver (CC0 1.0 Public domain dedication).
Analysis code available at: https://github.com/alerpaschoal/apte_pipeline/
Archived code at time of publication: https://doi.org/10.5281/zenodo.5672122
License: CC0
| Views | Downloads | |
|---|---|---|
| F1000Research | - | - |
|
PubMed Central
Data from PMC are received and updated monthly.
|
- | - |
Is the work clearly and accurately presented and does it cite the current literature?
Yes
Is the study design appropriate and is the work technically sound?
Yes
Are sufficient details of methods and analysis provided to allow replication by others?
Yes
If applicable, is the statistical analysis and its interpretation appropriate?
Yes
Are all the source data underlying the results available to ensure full reproducibility?
Yes
Are the conclusions drawn adequately supported by the results?
Yes
References
1. Wicker T, Sabot F, Hua-Van A, Bennetzen J, et al.: A unified classification system for eukaryotic transposable elements. Nature Reviews Genetics. 2007; 8 (12): 973-982 Publisher Full TextCompeting Interests: No competing interests were disclosed.
Reviewer Expertise: Transposable elements
Is the work clearly and accurately presented and does it cite the current literature?
Yes
Is the study design appropriate and is the work technically sound?
Yes
Are sufficient details of methods and analysis provided to allow replication by others?
Yes
If applicable, is the statistical analysis and its interpretation appropriate?
Not applicable
Are all the source data underlying the results available to ensure full reproducibility?
Yes
Are the conclusions drawn adequately supported by the results?
Yes
Competing Interests: No competing interests were disclosed.
Reviewer Expertise: Bioinformatics, Genomics, Mobile elements, Repetitive DNA, Non-coding RNAs
Alongside their report, reviewers assign a status to the article:
| Invited Reviewers | ||
|---|---|---|
| 1 | 2 | |
|
Version 1 24 Nov 21 |
read | read |
Provide sufficient details of any financial or non-financial competing interests to enable users to assess whether your comments might lead a reasonable person to question your impartiality. Consider the following examples, but note that this is not an exhaustive list:
Sign up for content alerts and receive a weekly or monthly email with all newly published articles
Already registered? Sign in
The email address should be the one you originally registered with F1000.
You registered with F1000 via Google, so we cannot reset your password.
To sign in, please click here.
If you still need help with your Google account password, please click here.
You registered with F1000 via Facebook, so we cannot reset your password.
To sign in, please click here.
If you still need help with your Facebook account password, please click here.
If your email address is registered with us, we will email you instructions to reset your password.
If you think you should have received this email but it has not arrived, please check your spam filters and/or contact for further assistance.
Comments on this article Comments (0)