Keywords
virtual microscopy, digital cytology, whole slide image, annotation, assessment, visualization, bioimage informatics, JavaScript
This article is included in the NEUBIAS - the Bioimage Analysts Network gateway.
This article is included in the Bioinformatics gateway.
virtual microscopy, digital cytology, whole slide image, annotation, assessment, visualization, bioimage informatics, JavaScript
The acquisition and use of whole-slide images (WSIs) is rapidly growing in research and medical practice1,2. The use of WSIs is often referred to as virtual microscopy, due to the appealing ability to digitally recreate the microscopy experience. WSIs are produced by high-resolution scanning of entire microscopy glass slides. The resulting images are often larger than 100,000 × 100,000 pixels and many gigabytes in size; one single image of a cytological or histological specimen may contain more than 100,000 cells. The ability to inspect and annotate WSIs and therefrom derive results has become a crucial component of many bioimage analysis workflows and is also making headway into modern clinical practice. The sheer size of WSI data, where a single image may be larger than the available RAM memory of a standard workstation, is problematic for many standard visualization tools, imposing a need for specialized software solutions.
There is lately a strong desire within the scientific community towards increased use of open and collaborative solutions and the development of open-source software (OSS)3. A strong argument for the open philosophy is that it efficiently reduces the risk for vendor lock-in situations, where a customer using a proprietary product or service cannot easily transition to another technology due to incompatibilities, inefficient processes, or contract constraints.
A variety of OSS project that support WSIs exist, examples include caMicroscope4, Digital Slide Archive5, Sedeen viewer6, TissUUmaps7, Cytomine8, OMERO9, and QuPath10. The vast majority of existing WSI tools are developed with histology in mind, whereas cytology is only recently gaining increased attention.
One specificity of cytopathological analysis, as compared to tissue based histopathological analysis, is the need for several focus levels. Where a tissue sample provides a reasonably flat surface, cells of a cytological sample are distributed in a layer of a certain thickness, from a few micrometers for a liquid-based sample, up to several tens of micrometers for a smear. The depth of field of a high resolution light microscope is often below 1 µm, and microscopic analysis of cytological specimen typically involves adjusting focus individually for each cell. A skilled cytopathologist utilizes the limited depth of focus as a way to separate overlapping cells and also to get a 3D feeling of the sample. To accommodate this property in virtual microscopy, it is common to acquire several focal layers of a specimen and create a so called z-stack. Several studies have examined the importance of z-stacking for whole slide imaging; Hanna et al.,11 conclude that z-stacks offer a superior mechanism for overcoming focusing problems encountered with digital cytology slides, while Lu et al.,12 demonstrated that even such a small deviation from the in-focus plane as 0.8 µm may have a clear negative impact on deep learning-based classification performance. Visual assessment of scanned samples requires easy interactive inspection at multiple resolutions and focus levels, but only very few of the above mentioned OSS solutions offer smooth and fast handling of z-stacks, where changing focus is as easy as in a light microscope.
A great benefit of virtual microscopy over optical microscopy is the possibilities for sharing and collaboration. Digitized WSIs can be made accessible via the Internet, thereby enabling efficient usage of distributed resources and reaching remote parts of the world. Tools for interactive visualization and collaborative assessment of WSIs facilitate improved understanding as well as increased quality of analysis, where several experts may share experiences. Collaborative tools for WSI annotations are also gaining popularity in medical education; in a mixed methods trial13 it was found that collaborative WSI annotation provided superior understanding of key microscopic features by senior medical students as compared to individual WSI annotation.
Despite the growing number of tools for WSI visualization and annotation, we find that there is a lack of light-weight, easy to use OSS tools which are well suited for collaborative annotation of cytological data. The majority of existing tools are directed towards histopathology, with different needs and requirements. Aiming to gather the experience and knowledge of experts from all over the globe, an easy to use, browser-based solution, which may be directly utilized on any computer or tablet without need for software installation, is highly desired. The ability for several users to simultaneously view and comment the same sample improves understanding and analysis quality. The CytoBrowser software, presented here, aims to meet all of these needs and desires. It delivers easy and flexible access to WSIs through a browser-based interface, see Figure 1 for an example view. CytoBrowser aims to well replicate the optical microscope feeling, with good support for z-stacks. A growing set of annotation tools are well suited for cytological data. Efficient collaboration is achieved through shared views, with option to follow the view of another user. Annotations may be added and commented on concurrently by several users. The software, completely in JavaScript and Node.js, is light-weight and very easy to install and run. CytoBrowser is typically hosted as a web service, but may also be used locally. We share the source code of CytoBrowser openly and freely under the GNU General Public License v3.0, with the hope that a growing community of users will jointly contribute to its further improvement.
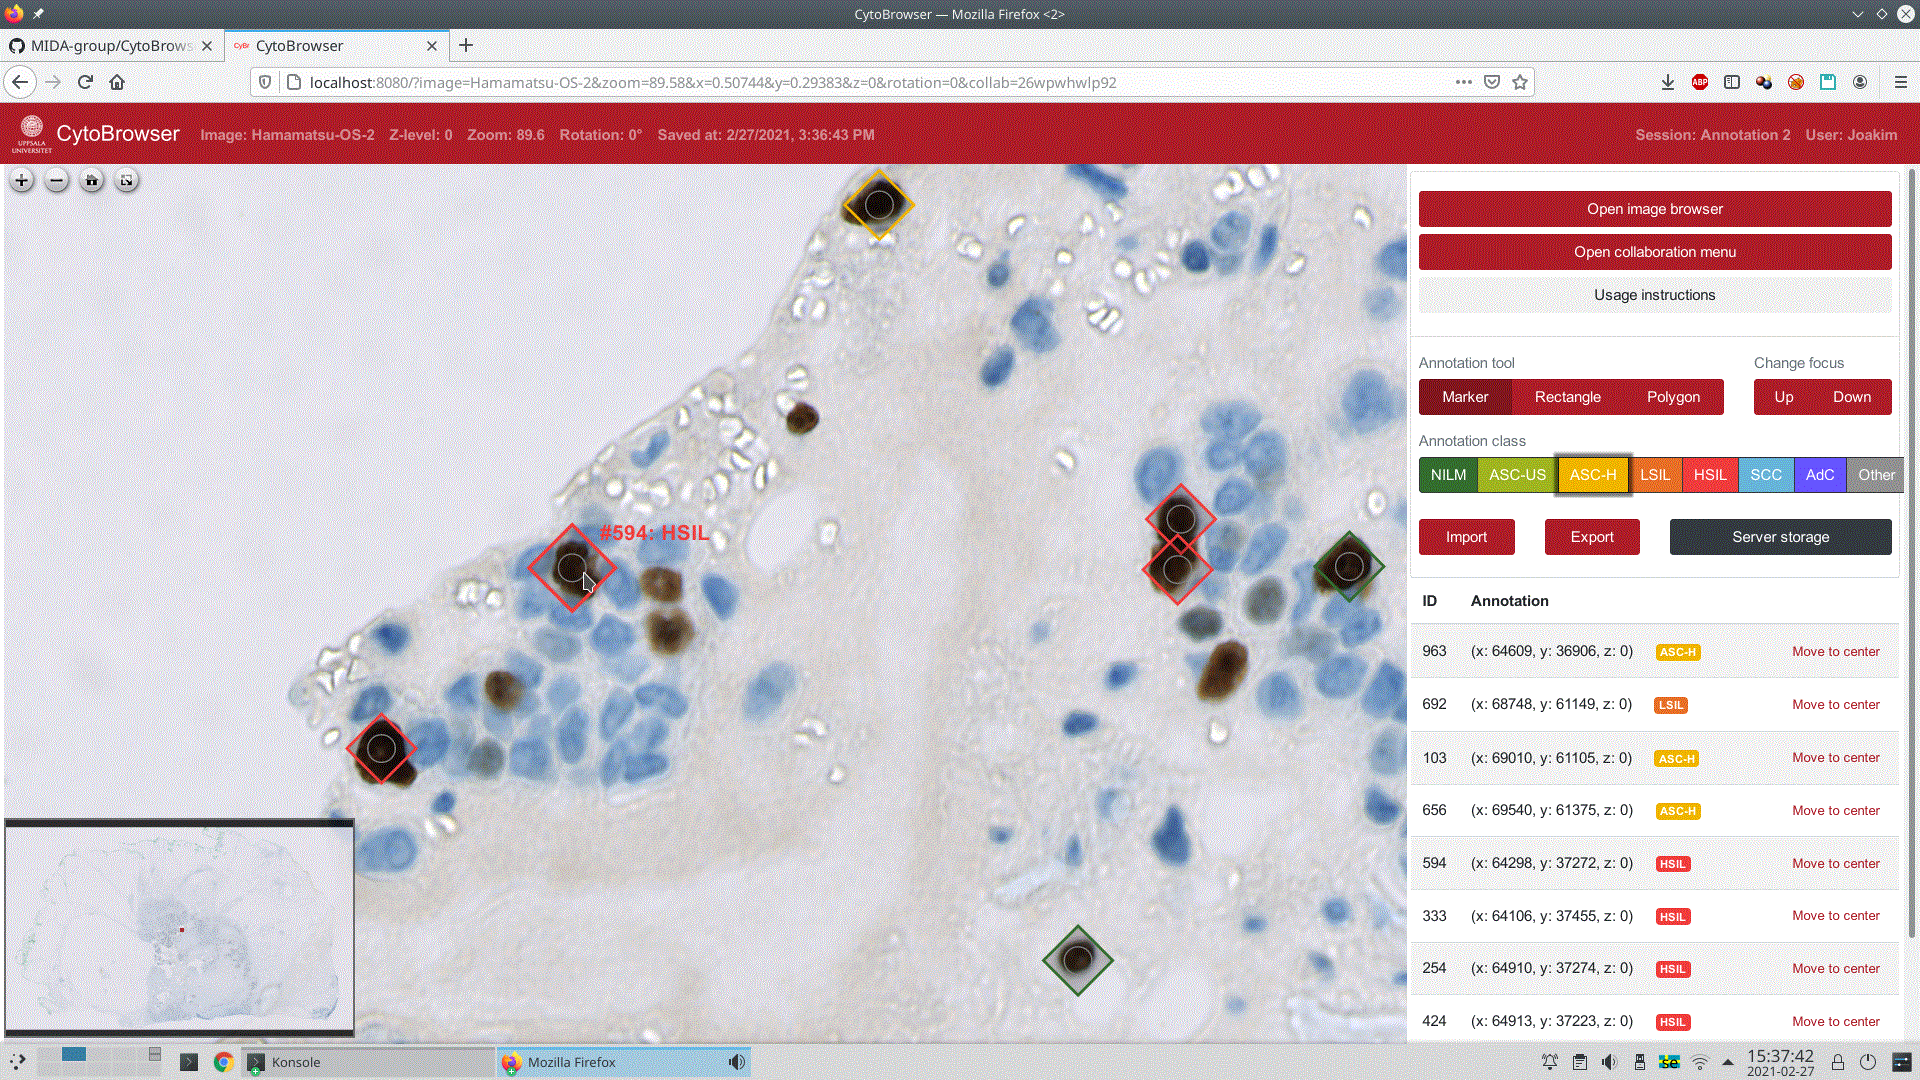
The user has just placed a marker on a cell nucleus, indicating the Bethesda grade HSIL (High-grade squamous intraepithelial lesion). An overview of the WSI is presented in the lower left part of the screen, with the current zoomed-in viewport indicated as a small red rectangle.
CytoBrowser is a fork and extension of TissUUmaps7 (GPLv3 license), which in turn builds on the OpenSeadragon14 (BSD-3-Clause license) web-based viewer for high-resolution zoomable images. Although TissUUmaps is a very capable tool for visualization of cytology WSIs, it is developed with tissue analysis in primary focus and the user interface and tools are not always ideal for cytological data. CytoBrowser instead puts cytological analysis in the main focus. An important feature for cytological data is efficient handling of z-stacks (currently not supported in TissUUmaps); CytoBrowser delivers fast browsing through focus levels by use of transparent layers. CytoBrowser also allows z-level differentiated annotations, useful, e.g., for annotating overlapping cells.
The development of CytoBrowser is aimed towards ease of use by cytotechnologists and cytopathologists on a global scale. Implemented tools for shared multi-user sessions facilitate efficient remote collaboration, including options for joint-view visualization and collaborative annotation and assessment of very large datasets. CytoBrowser delivers this through a web-browser interface which is functional on any modern computer or tablet, facilitating efficient utilization of distributed resources. A demonstration setup of CytoBrowser running on several devices (Microsoft Edge browser under Windows, Firefox browser under Linux, Chrome browser on Android tablet and phone) is shown in Figure 2. The multi-user design of CytoBrowser offers concurrent access to samples, where different experts may assess, comment on, or edit each others annotations, or where an educator may, e.g., show students different medically relevant examples.
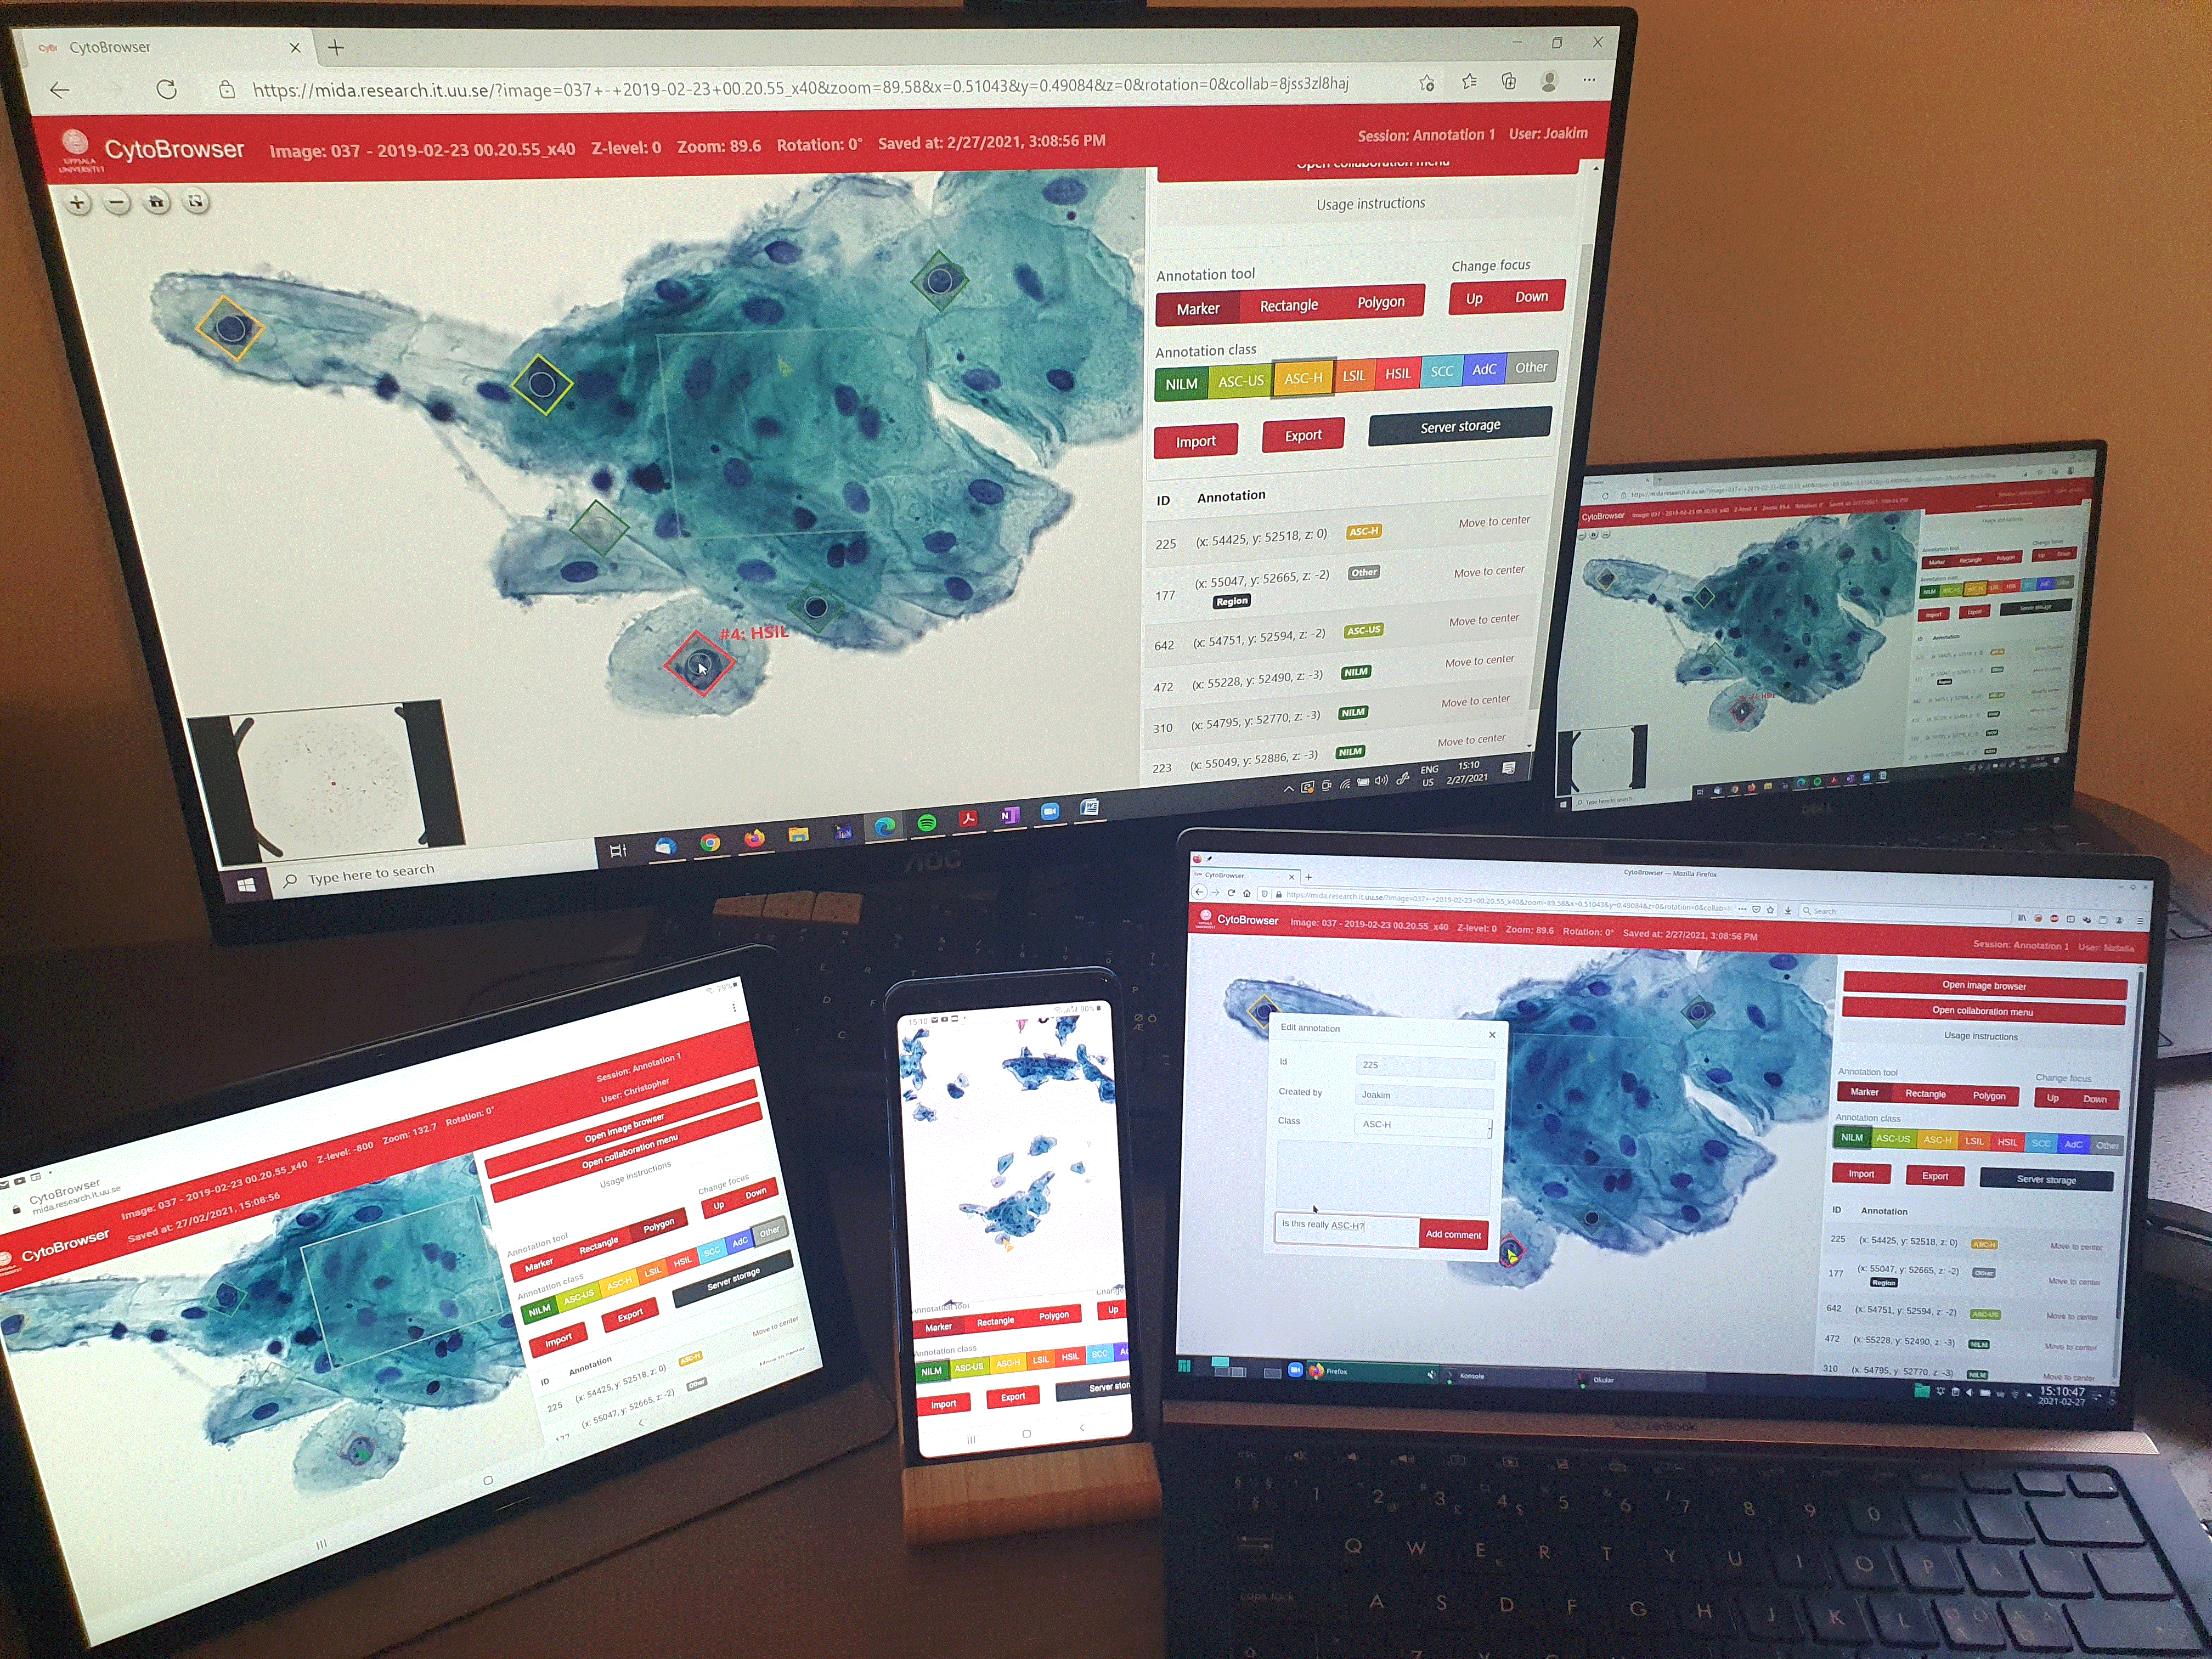
The tablet and the laptop in the foreground follow the view displayed on the larger monitor in the background, while the phone is showing a somewhat larger view. The user of the laptop in the foreground is adding a text comment to the upper left marker, while the (followed) user has just placed a HSIL marker on the nucleus in the lower part of the screen. CytoBrowser is compatible with all modern browsers.
The frontend of CytoBrowser is implemented in JavaScript. The implementation makes use of the Revealing Module15 design pattern to clearly separate different parts of functionality and to make it both easily maintainable and expandable. OpenSeadragon14 is used to display a viewport in the user interface and to dynamically load different parts of the image from the server as needed. The annotations that the user can place on an image belong to one of several annotation classes. By default these classes follow the Bethesda grading system16. Classes are defined in a separate file and can easily be modified to suit the specific task.
CytoBrowser utilizes the Deep Zoom Image (DZI) format for fast rendering of very large WSIs. Currently, each z-layer is provided as a separate DZI file, where a filename of the form imagename_zNNN.dzi indicates an image with name ’imagename’ at z-level ’NNN’, and where ’NNN’ is any number, typically an offset in nanometer.
The backend of CytoBrowser is run in Node.js17, with a web server implemented with the Express18 module. The server provides HTTP endpoints for getting information about the available images as well as for writing and reading annotation data in server-side storage. While these endpoints are mainly intended to be used by the CytoBrowser client, they could also be used to easily access this information from other applications. The server also provides a WebSocket endpoint for full-duplex communication between the client and server to facilitate the collaboration functionality. This communication is done using JSON messages. The only mandatory field in a such a message is the type field, which informs the recipient how to process any other fields that may be present.
When a user opens an image in CytoBrowser, they either select an existing set of annotations to work on or start a new set. Different sets of annotations for the same image may, e.g., originate from different experts or be imported from a machine learning-based classification. The annotation set also defines a collaboration session, consisting of all users currently working on the same annotation set, much like users collaborate on the same document in web-based applications such as Google Docs19. By encoding the current state of the interface, including the active image and annotation set, but also viewport location and zoom level, in the dynamically updated URL, it becomes very easy to invite colleagues to discuss a sample by simply sharing the active URL. In the same manner, it is easy to return to a previous image location through a stored browser bookmark.
The protocol implemented for collaborations has been created with robustness in mind. The backend stores a canonical copy of the shared data, including information about the participating users, the active image and the placed annotations, that the clients request when entering a collaboration. The backend also verifies that clients are displaying the correct image. When data is altered by a connected client, only the alteration is broadcast to other collaborators.
For additional details regarding the implementation, we refer the reader to the implementation.md file of the software.
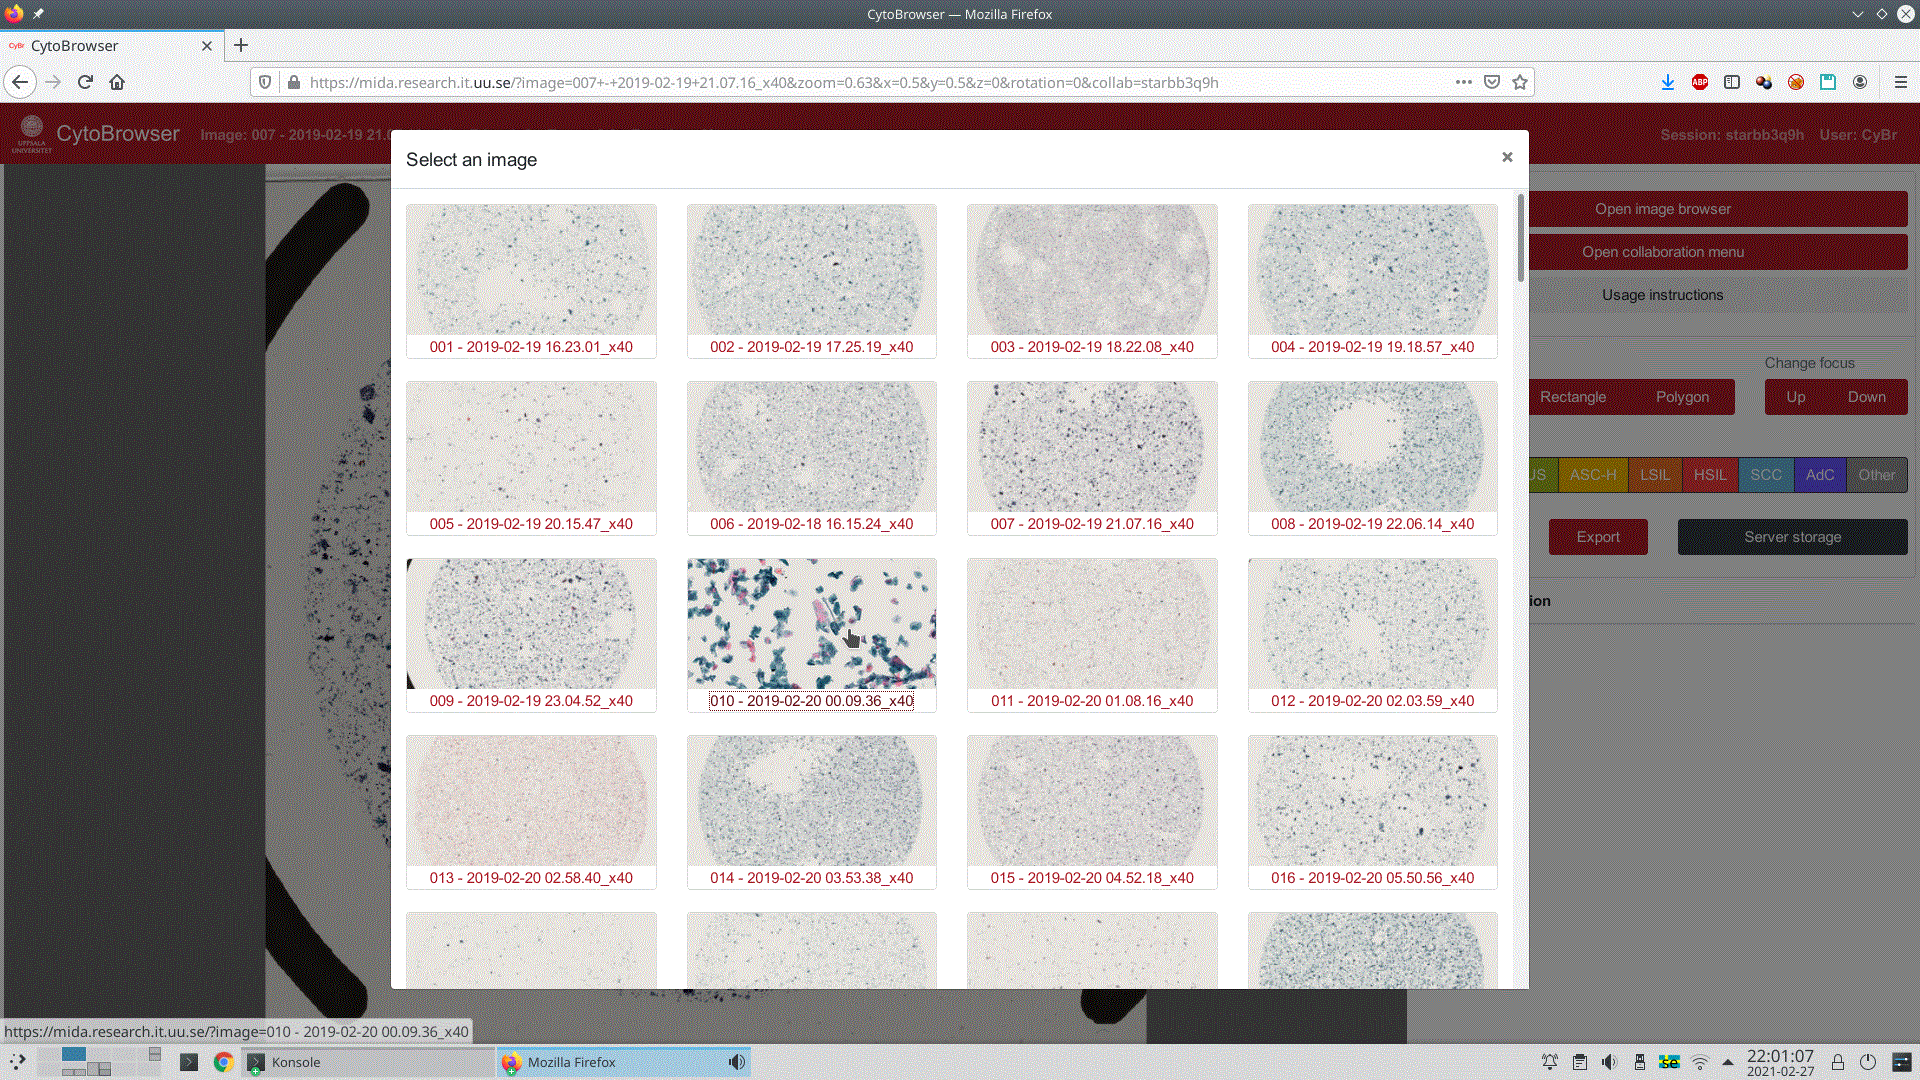
Opening images stored on the server is easy; available images are presented to the user as a gallery of thumbnails, see Figure 3 for an example. By default these thumbnails display a lower-resolution version of the full image, but by hovering over a specific entry the user is presented a zoomed-in view from the middle part of the image. After selecting an image, the user is prompted to either start a new annotation session or to continue on a previously created.
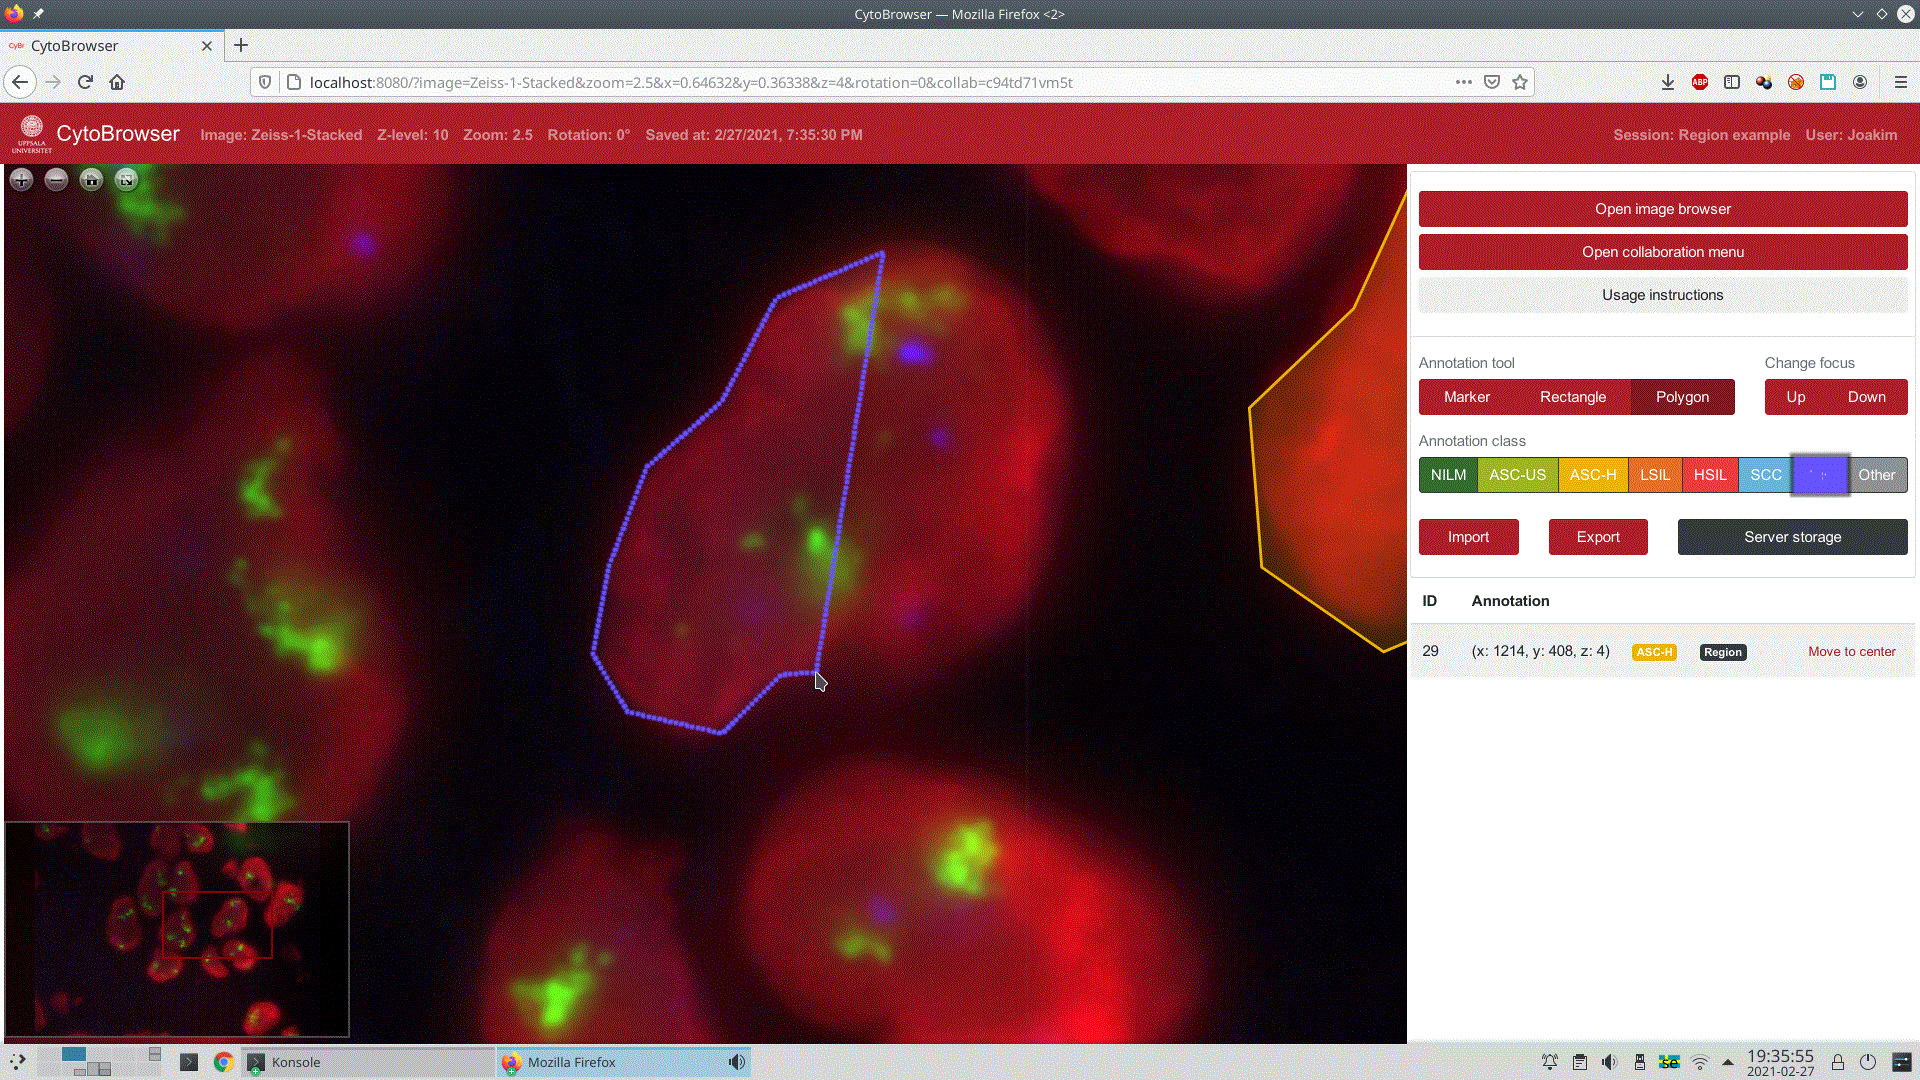
CytoBrowser enables placing several different kinds of annotations on an image. Markers can be placed by clicking a single point, rectangular regions can be placed by clicking two opposite corners, and polygonal regions can be placed by clicking each vertex, see Figure 4 for an example of the latter. While these three annotation tools are currently present in CytoBrowser, the system is designed to allow easy addition of new tools.
Once annotations are placed, there are different ways of interacting with them. They can be moved or deleted using the mouse. By right-clicking an annotation, the user gets access to more actions in a context menu. Here they can change the class assigned to the annotation or leave text comments on it to provide information that is not captured by the class label alone. In Figure 2, the user of the laptop in the foreground is adding such a comment.
Three different options for saving and loading annotation data are provided. The easiest option is for the user to rely on the autosave functionality of CytoBrowser, where the current annotation set is continuously stored on the hosting server. The second option is to manually store the data on the server. For this option, we also provide a simple versioning system. If a file is saved to a directory that contains a file with the same name, the user gets the option to either rewrite the latest version of the file or to create a new version of it. The user is then able to choose which version of a file to load when browsing the server files. The third option is to store the annotation set on the local machine of the user, using the “import” and “export” buttons in the interface. For all three options, the annotations are stored as JSON files, making the data easily transferable between different tools. This enables the annotations to be used for data selection or training of machine learning methods. Inversely, CytoBrowser may be used to visualize the classification or segmentation results generated by other tools.
We believe that easy collaboration between experts from different fields is important for an efficient workflow. For CytoBrowser, we have implemented functionality that enables such collaboration to be performed remotely, where two or more users can browse and annotate the same image together in a shared session. Any changes made by one user will be seen by the other users in real-time. Users can see each other’s mouse cursors in the viewport, and they have the option to lock their view to follow that of another user. This may be useful, e.g., in cases where an expert from one domain needs to visually explain something about the data to an expert in another domain. This capability may thus enhance the transfer of knowledge between different fields and simplify multidisciplinary research.
To download and install the software, follow the instructions at https://mida-group.github.io/CytoBrowser/. It is very easy to set up a local CytoBrowser server to be accessed from the same machine (localhost), or, e.g., through an SSH tunnel. For larger and more persistent use cases, we recommend to rely on one of popular open-source web servers, such as Apache and Nginx, as a secure loadbalancing frontend for the server.
Example Bash scripts, demonstrating how to download and convert publicly available images in Zeiss (.zvi) and Hamamatsu (.ndpi) format into the Deep Zoom Image (.dzi) format, suitable for CytoBrowser, are provided together with the software in the examples directory. Software packages which may be useful for converting WSIs include libvips, Bio-Formats, and NDPITools.
We present CytoBrowser, an OSS developed in response to the request for light-weight, open, flexible, and easy to use tools for collaborative visualization, annotation and assessment of whole slide image data. CytoBrowser is developed particularly with cytological analysis on mind, where efficient handling of z-stacks is a central requirement. The combi- nation of a JavaScript based browser component and a Node.js driven server-side component enables fast access to large image data together with easy and flexible storage and sharing of annotations. Being a tool particularly designed for collaborative interactive multi-user access, it facilitates knowledge exchange and alleviates interdisciplinary research.
In addition to being a much desired resource for the creation of large annotated datasets, crucial for training and evaluation of machine and deep learning-based approaches to bioimage analysis, as well as the visualization and qualitative evaluation of the results of such methods, we also envision that CytoBrowser may be a useful tool for distributed education, quality improvement, competency assessment, proficiency testing, and performance evaluation20.
By delivering a powerful virtual microscope environment which is easily accessed through a web-browser interface and functional on any modern computer or tablet, we hope that CytoBrowser, facilitating efficient utilization of distributed resources and expert knowledge, may contribute towards fair and universally accessible health-care.
Software available from: https://mida-group.github.io/CytoBrowser/
Source code available from: https://github.com/MIDA-group/CytoBrowser
Archived source code at time of publication: https://doi.org/10.5281/zenodo.458276021
License: GNU General Public License v3.0
| Views | Downloads | |
|---|---|---|
| F1000Research | - | - |
|
PubMed Central
Data from PMC are received and updated monthly.
|
- | - |
Provide sufficient details of any financial or non-financial competing interests to enable users to assess whether your comments might lead a reasonable person to question your impartiality. Consider the following examples, but note that this is not an exhaustive list:
Sign up for content alerts and receive a weekly or monthly email with all newly published articles
Already registered? Sign in
The email address should be the one you originally registered with F1000.
You registered with F1000 via Google, so we cannot reset your password.
To sign in, please click here.
If you still need help with your Google account password, please click here.
You registered with F1000 via Facebook, so we cannot reset your password.
To sign in, please click here.
If you still need help with your Facebook account password, please click here.
If your email address is registered with us, we will email you instructions to reset your password.
If you think you should have received this email but it has not arrived, please check your spam filters and/or contact for further assistance.
Comments on this article Comments (0)