Keywords
RApyDS, Restriction Site-Associated DNA Sequencing, RADseq, simulation, companion tool, experimental design
This article is included in the Bioinformatics gateway.
This article is included in the Cell & Molecular Biology gateway.
This article is included in the Python collection.
RApyDS, Restriction Site-Associated DNA Sequencing, RADseq, simulation, companion tool, experimental design
Next-generation sequencing (NGS) technologies provide an avenue to obtain a broader view of the genetic landscape of individual species, substantially impacting various applications such as molecular marker discovery (Shendure & Ji, 2008). However, not all approaches and studies require sequencing of complete genomes, which may be cost-prohibitive and more difficult to analyze (Etter et al., 2011; Meger et al., 2019). In dealing with whole-genome resequencing studies, reduced representation genomic libraries (RRLs) are alternatively used to randomly subsample the genome for the discovery of genetic markers and variations. Instead of resequencing at a lower depth of coverage to reduce the sequencing cost, RRLs can increase the effective coverage depth but only for certain regions of the genome. Amongst RRLs, Restriction Site-Associated DNA Sequencing (RADseq) has gained a lot of attention, as this approach utilizes the power of high-throughput sequencing to efficiently discover polymorphic markers on organisms even in the absence of a reference genome (Etter et al., 2011).
RADseq, which utilizes restriction enzymes to sample a subset of the genome that is flanked by restriction sites, is commonly used today for SNP discovery and genotyping (Davey et al., 2013). RADseq protocols may vary according to the number of restriction enzymes used and the frequency of cut sites across the length of the DNA. In its original formulation, RADseq relies on the fragments produced from the cut sites of a single restriction enzyme; whereas other protocols such as double-digest RADseq (ddRAD) produce fragments with known distances from the cut-sites of two different restriction enzymes (Andrews et al., 2016). Briefly, the process begins with the digestion of high-quality genomic DNA by the chosen restriction enzyme. Molecular identifiers and adapters are ligated to the sticky ends of the fragments. Samples are then pooled and randomly sheared. Another set of adapters are attached to the sheared fragments to ensure proper amplification. Finally, size selection is performed for sequence-ready fragments. Random shearing is eliminated in the ddRAD protocol as it uses another restriction enzyme for a second round of digestion instead (Davey & Blaxter, 2010).
Restriction enzymes are the key elements in RADseq. These are essential in determining the genomic regions to be sequenced, since the patterns of genetic variations to be observed will occur adjacent to the corresponding restriction sites (Andrews et al., 2016). The choice of which enzyme to use thus determines the number of markers that can be obtained and assayed, which in turn determines the amount of sequencing required, the number of samples, the cost, and ultimately the success of the project (Herrera et al., 2015). The lack of prior estimates on the number of restriction sites, fragments that can be produced, density of RAD loci that can be sequenced, or other projected effects of using one or a combination of restriction enzymes are some of the common impediments in successfully designing and performing reduced representation library preparations for whole-genome resequencing. It is therefore of utmost importance to have a prior idea on the distribution and frequency of cut-sites and fragments that will be produced by a given restriction enzyme.
To address the aforementioned impediments, we developed RApyDS (Restriction Site-Associated DNA from Python-implemented Digestion Simulation), a tool that aims to provide evaluation metrics to aid researchers in choosing the best set of restriction enzymes for a RADseq study. It is a Python-based tool that simulates digestion of a given reference genome in silico either by original RADseq or ddRAD protocols. The simulation tool generates estimates for the following: (i) the number of restriction sites, (ii) the number of fragments after digestion, (iii) the number of fragments after shearing and size selection (RAD loci), (iv) the number of RAD loci within repeat regions, (v) the cut-site distribution, and (vi) the projected RAD loci density across the genome. A gel electrophoresis view of the restriction fragments is also shown to simulate the common laboratory method used for initial evaluation of restriction digestion. When supplied with an annotation file for the reference genome, the tool will also provide the number of RAD loci observed within annotated regions. All of this information, taken together, will enable the user to better determine the top restriction enzyme candidates and RADseq experimental design to implement for a particular RADseq or resequencing study.
Figure 1 shows an overview of the implementation workflow of the RApyDS tool. Two distinct RADseq protocols are implemented in RApyDS for simulation: the original RADseq protocol (Baird et al., 2008), and the double-digest RADseq or ddRAD (Peterson et al., 2012). Global splitting was implemented to represent the digestion of DNA sequence based on the selected restriction enzymes; one RE for original RAD and two REs for ddRAD. In order to obtain simulation metrics based on the mapping of RAD loci to the reference genomic sequence, we used the alignment tool BWA (BWA, RRID:SCR_010910) (Li & Durbin, 2009). At present, the primary output of RApyDS is an interactive HTML file that can be viewed properly using the Mozilla Firefox browser.
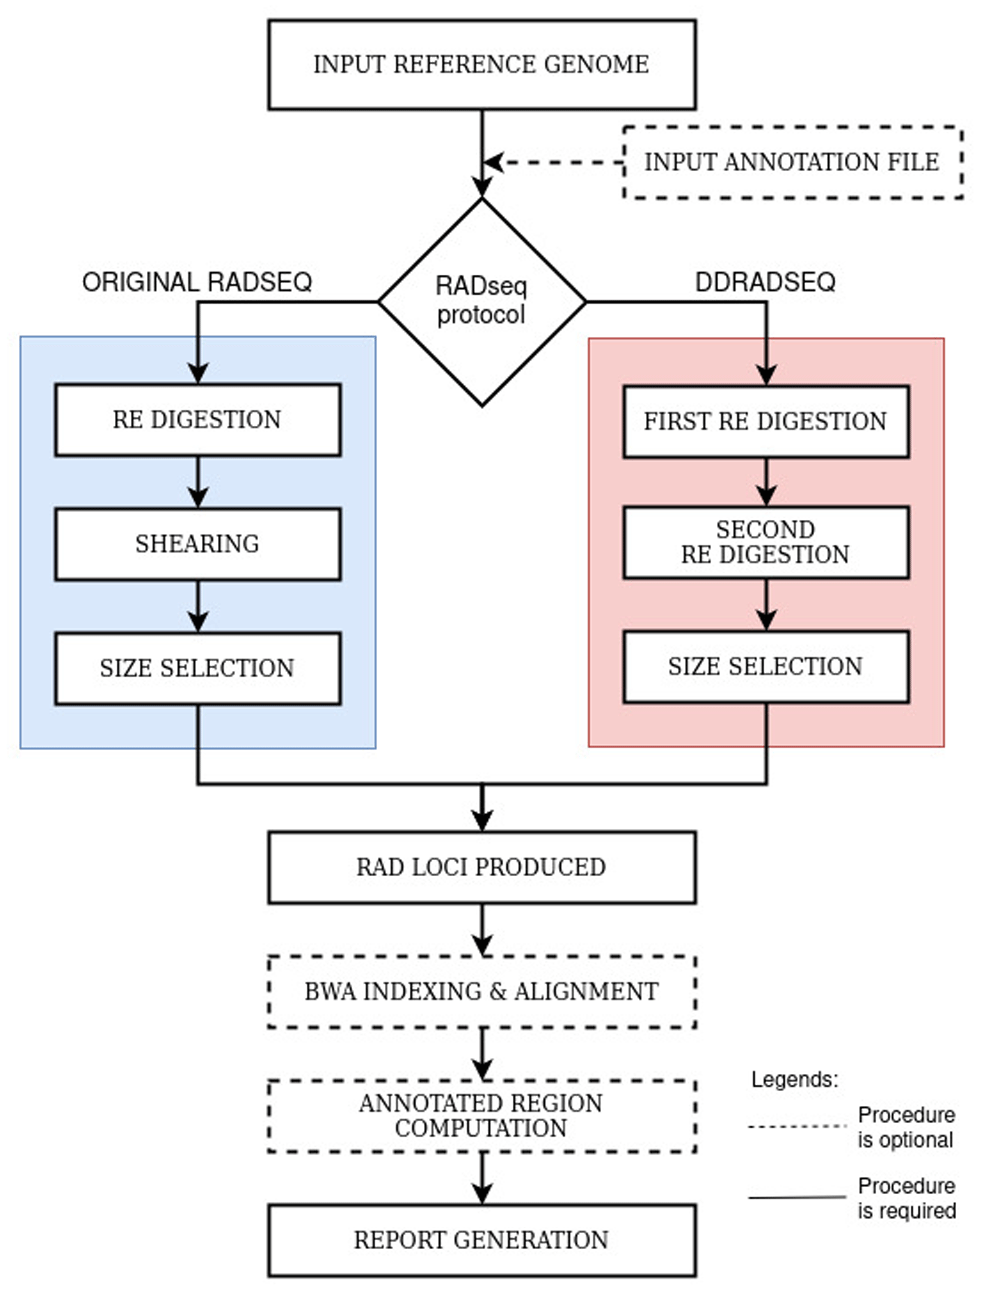
Original RADseq Simulation. In this protocol, we simulate the original RADseq workflow by initially segmenting the reference sequence based on the presence of restriction enzyme cut sites. The procedure therefore assumes a complete digestion of the intact genome. The resulting fragments are then further sheared and size-selected according to a user-defined insert size range. This process results into three fragment types: (1) those that are deemed too small after shearing and size selection, (2) those that are within the insert size range but do not contain a sticky end (remnant of the restriction cut site), and (3) those that are within the defined insert size range and contains both sticky and sheared ends. Type 1 fragments are filtered out by the program to simulate the size selection process in sequencing library preparation. Type 2 fragments, on the other hand, are also filtered out by the program because the sticky end resulting from the restriction enzyme activity is needed for the attachment of the P1 sequencing adapter. Thus, only fragments containing a restriction enzyme cut site in one of the ends and whose lengths are within the insert size range (Type 3) will be considered as putative RAD loci for downstream analysis.
Double-digest RADseq Simulation. For the ddRAD protocol, the process similarly begins with the segmentation of the genome based on the positions of the first restriction enzyme cut sites. However, instead of implementing a shearing step afterwards, a second round of digestion based on the cut sites of the second restriction enzyme is done. The resulting fragments after the two rounds of digestion are then size selected according to the user-defined insert size range. This procedure will generate the following fragment types: (1) those that are shorter than the minimum insert size, (2) those that are within the insert size range but contain sticky ends from only a single enzyme, and (3) those that are within the insert size range and contain sticky ends from both of the enzymes used. Again, to simulate size selection during library preparation, Type 1 fragments are filtered out in the process. Type 2 fragments will also be filtered out because the sticky ends from both enzymes are necessary for the proper attachment of the sequencing adaptor pairs. At the end of this step, only the Type 3 fragments will remain as putative RAD loci.
RApyDS software runs on a Linux OS computing machine with at least Python 3 installed and a minimum system requirement of 500 MB free memory (RAM) and a single CPU. Resource consumption will depend on the size of the input genome. Installation of the Python module dependencies can be done using pip. A complete guide on installation, usage, software requirements, and specifications can be accessed at https://github.com/pgcbioinfo/rapyds.
The program requires a genome or a DNA sequence in FASTA format as input. Whenever a corresponding annotation in GFF/GTF format is available, this can also be supplied together with the sequence to enable counting of RAD loci within target regions. In cases where a reference genome is not available, the tool can randomly generate a hypothetical reference sequence based on a user-defined GC content and sequence length using the algorithm implemented in SimRAD (Lepais & Weir, 2014). By default, the tool will evaluate a total of 56 commonly used restriction enzymes which recognition sequences were acquired from New England Biolabs Inc. . The users may also select any subset of these enzymes for evaluation and are given the option to add new restriction enzyme information if these are not yet included in the current list.
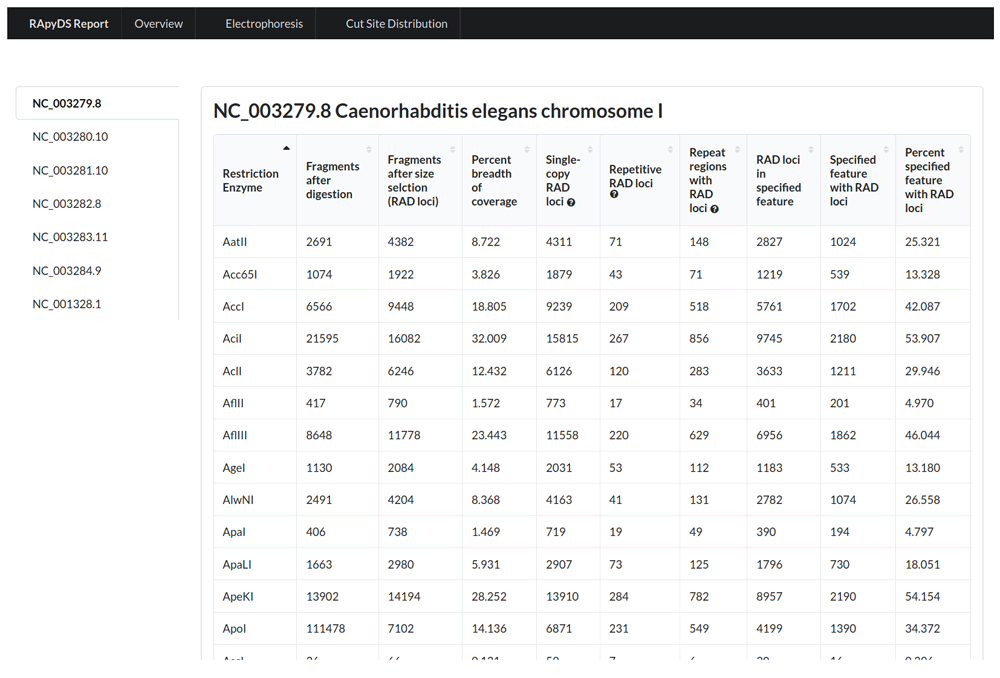
A successful RApyDS run will generate a compressed ZIP file as final output. This archived file contains simulation reports in hypertext markup language (HTML) format, all of which can be accessed interactively through the main file index.html. The landing page (Overview tab) shows a table containing various simulation metrics for each of the restriction enzymes tested (Figure 2). These metrics are described in more detail in Table 1. Briefly, the table contains information on the number of predicted RAD loci, the breadth of reference sequence covered by these loci, single-copy and repetitive loci, and loci within annotated regions if an annotation file has been supplied. To further facilitate assessment of the results, the table can be sorted in increasing or decreasing order based on the values from a particular column by clicking on the column header.
We note here that the number of single-copy and repetitive RAD loci is based on alignment results. In certain cases, the alignment step may take a substantial amount of time to complete. Thus, we included a parameter flag to skip the alignment step if the user prefers to speed up the simulation process at the expense of repeat information. Table 2 shows the average processing times for the following simulations: (i) with alignment and reference indexing, (ii) with alignment only wherein an indexed reference is supplied, and (iii) without alignment. A reduction in processing time of around two to five times can be obtained when running RApyDS using the latter options.
| Species | FASTA file size (MB) | Average Processing Time (sec) | ||
|---|---|---|---|---|
| With Alignment and Reference Indexing | With Alignment Only | Without Alignment | ||
| Eescherichia colia | 4.50 | 16.89 | 14.56 | 6.41 |
| Caenorhabditis elegansa | 97.00 | 656.18 | 530.86 | 132.85 |
| Brassica napusb | 943.00 | 2093.52 | 722.63 | 356.56 |
| Aedes aegyptib | 1200.00 | 4092.68 | 1684.06 | 584.77 |
| Zea maysb | 2000.00 | 8291.83 | 4311.70 | 899.99 |
| Callithrix jacchusb | 2700.00 | 8063.47 | 2165.91 | 1288.30 |
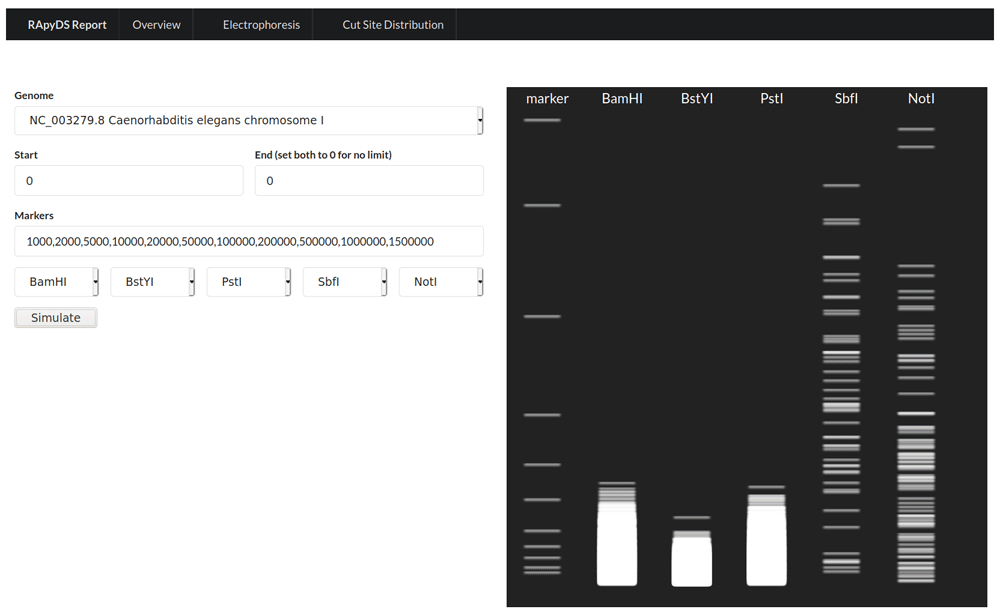
In addition to the overview metrics, graphical views of the results in various forms are also made available to the users. The first is a virtual gel electrophoresis output based on the obtained fragments after digestion simulations (Figure 3). For this visualization, the user can specify the sizes of the DNA ladder rungs to display (Lane 1), and can also choose up to five enzymes for which the simulated banding patterns will be shown (Lanes 2 to 6). This particular view can be helpful to researchers who are more adept at assessing the utility of restriction enzymes based on gel electrophoresis profiles.
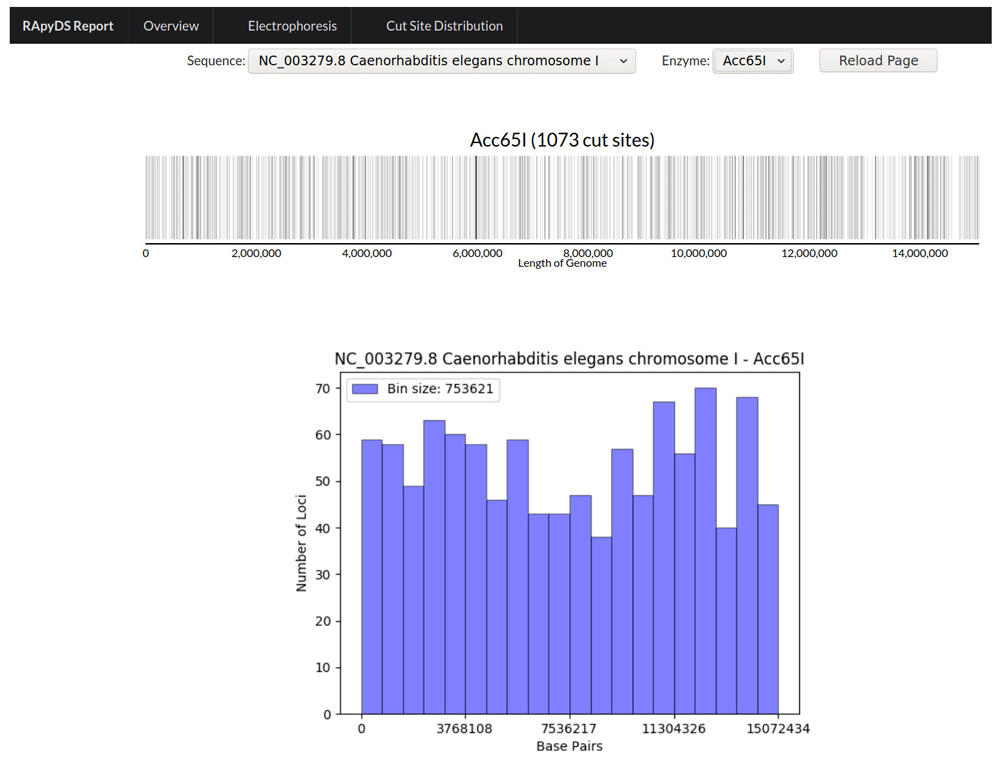
To give the users information on the distribution and density of the enzyme cut sites across the entire length of the reference sequence, the tool also outputs a view of the cut site distribution for each of the enzymes included in the simulation (Figure 4). This view can be magnified to focus on specific regions with greater resolution. A histogram of the enzyme cut site density per binned region is also generated.
In general, the users can do RAD simulations for a given target fragment size range to be generated from one or more REs available in the tool’s database. Alternatively, if a particular RE is not included in the database, information on this RE can be manually added and subsequently used. It is also recommended for the users to have a prior idea of an appropriate reference genome to be used in estimating the distribution of target features across the entire genome length. For instance, in capturing polymorphic sites, the number of RAD loci may drastically change when using common cutter enzymes exclusively or in combination with rare cutter enzymes.
Certain resequencing studies also involve calling variants using whole genome data sets sequenced at low coverage depth in an attempt to reduce the overall sequencing cost. However, a RADseq approach can result in a similar cost reduction (O’Rourke et al., 2011) without sacrificing coverage depth and variant loci density if an appropriate set of restriction enzymes is used. Specifically, enzymes that can generate a relatively even fragment length distribution across the entire genome are generally desirable (Roszik et al., 2017). Thus, RApyDS can be utilized to evaluate which restriction enzyme or restriction enzyme pair can generate the desired RAD loci density and distribution given a range of insert sizes and within certain genomic features (e.g., genes, exons) if an annotation file is supplied. By default, the tool will also output the number of single- and multi-copy RAD loci based on mapping information, which can also be a consideration in deciding which particular restriction enzyme to use.
To demonstrate the use of RapyDS, an original RAD simulation was implemented on the C. elegans reference genome using all the REs present in the tool’s database. Figure 2 shows a portion of the results arranged alphabetically based on RE names. We can infer from these results that using AciI on C. elegans chromosome I produced the highest number of RAD loci (16,082), covering 32% of the reference sequence length with the default size selection range of 200-300 bp. Based on alignment results, AciI enzyme is predicted to yield mostly single-copy RAD loci (15,815), with only 1.66% (267) repetitive RAD loci detected and 5.32% (856) occurring at repeat regions. The number of sequenced repetitive RAD loci and/or RAD loci repeat regions can pose issues in downstream analysis that are heavily dependent on mapping and alignment approaches.
There are certain biological factors not accounted for in the current implementation of RApyDS that may affect actual RADSeq experiments. For instance, certain restriction enzymes can be sensitive to the methylation state of a particular nucleotide (Mülhardt & Beese, 2007), which is usually not reflected in the reference sequence. Single nucleotide polymorphisms in the enzyme recognition sites can also result in allele drop-outs that can further lead to a systematic underestimation of the overall diversity in population studies, particularly for organisms with relatively high mutation rates (Andrews et al., 2016). We will try to further incorporate some of these biological considerations in future releases of RApyDS in order to obtain simulation metrics that can more closely reflect the results from real experimental data sets.
NCBI Assembly: AaegL5.0. RefSeq assembly accession: GCF_002204515.2.
NCBI Assembly: ASM584v2. RefSeq assembly accession: GCF_000005845.2
NCBI Assembly: B73 RefGen_v4. RefSeq assembly accession: GCF_000005005.2.
NCBI Assembly: Bra_napus_v2.0. RefSeq assembly accession: GCF_000686985.2.
NCBI Assembly: Callithrix jacchus-3.2. RefSeq assembly accession: GCF_000004665.1.
NCBI Assembly: WBcel235. RefSeq assembly accession: GCF_000002985.6.
Source code available from: https://github.com/pgcbioinfo/rapyds.
License: GNU General Public License v3 (GPLv3).
| Views | Downloads | |
|---|---|---|
| F1000Research | - | - |
|
PubMed Central
Data from PMC are received and updated monthly.
|
- | - |
Provide sufficient details of any financial or non-financial competing interests to enable users to assess whether your comments might lead a reasonable person to question your impartiality. Consider the following examples, but note that this is not an exhaustive list:
Sign up for content alerts and receive a weekly or monthly email with all newly published articles
Already registered? Sign in
The email address should be the one you originally registered with F1000.
You registered with F1000 via Google, so we cannot reset your password.
To sign in, please click here.
If you still need help with your Google account password, please click here.
You registered with F1000 via Facebook, so we cannot reset your password.
To sign in, please click here.
If you still need help with your Facebook account password, please click here.
If your email address is registered with us, we will email you instructions to reset your password.
If you think you should have received this email but it has not arrived, please check your spam filters and/or contact for further assistance.
Comments on this article Comments (0)