Keywords
mutation, plink, allele, genetics, VCF
This article is included in the RPackage gateway.
This article is included in the Cell & Molecular Biology gateway.
mutation, plink, allele, genetics, VCF
Genome-wide association studies (GWAS) have led to the identification of several genomic common variants associated with complex diseases,1 yet missing heritability remains extensive. Furthermore, most of the disease-causing variants are rare in nature2 where common variants serve as a proxy. Rapid decline in sequencing costs have enabled in-depth analysis of rare variants (RVs; minor allele frequency < 1%) through Whole-Genome sequencing (WGS) and Whole-Exome Sequencing (WES). Furthermore, large-scale reference panels have allowed for imputation of RVs.3-5 Power to identify statistically significant RVs decreases as the minor allele frequency decreases: therefore, an ideal method to overcome this limitation is to group RV at the gene/region level, usually via a collapsing test.
Despite the availability of sophisticated tools for annotation, quality-control and association analyses, tools to perform basic tasks, for instance, obtaining allelic count within defined genetic boundaries (genes and/or regions) are lacking, to our knowledge. R libraries such as BEDMatrix and bigsnpr6 provide allelic counts for each SNP per individual but algorithms to extract information within genetic boundaries in a collapsed fashion are unavailable.
Here we introduce a user-friendly R package, GARCOM (“Genetic And Regional Count of Mutations”) that provides allelic counts per individual within user-provided genetics/regional boundaries.
GARCOM is written and developed in open-source R7 statistical and programming language. GARCOM imports data.table,8 vcfR,9 bigstatr, bigsnpr and stats libraries for internal data transformation and processing. A stable version is released and publicly available on the CRAN repository.
install.packages(“garcom”)
GARCOM was developed on R (≥4.0) (RRID:SCR_017299) with other dependencies and minimum versions as: data.table (≥1.12.8), vcfR (≥1.12.0), bigsnpr (≥1.4.11). Full documentation of dependencies and installation is available at GARCOM github repository. There is no minimum memory (RAM) requirement as far as we know, but that may vary according to the nature and size of input genetics data. GARCOM was developed on Unix platform but can also be used on other platforms (e.g. Windows, Ubuntu).
GARCOM operates through two main functions: “gene_pos_counts” accepts PLINK10 (RRID:SCR_001757) input data, whereas “vcf_counts_SNP_genecoords” accepts VCF11 input format. After reading in the data, these functions perform operations to count variants within genes/genomic regions for each individuals.
output <- gene_pos_counts(recoded_genetic_data, gene_boundaries, snp_locations)
output <- vcf_counts_SNP_genecoords(recoded_genetic_data, gene_boundaries, snp_locations)
where, “output” is the object generated by our library after a successful run of function; “recoded_genetic_data” is the main input file in PLINK or VCF formats; “gene_boundaries”, and “snp_locations” are additional input files for gene and SNP information, respectively.
Typical workflow is shown in Figure 1. In brief, the “gene_pos_counts” function will process genetic input data (“recoded_genetic_data”) generated from the PLINK software through the --recode A option. Data are read in standard matrix format using the data.table R library. For VCF files, the “vcf_counts_SNP_genecoords” function reads the VCF input file employing the extract.gt function from the vcfR library. The genotype values are read within the “GT” field.
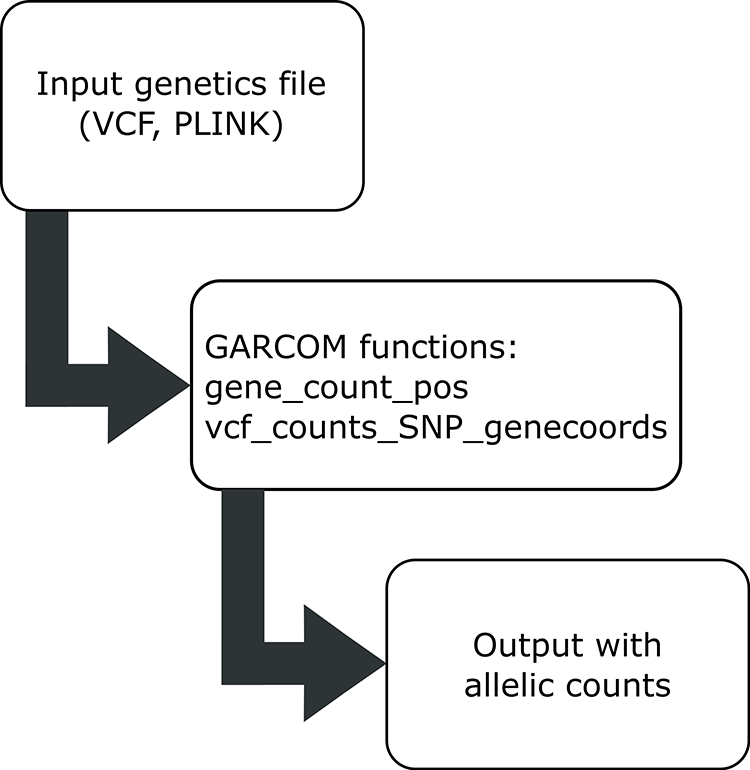
GARCOM provides functions to read output from PLINK, VCF format. The final output is a matrix with rows as gene names and columns containing individuals’ IDs.
In addition to the --recode A genetic input, GARCOM needs genetic boundaries information and SNP information as shown in Table 2 and Table 3, respectively.
Output produced by GARCOM is a matrix, with M rows and N columns, where M represents the genes/genomic regions with at least one allele count and N represents the individuals. Genes with zero allelic counts across all individuals are excluded from the final output. Missing values are counted as zero in final output. When no allelic counts are present in the user-defined genes, NULL value is returned. GARCOM allows missing values (NA) in input data.
In addition to the function described, GARCOM provides several options for user flexibility. For instance, GARCOM can be ran restricting analyses to 1) a list of genes, or 2) filter SNPs and extract individuals of interest. For instance, users can provide list of individuals using the “keep_indiv” parameter; similarly, genes can be filtered in by using the “filter_gene” parameter.
output <- gene_pos_counts(recoded_genetic_data, gene_boundaries, snp_locations, keep_indiv=mylist.txt)
output <- gene_pos_counts(recoded_genetic_data, gene_boundaries, snp_locations, filter_gene=mysetofgenes.txt)
The input PLINK file has a matrix structure of N rows with M columns, where N rows represent individuals (one for each ID). The first six columns are family ID, individual ID, paternal ID, maternal ID, sex, and phenotype (standard output from PLINK (Table 1)). Following columns consist of the variants included in the analyses.
| FID | IID | PAT | MAT | SEX | PHENOTYPE | SNP1_A | SNP2_T | SNP3_G | SNP4_C | SNP5_C |
|---|---|---|---|---|---|---|---|---|---|---|
| FID1 | IID_sample1 | 0 | 0 | 1 | NA | 1 | 1 | 0 | NA | NA |
| FID2 | IID_sample2 | 0 | 0 | 1 | NA | 0 | 1 | 0 | NA | 0 |
| FID3 | IID_sample3 | 0 | 0 | 1 | 1 | 0 | 0 | 1 | 0 | 0 |
| FID4 | IID_sample4 | 0 | 0 | 1 | 1 | 0 | 0 | 1 | 0 | 0 |
| FID5 | IID_sample5 | 0 | 0 | 1 | 1 | 0 | 0 | 1 | 0 | 0 |
Data must contain GENE, START and END column names.
| GENE | START | END |
|---|---|---|
| GENE1 | 100 | 180 |
| GENE2 | 200 | 400 |
| SNP | BP |
|---|---|
| SNP1 | 100 |
| SNP2 | 101 |
| SNP3 | 201 |
Individual_ID1, Individual_ID2 and Individual_ID3 are sample individual IDs, where values represent allelic counts within gene for individual.
| GENE | Individual_ID1 | Individual_ID2 | Individual_ID3 |
|---|---|---|---|
| GENE1 | 10 | 2 | 1 |
| GENE2 | 2 | 1 | 0 |
The input VCF file follows the standard VCF formats (please refer to the vcfR library documentation).
Toy data (gene and SNP coordinates) are shared within the package as “genecoord” and “snppos”, respectively.
We performed simulation on real data for CHR1 (# of variants = 23,456) and CHR22 (# of variants = 4,814) on randomly sampled individuals (N = 100, 200, 500, 1000, 5000, 10,000) extracted from whole-exome sequencing dataset as described in the study by Tosto et al.12 Genetics data were recoded using PLINK --recode A flag. On both chromosomes we found increased memory consumption and time (Figure 2) as we increased the number of individuals processed. Memory consumption for CHR22 was significantly lower than CHR1 due to a smaller number of variants and genomic boundaries. Simulations were performed with 16GB memory (RAM) requested on computing cluster node.
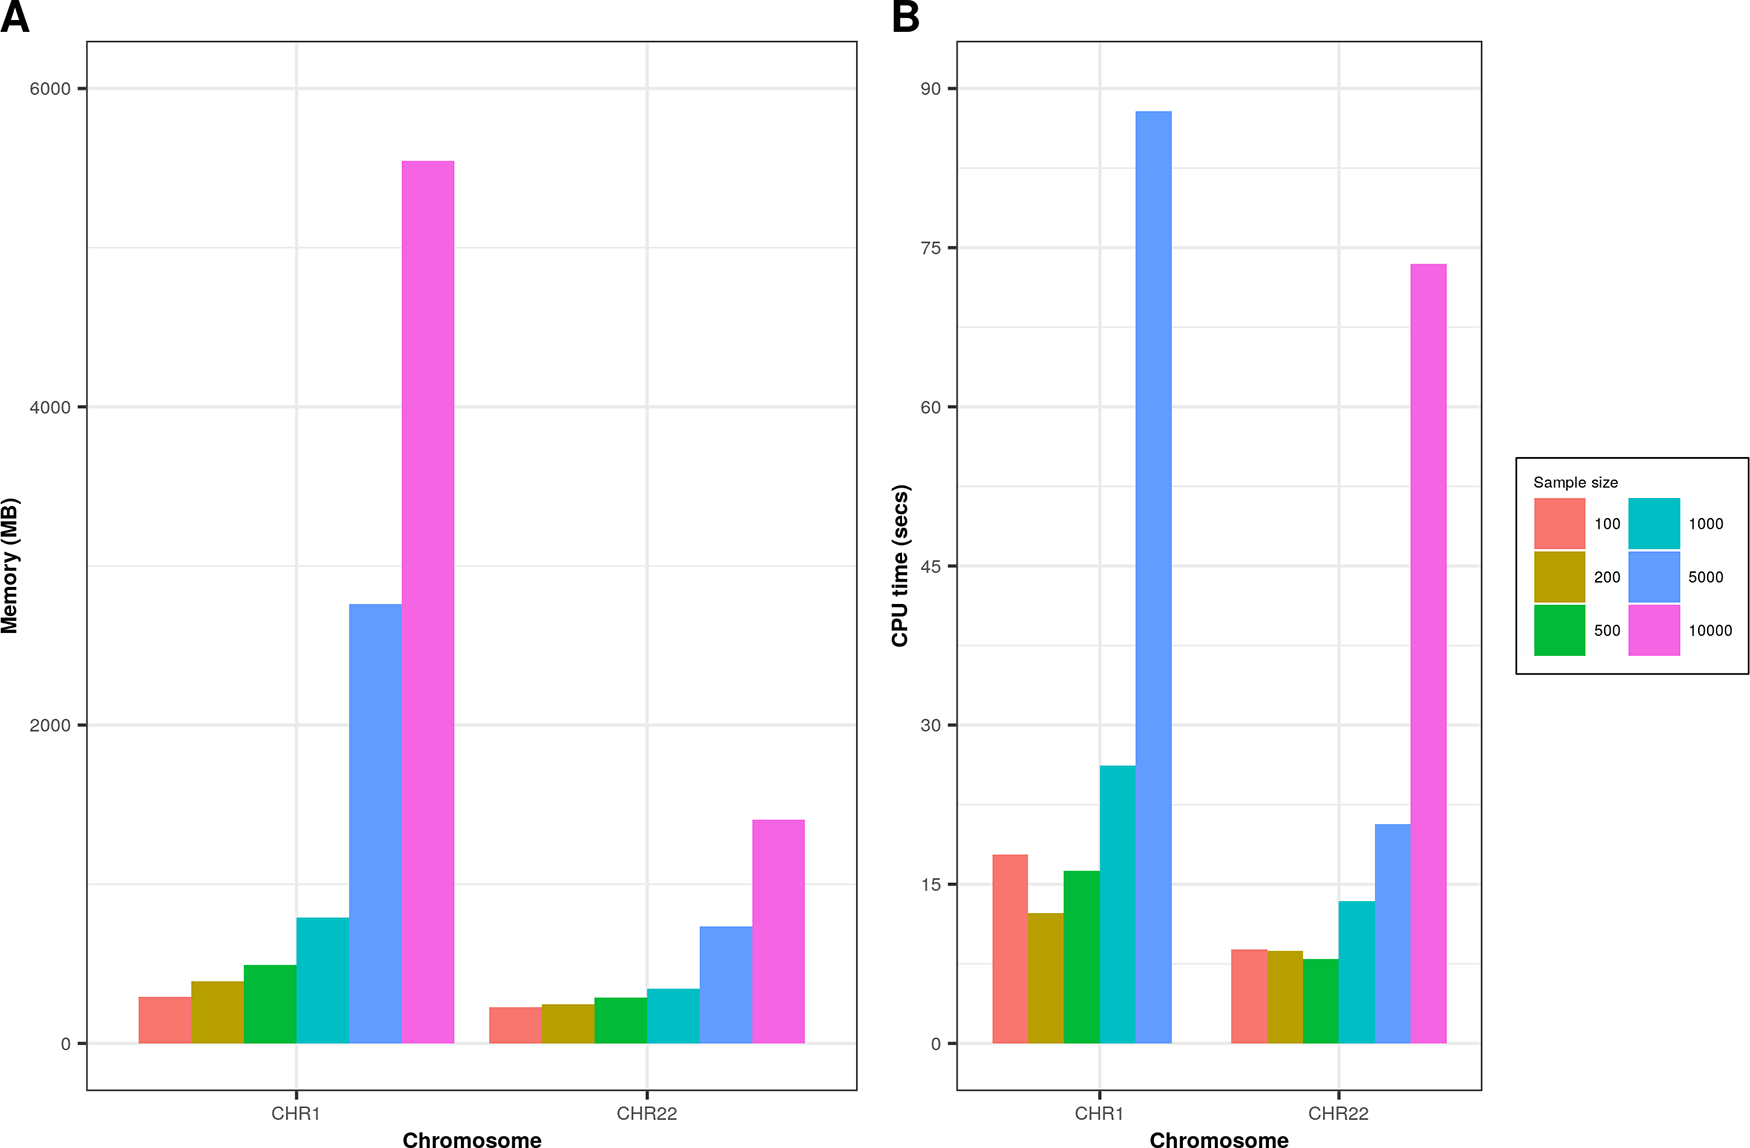
Graph A represents memory consumption; graph B shows processing time in seconds for various sample sizes on CHR1 and CHR22.
All simulations were conducted on R (v4.0), data.table (v1.13.6) with default 16 threads, GARCOM (v1.40), bigsnpr (v1.6.1).
GARCOM is easy to use where basic knowledge of R programming language is helpful but not desired. GARCOM is designed by harnessing existing libraries, such as data.table, that allow for efficient handling of large data. GARCOM data processing is independent of the reference genome build. GARCOM can be used on several platforms (e.g., Unix, Windows). GARCOM comes with certain limitations: genomic boundaries and variants' location need to be specified, as mentioned in the package documentation. In case of large-sized studies, for example UK biobank (N ≥ 200K), processing data per chromosome is highly recommended due to memory limitations. Lastly, GARCOM depends on public and freely available R packages.
VCF format can accommodate locus annotation performed by software such as ANNOVAR.13 To this end, GARCOM plans to accommodate annotation filters in addition to the existing ones. One challenge associated with annotated VCF is the resulting large file size; we will try to add this functionality, keeping RAM limitations and processing time in mind. We plan to add features to handle bgen format which stores large amount of genetics data, with appropriate R library (http://www.well.ox.ac.uk/~gav/resources/rbgen_v1.1.5.tgz).
Sample data associated with the package where applicable are provided within the library with proper documentation. No additional source data are required. We distribute the package under the MIT license. GARCOM can be downloaded from CRAN and GitHub from https://cran.r-project.org/web/packages/GARCOM/index.html and https://github.com/sariya/GARCOM respectively.
Reporting guidelines: Bugs and suggestions are welcome at the GitHub repository.
Author Contribution: SS, GT
Ethical Statement: Informed consent was obtained from all participants. For the whole-exome sequencing, the study protocol was approved by the Institutional Review Board (IRB) of Columbia university Medical Center (CUMC) (Approval number: AAAP0477). The study was conducted according to the principles expressed in the Declaration of Helsinki.
| Views | Downloads | |
|---|---|---|
| F1000Research | - | - |
|
PubMed Central
Data from PMC are received and updated monthly.
|
- | - |
Provide sufficient details of any financial or non-financial competing interests to enable users to assess whether your comments might lead a reasonable person to question your impartiality. Consider the following examples, but note that this is not an exhaustive list:
Sign up for content alerts and receive a weekly or monthly email with all newly published articles
Already registered? Sign in
The email address should be the one you originally registered with F1000.
You registered with F1000 via Google, so we cannot reset your password.
To sign in, please click here.
If you still need help with your Google account password, please click here.
You registered with F1000 via Facebook, so we cannot reset your password.
To sign in, please click here.
If you still need help with your Facebook account password, please click here.
If your email address is registered with us, we will email you instructions to reset your password.
If you think you should have received this email but it has not arrived, please check your spam filters and/or contact for further assistance.
Comments on this article Comments (0)