Keywords
machine learning, multi-omics, data integration, data harmonisation, multivariate analysis
This article is included in the RPackage gateway.
This article is included in the Bioinformatics gateway.
This article is included in the Artificial Intelligence and Machine Learning gateway.
machine learning, multi-omics, data integration, data harmonisation, multivariate analysis
A biological phenotype is an emergent property of a complex network of biological interactions. Since relying on a single layer of omics data to test a biological hypothesis results in an incomplete perspective of a biological system, interest in multi-omics data integration is steadily increasing as a means to decipher complex biological phenotypes.1
We illustrate these points with a hypothetical case of measuring protein and transcript levels in a same set of matched samples. Each of these omics data layers contain independent information. A correlation score is then obtained between expression levels of the two blocks of omics data, resulting in an interpretable association measure. While correlation scores are a primitive metric, especially in this context of protein and transcript,2 they represent an additional layer of data summarising valuable relationships. Identifying highly correlated features across independent blocks of omics data could potentially reinforce the validity of the result, while highlighting interesting features (strong positive or negative correlations) for further investigation [Figure 1]. Hence, exploiting such parallel measurements from a multi-omics perspective allows a more comprehensive and cohesive view of such complex and often dynamic systems, and this resolution would be expected to improve as more omics layers are added. Published multi-omics studies discovering novel biological insights which are not possible with single-omics data further supports our points.3-9 With the increasing volume of multi-omics data present in publicly accessible biological data repositories,10-12 multi-omics data integration is expected to be the core strategy of modern and future biological data analyses.
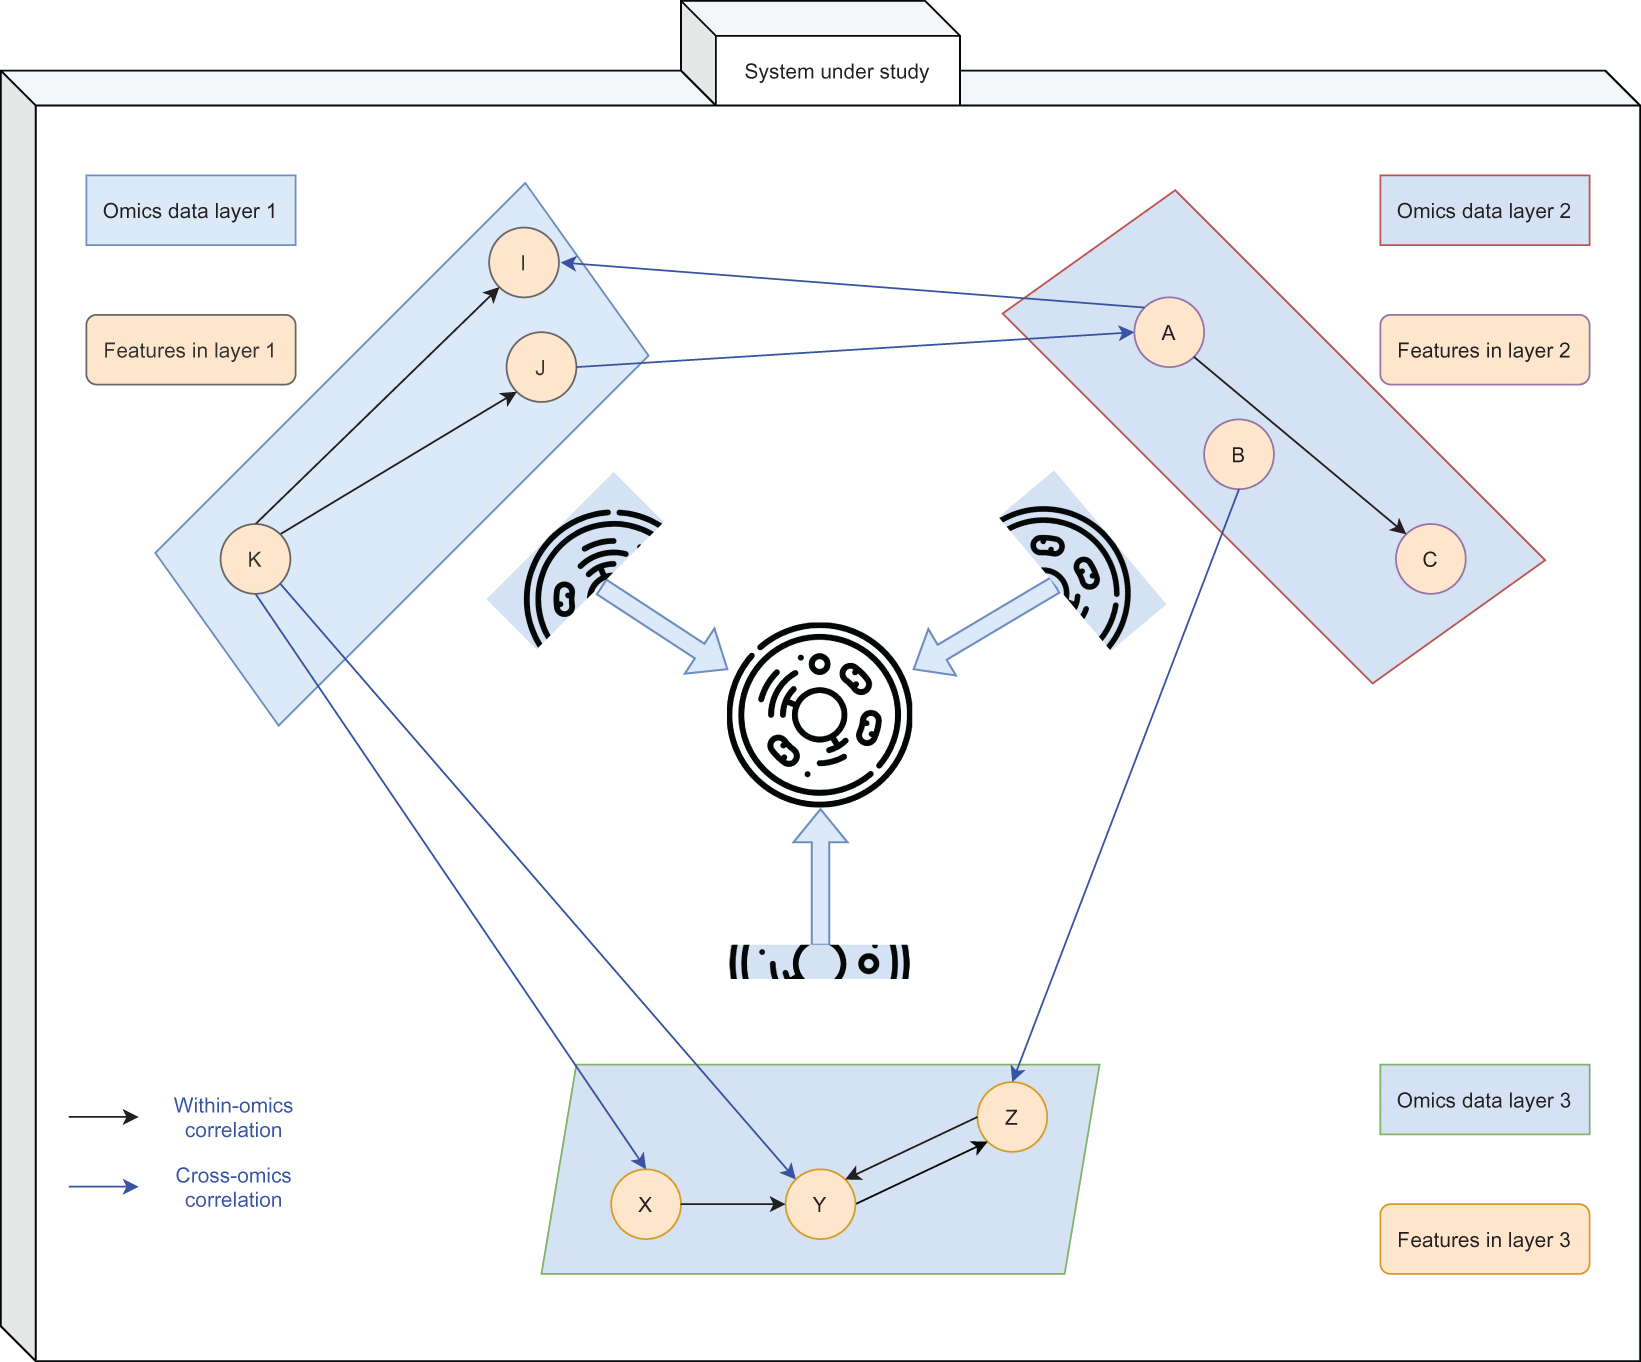
The rectangles represent different layers of omics data (e.g. proteome, transcriptome and lipidome) while the circles represent features within their respective omics data layer. Black single-line arrows show correlation between features within the omics data (e.g. a regulatory factor) while blue double-lines show correlation between features across different omics data layers. A powerful abstraction of the system under study can be obtained by reviewing multiple layers of omics data holistically.
As a result, methods have been developed to leverage the multitude of data modalities in characterising biological systems. While many tools are available, most of these methods are heavily customised to fit a specific experimental design, and are not generic enough to handle most use cases.1 Furthermore, many tools that claim to perform data integration actually perform high-level data aggregation, where datasets are processed individually and only summarised, high level information is analysed together.1 Of these algorithms, few perform data integration of multiple layers of omics data simultaneously, which we refer to specifically as “data harmonisation” to distinguish it from the more general term of “data integration”.1
While some “data harmonisation” algorithms exist, it is important to note that at this time, no end-to-end pipeline or framework exists which allows the user to quickly and easily input unrefined data, run a pipeline and export output data which can be used for downstream analyses and further downstream analyses. Therefore, to facilitate this, we developed multiomics, a flexible, easy-to-install and easy-to-use pipeline.
We present a pipeline targeted at bioinformaticians called multiomics13 with some important features, implementing one of the state of the art tools in data harmonisation from the mixOmics R package.14 It is portable with multiple implementations, and can be installed as an R15 package or used by cloning the associated git repository.16 A series of diagnostic plots are generated automatically and compiled into a pdf file. There is seamless integration with mixOmics, where data generated by the pipeline is exported automatically as a R data object of mixOmics classes. As a form of checkpointing, the R data object is updated at every major stage of the pipeline, and can be loaded directly into the mixOmics suite of tools for further investigation or plot customisation. To increase reproducibility, command line arguments are also exported as a script file which can be rerun directly to reproduce the output. To improve usability, the option to provide command line arguments as a json file is also available.
Detailed documentation is provided both within the source git repository and as vignettes in the R package. Multiple installation methods are shown in the git repository to maximise accessibility of our pipeline for users. Additionally, walkthroughs of two case studies are included. Complete and detailed examples of input data format are also provided, including a sample dataset which can be loaded directly from the R package. In this manuscript, we summarise these information and show a minimum working example to highlight some of the features of our pipeline.
Quick install
You can install this directly as a R package from gitlab:
install.packages("devtools")
library("devtools")
install_gitlab("tyagilab/sars-cov-2", subdir="multiomics")Docker17 and Singularity18,19 images are also available if the user prefers to use containers directly. Note that you typically need root access to run Docker, if this is not possible try Singularity.
# download the Docker image
docker pull tyronechen/multiomics:1.0.0

# check that it works correctly
docker run --rm -it tyronechen/multiomics:1.0.0 Rscript -e 'packageVersion("multiomics")'

# this opens a bash shell where you can use run_pipeline.R
docker run --rm -it --entrypoint bash tyronechen/multiomics:1.0.0

# copy the script from install location or repository as shown in the previous section
# once you have a copy of the script in your current working directory, you can run this commandRscript run_pipeline.R -h
If you don’t have root access, you can try Singularity. The Singularity image file is large and you may need to set $SINGULARITY_TMPDIR to a custom location with at least 1 GB of free space.
# set singularity tmpdir to a location of your choice
# if you are not in a HPC you can usually skip this
export SINGULARITY_TMPDIR=/path/to/directory

singularity pull multiomics.sif docker://tyronechen/multiomics:1.0.0

# copy the script from install location or repository as shown above and runsingularity exec multiomics.sif Rscript run_pipeline.R -h
Manual install
If the above automated install steps do not work, detailed manual installation instructions are available in the source git repository at https://gitlab.com/tyagilab/sars-cov-2/-/tree/master for conda and R.
You may need to install mixOmics from source. Follow the installation instructions on https://github.com/aljabadi/mixOmics#installation:
install_github("mixOmicsTeam/mixOmics")The actual script used to run the pipeline is not directly callable but provided as a separate script. Running the following command will show you the path to the script. A copy of this is also available in the source git repository.
system.file("scripts", "run_pipeline.R", package="multiomics")
# outside of R
Rscript run_pipeline.R -hExample input
Three elements are the minimum required input for the pipeline [Figure 2]. First, at least two files corresponding to omics data blocks are required. Next, a file containing biological class information is required. Finally, a list of unique names labelling each data block is required. Examples of these input files and their internal data structure as they appear in the pipeline are shown.
# download omic data block 1
url <- paste(
  "https://gitlab.com/tyagilab/sars-cov-2/",
  "/raw/master/data/case_study_2/data_lipidomics.tsv",
  sep="-"
)
download.file(url, "data_lipidomics.tsv")

# download omic data block 2
url <- paste(
  "https://gitlab.com/tyagilab/sars-cov-2/",
  "/raw/master/data/case_study_2/data_metabolomics.tsv",
  sep="-"
)
download.file(url, "data_metabolomics.tsv")

# download class information
url <- paste(
  "https://gitlab.com/tyagilab/sars-cov-2/",
  "/raw/master/data/case_study_2/classes_diablo.tsv",
  sep="-"
)
download.file(url, "classes_diablo.tsv")

# inspect the data
> lipid <- read.table(
  "data_lipidomics.tsv", sep="\t", header=TRUE, row.names=1
  )
> head(lipid[,1:2])
#    AC.10.0_RT_6.936 AC.12.0_RT_7.955
# C1    18.13745    16.84196
# C10    20.48135    18.06048
# C100    22.32588    21.30632
# C101    20.56189    18.84777
# C102    22.28591    17.98330
# C103    18.18658    16.97716

> metab <- read.table(
  "data_metabolomics.tsv", sep="\t", header=TRUE, row.names=1
  )
> head(metab[,1:2])
#  X1.2.Propanediol..2TMS.de X2.3.Dihydroxybutanoic.ac
# C1        22.52599        13.89898
# C10        22.63460        17.85105
# C100        22.12956        13.34028
# C101        21.94220        17.44137
# C102        21.87579        17.88084
# C103        21.37599        14.28262

> biological_classes <- read.table(
  "classes_diablo.tsv", sep="\t", header=TRUE, row.names=1
  )
> head(biological_classes)
#  Hospital_free_days_45
# C1      More severe
# C10      More severe
# C100      Less severe
# C101      Less severe
# C102      More severe
# C103      More severe

> data_names
# [1] "lipidome" "metabolome"
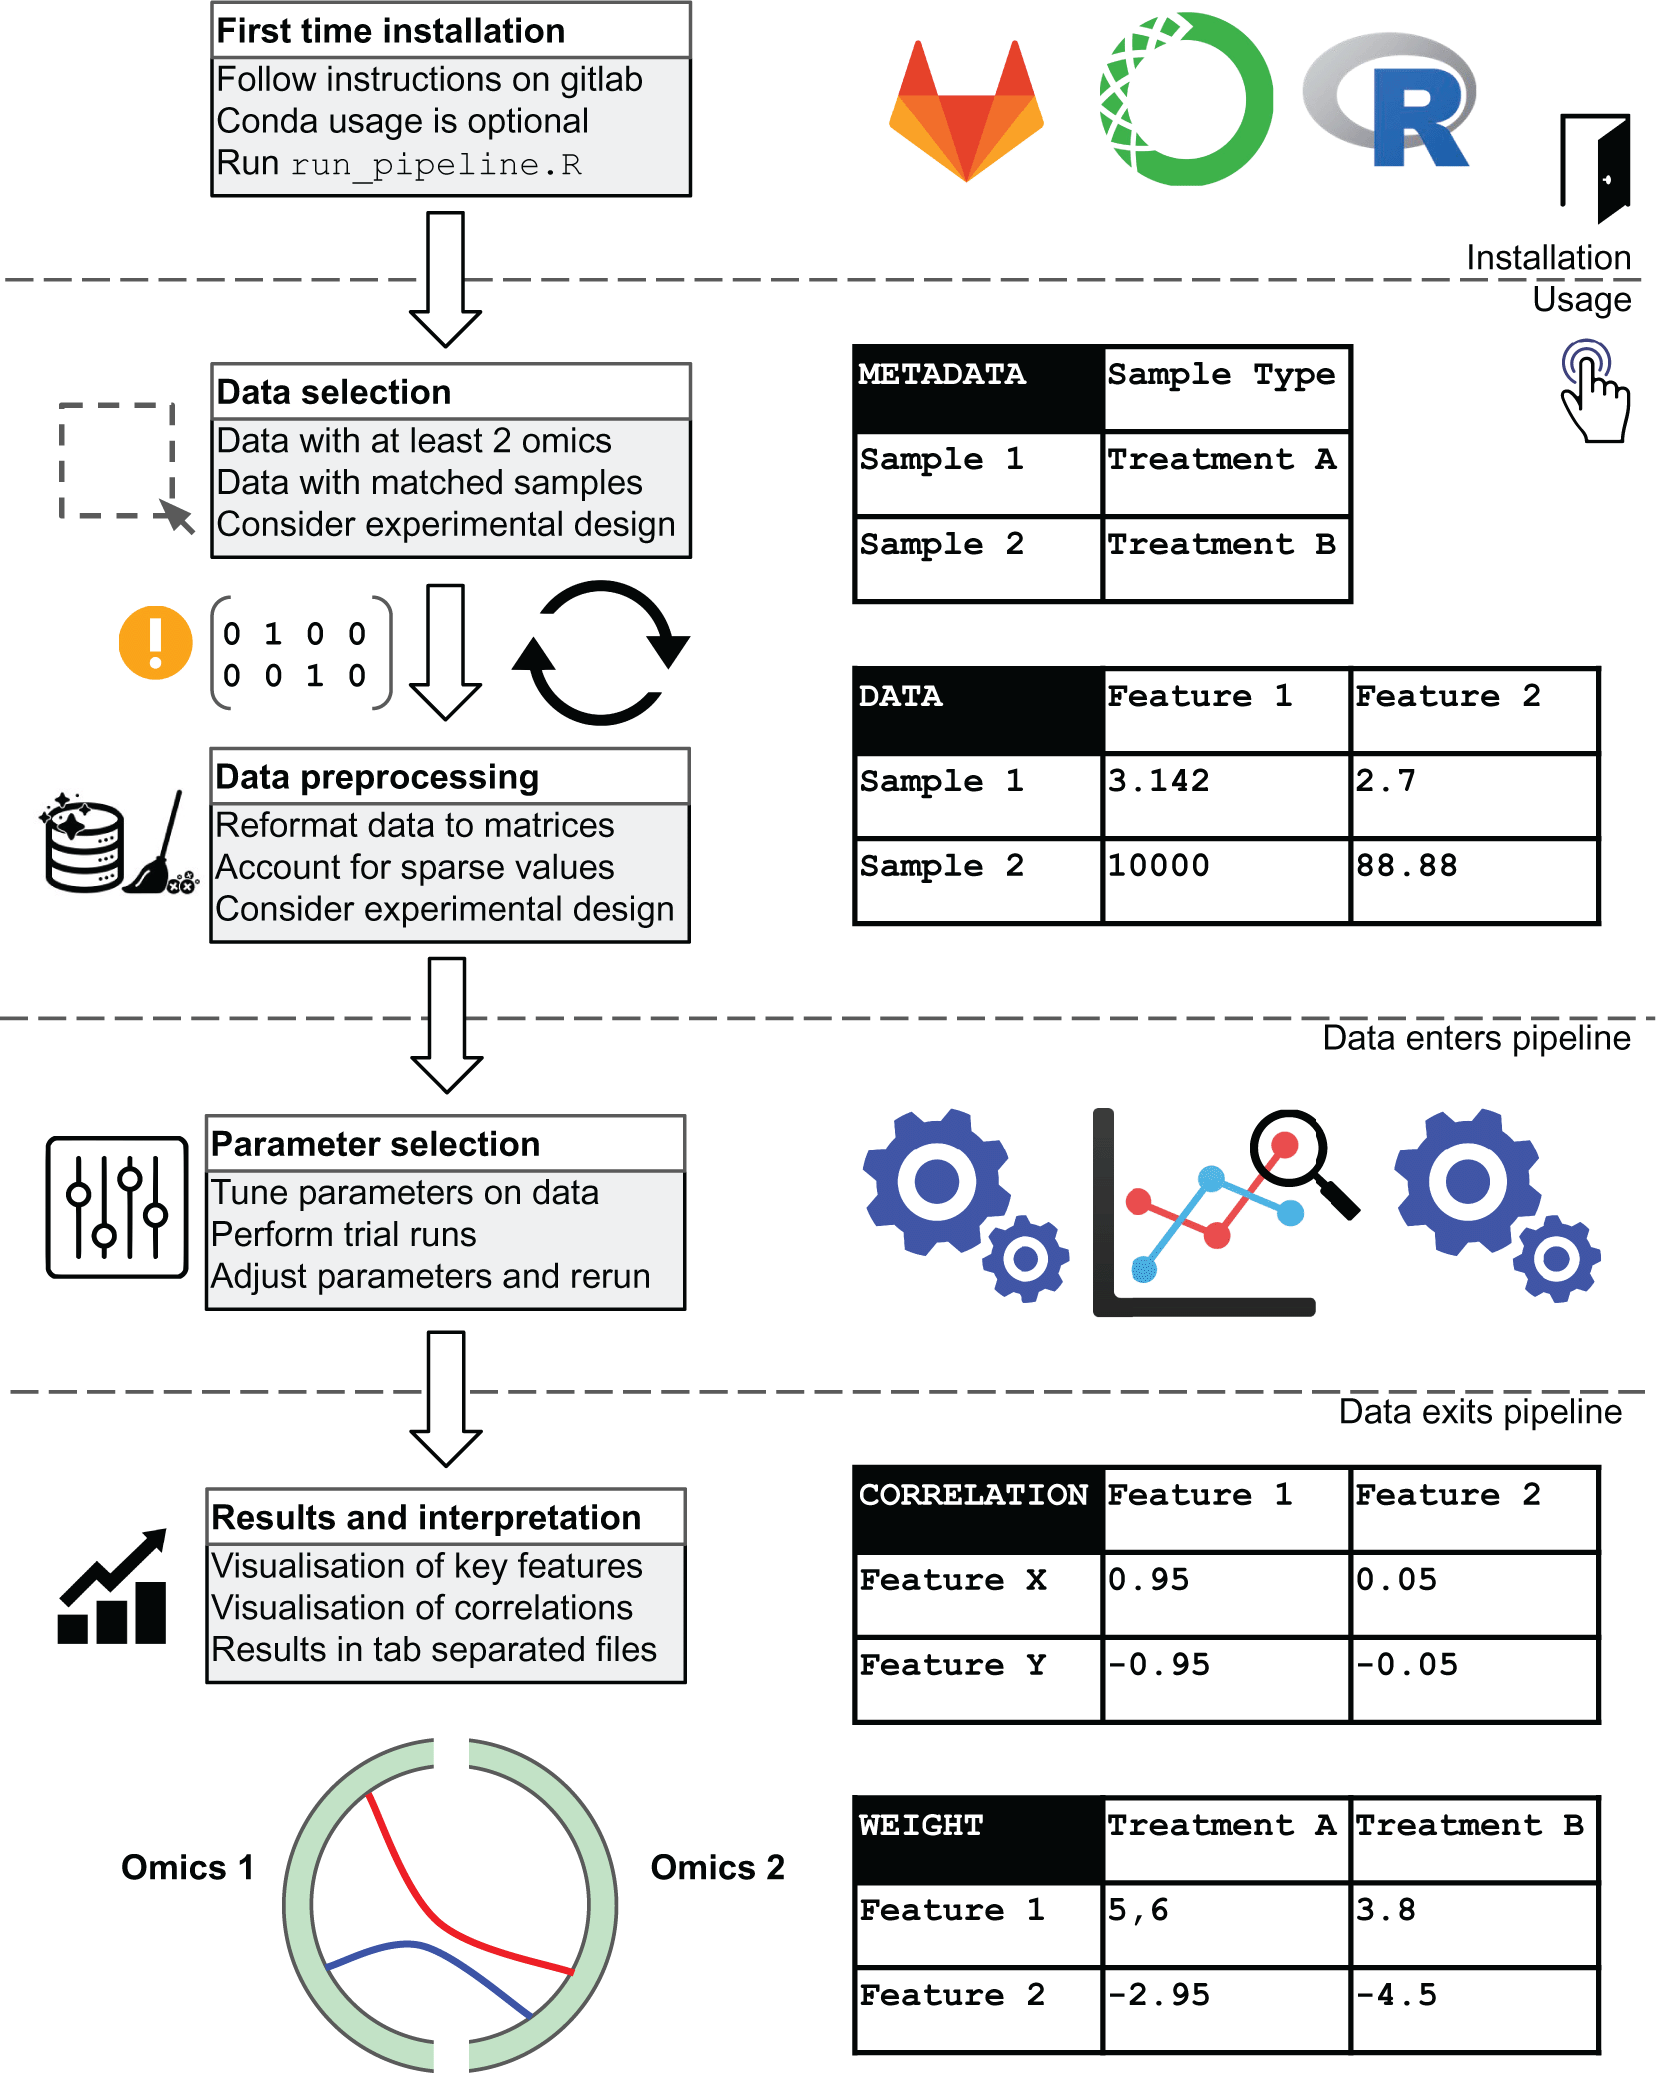
We summarise pipeline installation steps and the flow of data through the pipeline. This figure was originally published on gitlab under a CC-BY-3.0 AU license and is reproduced here with permission.
Note that column names and row names should be truncated to avoid bugs in the pipeline associated with name length. Furthermore, usage of non-alphanumeric characters in their names should be avoided as R quietly replaces these with. (periods).
The pipeline is run with the command Rscript run_pipeline.R and passing a list of command line arguments either as strings of text or in a json file (recommended). Running the actual pipeline can take some time. The main bottleneck is parameter tuning which scales exponentially with the number of omics data blocks, but it is possible to disable this if the user wants to perform a test run or is already aware of the parameters. We note that R Data objects are periodically exported that allow for seamless integration with functions in the underlying mixOmics package when needed. A secondary bottleneck is data imputation, which scales with the number of components used and the dimensions of the input data. If needed, it is possible to impute and export this imputed data either with the pipeline or with the underlying mixOmics function, and then substitute that as input. The user can adjust the number of cpus if needed to speed up the process. Data imputation can be skipped if it is not required.
Code for the pipeline can be examined in detail from the git repository or individual functions can be inspected directly after loading the R multiomics package.
Output files include a pdf file compiling all graphical output.20-24 Note that this can be quite large, especially if you have a large dataset. A graphml file is also exported for input into cytoscape.25 Due to the size and volume of plots, we provide a link to some example plots here. A manuscript using figures generated from this pipeline is also available for reference.26
Each analysis generates a series of text files containing feature weights. In some ways, these are functionally analogous to differential expression analyses, where these coefficients summarise the features with the most phenotypically relevant information. At the same time, a table of feature correlations across multi-omics data is generated. Some examples of these are shown below:
# download single-omic variable weights
url <- paste(
  "https://gitlab.com/tyagilab/sars-cov-2/",
  "-/raw/master/results/case_study_2/",
  "lipidome_sPLSDA_max.txt",
  sep=""
  )
download.file(url, "lipidome_sPLSDA_max.txt")

# download multi-omic variable weights
# this is for a single block of omics data
url <- paste(
  "https://gitlab.com/tyagilab/sars-cov-2/",
  "-/raw/master/results/case_study_2/",
  "lipidome_DIABLO_max.txt",
  sep=""
  )
download.file(url, "lipidome_DIABLO_max.txt")

# download multi-omic correlations
url <- paste(
  "https://gitlab.com/tyagilab/sars-cov-2/",
  "-/raw/master/results/case_study_2/",
  "DIABLO_var_keepx_correlations.txt",
  sep=""
  )
download.file(url, "DIABLO_var_keepx_correlations.txt")

> lipid_splsda <- read.table(
  "lipidome_sPLSDA_max.txt", header=TRUE, sep="\t", row.names=1
  )
> colnames(lipid_splsda)
# [1] "More.severe"  "Contrib.Less.severe" "Contrib.More.severe" "Contrib"
# [5] "GroupContrib"  "color"          "importance"
> head(lipid_splsda[,1:2])
#                More.severe Contrib.Less.severe
# Unknown_mz_794.50909_._R   0.5552234      -0.3042823
# Unknown_mz_784.5116_._RT  -0.5015304       0.6519465
# Unknown_mz_632.40179_._R  -0.4719458       0.3883697
# Unknown_mz_594.49445_._R  -0.6700148       0.5980478
# Unknown_mz_481.04605_._R  -0.7062099       0.5334766
# Unknown_mz_289.07495_._R  -0.6902981       0.1644617

> lipid_diablo <- read.table(
  "lipidome_DIABLO_max.txt", header=TRUE, sep="\t", row.names=1
  )
> colnames(lipid_diablo)
# [1] "More.severe"  "Contrib.Less.severe" "Contrib.More.severe" "Contrib"
# [5] "GroupContrib"  "color"          "importance"
> head(lipid_diablo[,1:2])
#                More.severe Contrib.Less.severe
# Unknown_mz_632.40179_._R  -0.4719458       0.3883697
# Unknown_mz_784.5116_._RT  -0.5015304       0.6519465
# Unknown_mz_229.15463_._R  -0.4703626       0.3841564
# Unknown_mz_794.50909_._R   0.5552234      -0.3042823
# Unknown_mz_243.13472_._R  -0.4772169       0.3736290
# Unknown_mz_289.07495_._R  -0.6902981       0.1644617

> correlations <- read.table(
  "DIABLO_var_keepx_correlations.txt", header=TRUE, sep="\t", row.names=1
  )
> dim(correlations)
# [1] 80 80
> head(correlations[,1:2])
#                PI.18.2_18.1_RT_20.436 PI.38.6_RT_20.119
# PI.18.2_18.1_RT_20.436       0.23614781      0.224478910
# PI.38.6_RT_20.119          0.22447891      0.222982076
# Unknown_mz_229.15463_._R      0.06458937      -0.019670684
# Unknown_mz_243.13472_._R      0.08228558      -0.004164718
# Unknown_mz_247.09216_._R      0.18821603      0.143643243
# Unknown_mz_289.07495_._R      0.11050560      0.040398304
An R data file containing all of the information above and a script containing command line arguments which can be used to reproduce the analysis are also exported to enable full reproducibility.
Examples of these output files for two case studies are included in the source git repository.
We demonstrate a sample use case of our pipeline with reference to an earlier re-analysis of a published dataset.13,26 Our tool takes as input at least two data files present as tables of quantitative information, with samples as rows and features as columns. A list of names corresponding to the names of these data blocks are required. A file containing class information is also required as a list of newline separated values. Examples of these data and class files for two case studies are included in the source git repository. Other command line arguments are also possible pertaining to distance metrics of choice for prediction, number of features to select and others. A full description of these can be obtained by running Rscript run_pipeline.R -h, which will list every flag in detail. Because of the number of command line arguments, an option is provided to pass these parameters as a json file to the pipeline. Examples of these json files for two case studies are included in the source git repository.
Regarding input data, some example data27 is provided as part of our R package.
library(multiomics)
data(two_omics)
help(two_omics)

> names(two_omics)
# [1] "classes"  "lipidome"  "metabolome"

> sapply(two_omics, dim)
$classes
# NULL

$lipidome
# [1] 100 3357

$metabolome
# [1] 100 150
Alternatively, you may download this from our git repository directly. This is a subset of anonymised clinical data provided in a separate publication.27
We provide a fully processed dataset as a guide for the user. The steps below can be reproduced by downloading the R data object with the following command:
url <- paste(
  "https://gitlab.com/tyagilab/sars-cov-2/",
  "/raw/master/results/case_study_2/RData.RData",
  sep="-"
)
download.file(url, "RData.RData)
load("RData.RData")
ls()
# [1] "argv"       "classes"          "data"
# [4] "data_imp"     "data_pca_multilevel"   "data_plsda"
# [7] "data_splsda"   "diablo"           "dist_diablo"
# [10] "dist_plsda"    "dist_splsda"        "linkage"
# [13] "mappings"     "pca_impute"         "pca_withna"
# [16] "pch"        "perf_diablo"        "tuned_diablo"
# [19] "tuned_splsda"
Inspecting the minimum required input (classes and data) reveals the following:
# number of samples
> length(classes)
# [1] 100

# data dimensions
> sapply(data, dim)
#   lipidome metabolome proteome transcriptome
# [1,]     100    100     100      100
# [2,]    3357    150    517    13263

> table(classes)
# classes
# Less severe More severe
#      49      51

> head(data$lipidome[,1:3])
# AC.10.0_RT_6.936 AC.12.0_RT_7.955 AC.13.0_RT_8.306
# C1     18.13745    16.84196    12.84435
# C10     20.48135    18.06048    15.17862
# C100    22.32588    21.30632    14.91515
# C101    20.56189    18.84777    14.46379
# C102    22.28591    17.98330    14.90019
# C103    18.18658    16.97716    13.36094
First, data is filtered if associated options are specified by the user. Features with missing values across sample groups are discarded by default. The user can also choose to filter out features (columns) exceeding a certain threshold of missing values.
Imputing missing values is optional as PLS-derived methods can function without this step. However, we include this information in case the user would like to perform this step manually. Remaining missing values can be imputed by the user-specified --icomp flag. Imputation is effective when the quantity of missing values is <20% of the data. To investigate if the data has been significantly changed, the user can plot a correlation plot of the principal components before and after imputation. Since imputation can take a long time, especially for large datasets, the imputed data is saved by default and the user can load it in directly as input if desired.
If the study design is longitudinal (e.g. has repeated measurements on the same sample), then the --pch flag should be enabled by the user. The user should pass in a file with the same format as the classes file, but containing information regarding the repeated measurements.23,28 Providing this information allows the pipeline to adjust for this internally.
Most of the parameters for the machine learning algorithms are specified by the user. These cover the three methods PLSDA (partial least squares discriminant analysis), sPLSDA (sparse PLSDA) and multi-block sPLSDA (also known as DIABLO). The underlying methods are implemented within the mixOmics software package and more information is available on their website http://mixomics.org/. For each method, a distance metric is specified, either “max.dist”, “centroids.dist” or “mahalanobis.dist”. Unlike PLSDA, sPLSDA and multi-block sPLSDA focus on selecting subset of the most relevant features and therefore require a user-specified list describing the quantity of features to be selected from the data. The number of components to derive for each method is also provided. For this section, several exploratory runs with a wide range can be carried out to find the optimal configuration of features, e.g. starting at 5,10,30,50,100, inspecting subsequent output and further narrowing the range. The user can specify a few additional special parameters to the multi-block sPLSDA (block.splsda) function. The linkage parameter is a continuous value from 0 to 1, and describes the type of analysis, with a value closer to 0 prioritising class discrimination and a value closer to 1 prioritising correlation between data sets. Meanwhile, setting the number of multi-block sPLSDA components to 0 causes the pipeline to perform parameter tuning internally. Note that this can take a long time, and scales exponentially per added block of omics data. The user can also specify the number of cpus to be used for parallel processing, which mainly affects parameter tuning. Using our example, these arguments are provided here:
> argv
# ...
# $ncpus
# [1] 16

# $diablocomp
# [1] 0

# $linkage
# [1] 0.1

# $diablo_keepx
# [1] "5,6,7,8,9,10,30"

# $pcomp
# [1] 10

# $plsdacomp
# [1] 2

# $splsdacomp
# [1] 2

# $splsda_keepx
# [1] "5,6,7,8,9,10,30"

# $dist_plsda
# [1] "centroids.dist"

# $dist_splsda
# [1] "centroids.dist"

# $dist_diablo
# [1] "centroids.dist"
# ...
To examine the performance of each method, “M-fold” or “leave-one-out” cross-validation is performed to generate error rate plots. To account for cases where sample classes are imbalanced, balanced error rates which simply averages the class-wise error rates are also calculated and shown [Figure 3].
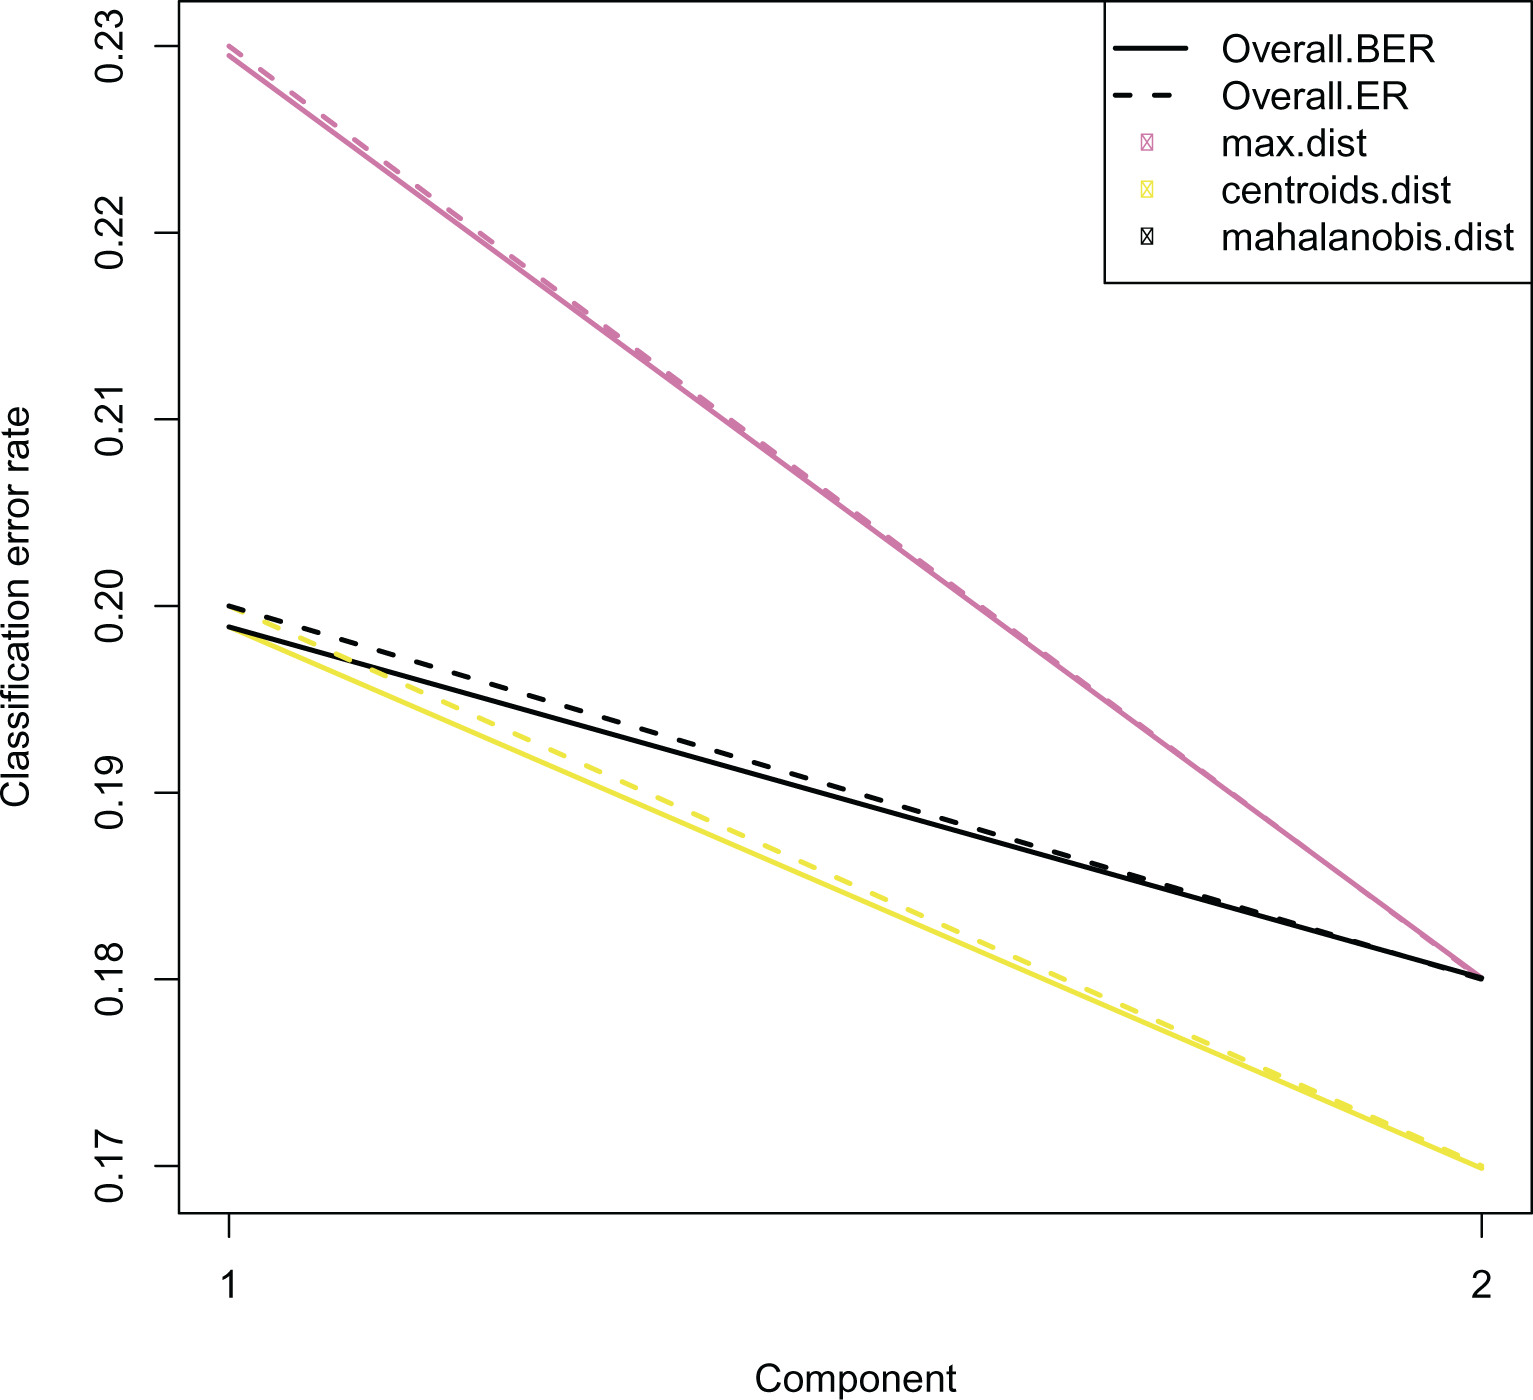
Error rates are calculated by “leave-one-out” cross-validation implemented in mixOmics. These plots are generated for each analysis type (PLSDA/sPLSDA/DIABLO). An example showing error rates for DIABLO is shown here. This figure was originally published on gitlab under a CC-BY-3.0 AU license and is reproduced here with permission.
Results are exported in a series of plots and compiled into a pdf [Figure 4]. They can also be accessed internally from our provided R data object.
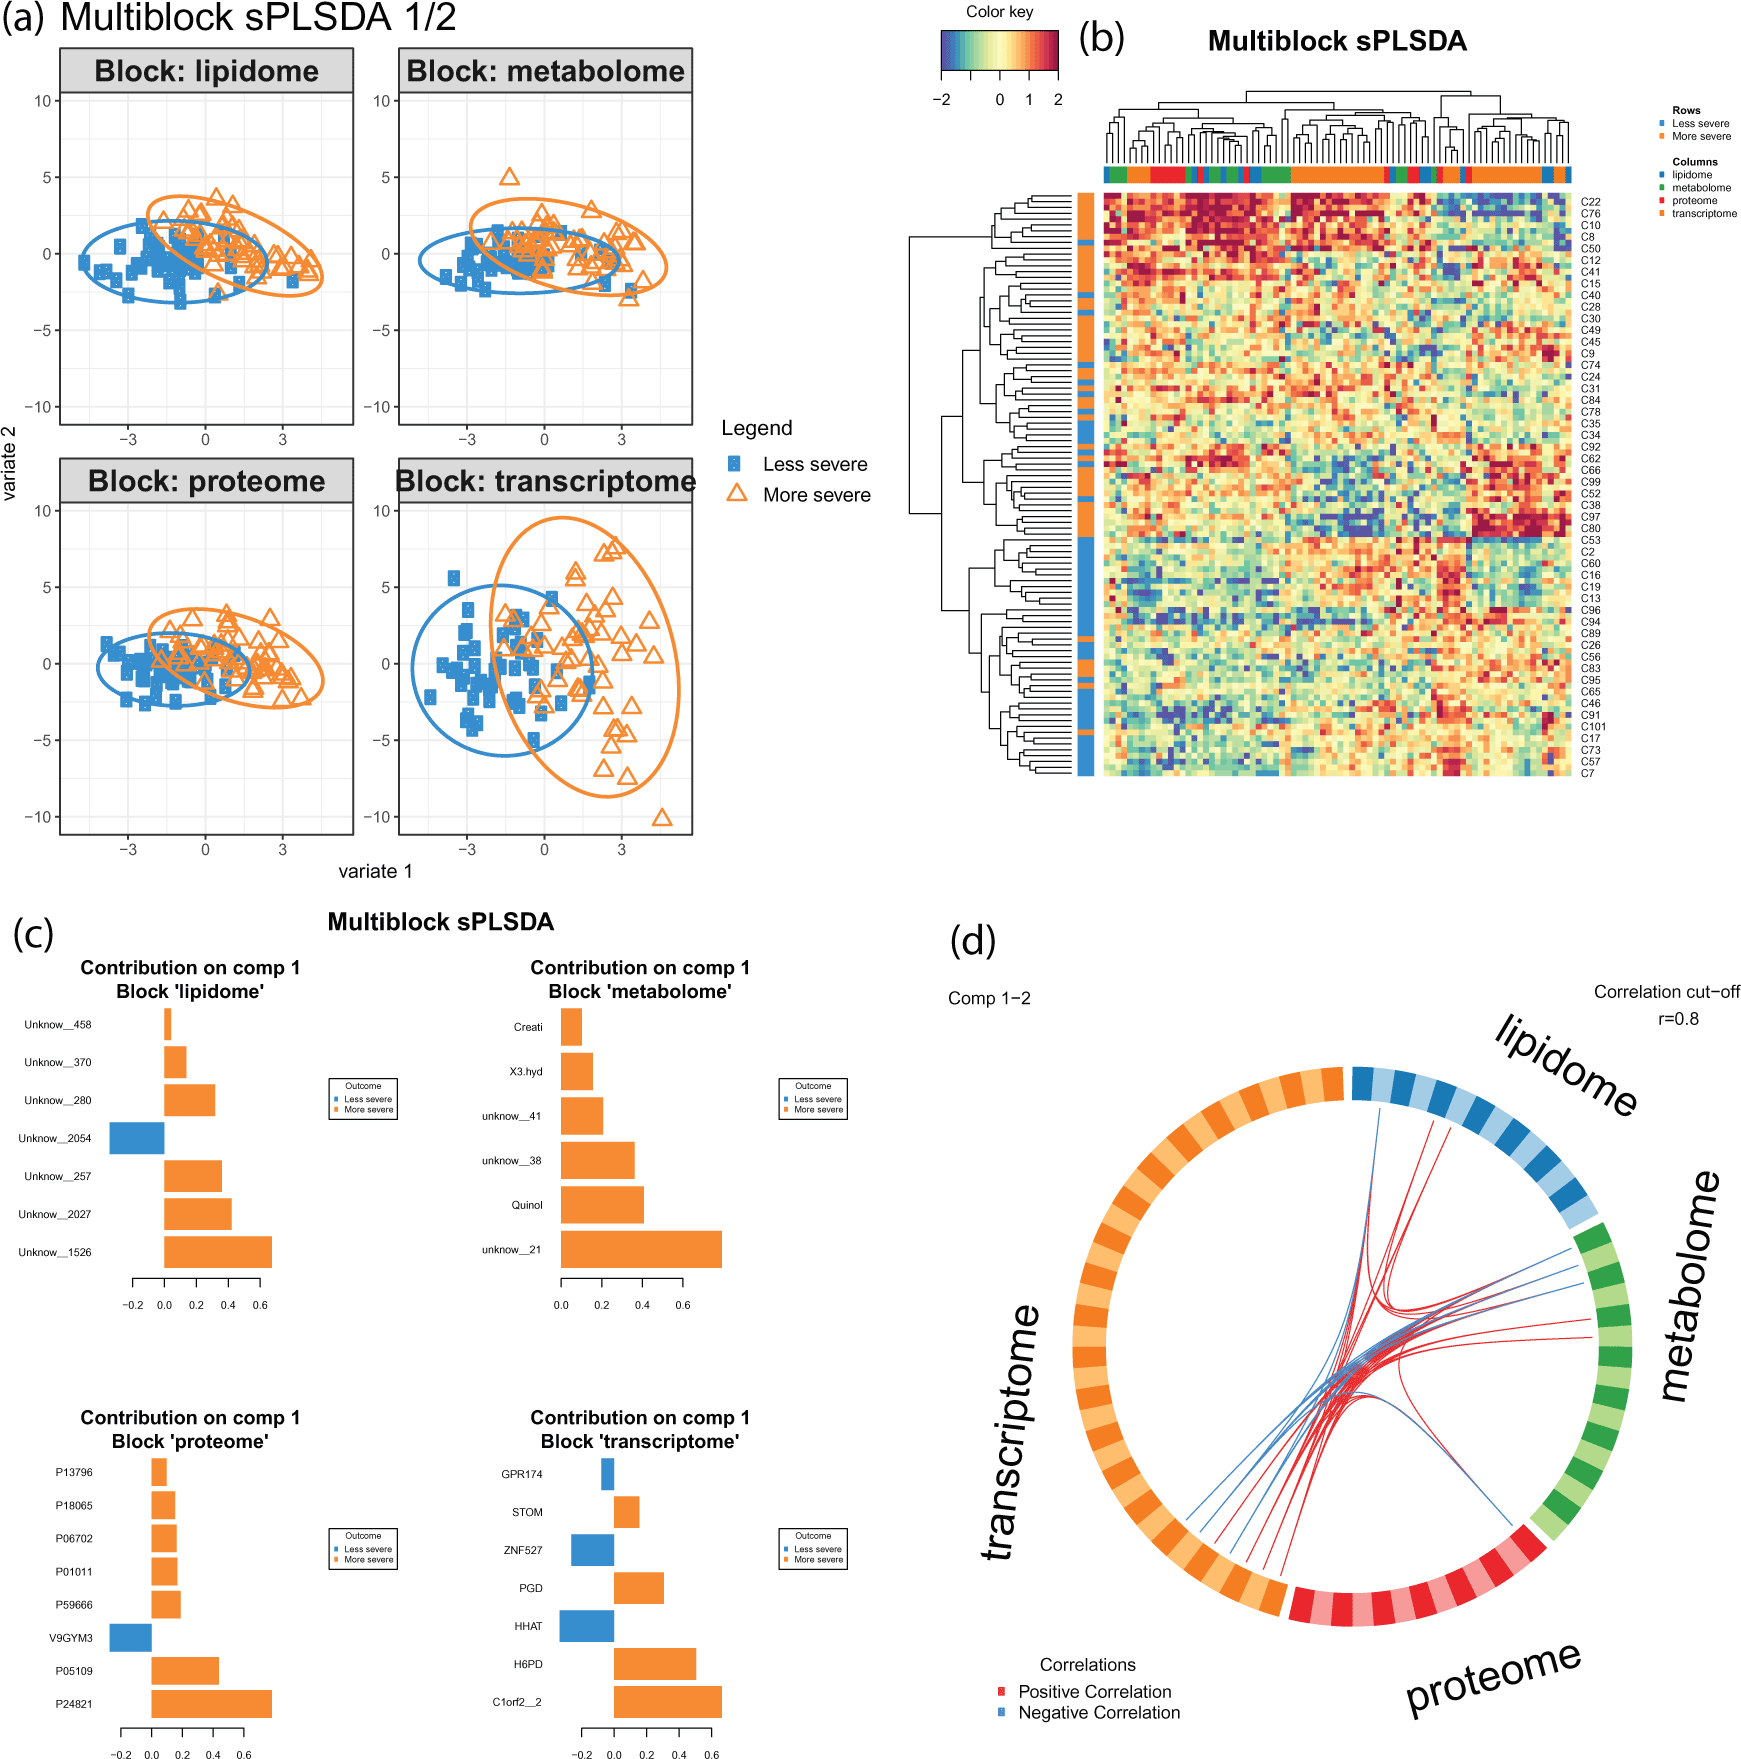
(a) Multi-block sPLSDA (DIABLO) plots for component 1 and 2 can be interpreted similar to a PCA except that the model aims to discriminate the sample groups. (b) Clustered image maps show the relationship between variables and omics data blocks. (c) Barplots of loading weights show the contributions of variables towards each biological condition for each block. (d) Circosplot depicts the high multivariate correlations between the selected features from each block. Line thickness indicates the strength of the correlation. This figure was originally published on gitlab under a CC-BY-3.0 AU license and is reproduced here with permission.
Pipeline output can be controlled by specifying a number of flags. By default, the pipeline deposits data in the current working directory. This behaviour can be easily modified. Setting outfile_dir specifies the master output directory. An R data object containing objects shown in the loaded RData file can be renamed with the rdata option, generating a file similar to the one used in this example. The plot flag defines the pdf file containing all graphical output as a multi-page pdf of all plots generated in the pipeline. A reproducible script is generated and named by the user with the args flag (this defaults to Rscript.sh).
> argv
# ...
# $outfile_dir
# [1] "../results/"

# $rdata
# [1] "RData.RData"

# $plot
# [1] "Rplots.pdf"

# $args
# [1] "Rscript.sh"
# ...
Finally, the pipeline has a limited check-pointing built-in. At each milestone in the pipeline, the relevant output is saved and written out as a RData file, similar to the one presented above. This allows the user to manually inspect the data and adjust it to their needs where needed. In the case of completed output, the user can further customise plots and data exports for publication or downstream analysis. Importantly, data objects are compatible with core mixOmics functions, and allows seamless integration with the mixOmics suite of tools if the user intends to extend or perform their own custom analysis workflows.
Primary data was generated by third parties and is publicly available.27,29 For case study 1, translatome data is available from the source publication as Supplementary Table 1 and proteome data is available as Supplementary Table 2. For case study 2, the authors provided their data in a sql database.
Zenodo: Multi-omics data harmonisation for the discovery of COVID-19 drug targets. https://doi.org/10.5281/zenodo.4602867.13
This project contains the following data.
• Documentation in markdown format describing pipeline usage on two case studies.
• Input data files in plain text (see Source Data for more information).
• Graphical output as pdf files and feature weights as text files.
• Source code, including code to reproduce figures in this article and source code for the R package.
• Docker file specifications for use with Docker and singularity images.
Gitlab: SARS-CoV-2.https://gitlab.com/tyagilab/sars-cov-2.13
• Documentation in markdown format describing pipeline usage on two case studies.
• Input data files in plain text (see Source Data for more information).
• Graphical output as pdf files and feature weights as text files.
• Source code, including code to reproduce figures in this article and source code for the R package.
• Docker file specifications for use with Docker and singularity images.
The following underlying data is used in this article:
• data_lipidome.tsv (Text file as raw input data (lipidomics) for case study 2.)
• data_metabolome.tsv (Text file as raw input data (metabolomics) for case study 2.)
• classes_diablo.tsv (Text file as raw input data (biological classes) for case study 2.)
• RData.RData (R data object containing all input, intermediate and output data for case study 2.)
• manuscript_figures (Example output plots that can be generated by the pipeline.)27,29
Code and data is available under the MIT license. Documentation is available under the CC-BY-3.0 AU license.
The following extended data is available in the same repository:
• data/case_study_1 (All raw input data for case study 1.)
• data/case_study_2 (All raw input data for case study 2.)
• results/case_study_1 (Example output data for case study 1.)
• results/case_study_2 (Example output data for case study 2.)
Similar to underlying data, extended code and data is available under the MIT license. Documentation is available under the CC-BY-3.0 AU license.
• Software available through R directly:
install.packages("devtools")
library("devtools")
install_github("mixOmicsTeam/mixOmics")
install_gitlab("tyagilab/sars-cov-2", subdir="multiomics")
The actual script used to run the pipeline is not directly callable but provided as a separate script.
# this will show you the path to the script
system.file("scripts", "run_pipeline.R", package="multiomics")
• Source code available from: https://gitlab.com/tyagilab/sars-cov-2
• Archived source code at time of publication: https://doi.org/10.5281/zenodo.4562009
• License: MIT License. Documentation provided under a CC-BY-3.0 AU license
The specific version numbers of the packages used are shown below, along with the version of the R installation.
> library(multiomics)
> sessionInfo()
# R version 4.0.3 (2020-10-10)
# Platform: x86_64-pc-linux-gnu (64-bit)
# Running under: Ubuntu 16.04.7 LTS
#
# Matrix products: default
# BLAS:  /usr/lib/atlas-base/atlas/libblas.so.3.0
# LAPACK: /usr/lib/atlas-base/atlas/liblapack.so.3.0
#
# locale:
# [1] LC_CTYPE=C.UTF-8    LC_NUMERIC=C        LC_TIME=C.UTF-8
#  [4] LC_COLLATE=C.UTF-8   LC_MONETARY=C.UTF-8    LC_MESSAGES=C.UTF-8
# [7] LC_PAPER=C.UTF-8    LC_NAME=C          LC_ADDRESS=C
# [10] LC_TELEPHONE=C     LC_MEASUREMENT=C.UTF-8  LC_IDENTIFICATION=C

# attached base packages:
# [1] stats  graphics  grDevices utils  datasets  methods  base
# other attached packages:
# [1] multiomics_0.0.0.9000

# loaded via a namespace (and not attached):
# [1] compiler_4.0.3  assertthat_0.2.1 cli_2.3.1  tools_4.0.3  glue_1.4.2
# [6] rlang_0.4.10
Conceptualization, S. T, T. C; Data Curation, S. T, T. C; Formal Analysis, K-A. L-C, T. C; Funding Acquisition, K-A. L-C, S. T; Methodology, A. J. A, K-A. L-C; Project Administration, S. T; Resources, S. T; Supervision, K-A. L-C, S. T; Software, A. J. A, K-A. L-C, T. C; Validation, A. J. A, K-A. L-C, S. T, T. C; Visualization, A. J. A, K-A. L-C, Writing Original Draft Preparation, S. T, T. C; Writing Review & Editing, A. J. A, K-A. L-C, S. T, T. C.
S. T acknowledges the AISRF EMCR Fellowship by the Australian Academy of Science and Australian Women Research Success Grant at Monash University. T. C received funding from the Australian Government Research Training Program Scholarship and Monash Faculty of Science Deans Postgraduate Research Scholarship. K-A. L-C was supported in part by the National Health and Medical Research Council (NHMRC) Career Development fellowship (GNT1159458).
| Views | Downloads | |
|---|---|---|
| F1000Research | - | - |
|
PubMed Central
Data from PMC are received and updated monthly.
|
- | - |
Provide sufficient details of any financial or non-financial competing interests to enable users to assess whether your comments might lead a reasonable person to question your impartiality. Consider the following examples, but note that this is not an exhaustive list:
Sign up for content alerts and receive a weekly or monthly email with all newly published articles
Already registered? Sign in
The email address should be the one you originally registered with F1000.
You registered with F1000 via Google, so we cannot reset your password.
To sign in, please click here.
If you still need help with your Google account password, please click here.
You registered with F1000 via Facebook, so we cannot reset your password.
To sign in, please click here.
If you still need help with your Facebook account password, please click here.
If your email address is registered with us, we will email you instructions to reset your password.
If you think you should have received this email but it has not arrived, please check your spam filters and/or contact for further assistance.
Comments on this article Comments (0)