Keywords
Cannabis, Total Yeast and Mold, Microbiome, Whole Genome Sequencing, qPCR
This article is included in the Cell & Molecular Biology gateway.
Cannabis, Total Yeast and Mold, Microbiome, Whole Genome Sequencing, qPCR
Total yeast and mold testing are required in many states to test the safety of cannabis, prior to the sale of cannabis flowers and cannabis-infused products. Cannabis is an inhaled product, and cases of cannabis-transmitted Aspergillosis have been reported in the clinical literature (Bal et al., 2010; Gargani et al., 2011; McKernan et al., 2015, 2016; Remington et al., 2015; Ruchlemer et al., 2015). Cannabis is a unique matrix, in that antibiotic cannabinoids can make up to 20% of the flowers’ weight, and many fungi infecting cannabis are endophytes. Endophytes are not easily cultured from the plant without lysing open plant cell walls. The conditions which lyse open plant cells walls also lyse open fungal cell walls, thus impacting the viability of the microbes in the lysis and homogenization processes required for testing. Cannabis flowers contain both bacteria and fungi, further complicating fungal quantification for colony forming units (CFU) that lack speciation. Antibiotic selections are often utilized to reduce background bacteria, but many of these antibiotics (e.g. chloramphenicol) inhibit the growth of the most pathogenic fungi found on cannabis (Fusarium, Pythium and Aspergillus) (Smith & Marchant, 1968; Day et al., 2009; Joseph et al., 2015).
As part of an AOAC Emergency response validation (ERV) in the State of Michigan, we investigated the impact of medium selection on surveying total yeast and mold on cannabis. Cured cannabis flowers were homogenized and tested on 3 different plating media. These data were compared to ITS3- and 16S-based qPCR and whole genome sequencing. To further complement these cannabis flower samples, organisms were acquired from the American Tissue Culture Collection (ATCC) and plated as pure monocultures on different plating media to confirm the differential growth on each medium.
Samples originated from Steadfast Analytical Laboratories (Hazel Park, MI) and were tested independently at a laboratory within the Michigan Coalition of Independent Cannabis Testing Laboratories. Briefly, 10 grams of dried cannabis flowers were sampled from three lots of homogenized cannabis containing high, medium and low quantities of fungal and bacterial CFUs, as measured using culture-based techniques with chloramphenicol selection. 10 grams of homogenized flower were soaked with 90 ml of Tryptic Soy Broth (TSB, Medicinal Genomics #420205) in a filtered Nasco Whirl-Pak bag (#B01385). Samples were homogenized by hand, and then 0.1 mL of solution plated onto three media (DRBC, PDA with chloramphenicol, PDA, at 1:100 dilution). Two additional dilutions were prepared (10 mL into 90 mL) and the same plating protocol was followed. All plates were incubated for 5 days at 25°C.
ITS3 qPCR was performed as described in McKernan et al. with two modifications. Briefly, 1ml of homogenate from a Whirl-Pak bag was collected and briefly micro-centrifuged to enrich for live organisms. This pellet was resuspended in 200 μl ddH2O and lysed with the addition of 12 μl of Thaumatin-like protein (TLP) and incubated at 37°C for 30 minutes. This enzymatic lysis step (glucanase) ensures more complete lysis of fungal cell walls (Medicinal Genomics part #420206, McKernan et al., 2015, 2016). 12.5 μl of MGC Lysis buffer was added, vortexed and incubated for 5 minutes at 25°C. Lysed samples were micro-centrifuged and 200 μl of supernatant was aspirated and added to 250 μl of Medicinal Genomics binding buffer (MGC part# 420001) for magnetic bead isolation. The samples were incubated with the Medicinal Genomics magnetic bead mixture for 10 minutes, magnetically separated and washed two times with 70% ethanol. The beads were dried at 37°C for 5 minutes to remove excess ethanol and eluted with 25 μl of ddH2O. Quantitative PCR was performed using Medicinal Genomics PathoSEEK Total Yeast and Mold detection assay (MGC# 420103) and Medicinal Genomics PathoSEEK Total Aerobic Count Assay (MGC# 420106) according to the manufacturers’ instructions on a BioRad CFX96 thermocycler.
A total of 45 colonies were picked with a pipette tip and introduced into 200 μl of ddH2O with 12.5 μl of MGC TLP (MGC part #420206). TLP is a glucanase active at 37°C. Samples were digested for 30 minutes at 37°C and 12.5 μl of MGC Lysis buffer was added, vortexed and incubated for 5 minutes at 25°C. Lysed sample were micro-centrifuged and 200 μl of supernatant was aspirated and added to 250 μl of MGC binding buffer (MGC part # 420001) for magnetic bead isolation. The samples were incubated with the bead mixture for 10 minutes, magnetically separated and washed 2 times with 70% ethanol. The beads were dried at 37°C for 5 minutes to remove excess ethanol and eluted with 25 μl of ddH2O.
Fragmentation
Genomic DNA (gDNA) was quantified with a Qubit (Thermo Fisher Scientific) and normalized to reflect 4-8 ng/μl in 13 μl of TE buffer. Libraries were generated using enzymatic fragmentation with the NEB Ultra II kits (NEB part # E7103). Briefly, 3.5 μl of 5X NEB fragmentation buffer and 1 μl of Ultra II fragmentation enzyme mix are added to 13 μl of DNA. This reaction was tip-mixed 10 times, vortexed, and quickly centrifuged. Fragmentation was performed in a BioRad CFX96 thermocycler at 3.5 minutes at 37°C, 30 minutes at 65°C. The reaction was kept on ice until ready for adaptor ligation.
Adaptor ligation
| Component | Volume (μl) |
|---|---|
| SureSelect Adaptor Oligo Mix (brown cap) | 0.75 |
| ddH2O | 0.5 |
| Ultra II Ligation Master Mix | 15 |
| Ligation enhancer | 0.5 |
| Total Volume | 16.75 |
The master mix for ligation was prepared on ice using 0.75 μl of Agilent SureSelect Adaptor Oligo Mix, 0.5 μl of ddH2O, 15 μl of NEB Ultra II Ligation Master Mix, 0.5 μl of Ligation enchancer (New England Biolabs) for a total reaction volume of 16.75 μl.
Ligation was performed by the addition of 16.75 μl of ligation master mix to the 17.5 μl Fragmentation/End Prep DNA reaction mixture, incubate for 15 minutes at 20°C. To purify excess adaptors and adaptor dimers, AMPure XP beads (Beckman Coulter #A63881) were vortexed at room temperature for resuspension and16 μl (approximately 0.45X) of resuspended AMPure XP beads were added to the ligation reactions. This was well-mixed by pipetting up and down at least 10 times. The mixture was incubated for 5 minutes at 25°C. The PCR plate was placed on an appropriate magnetic stand (Medicinal Genomics #420202) to separate the beads from the supernatant. After the solution was clear (about 5 minutes), the supernatant was carefully removed and discarded. We were careful not to disturb the beads containing target DNAmolecules. The magnetic beads were washed by adding 200 μl of 70% ethanol to the PCR plate while on the magnetic stand. Followed incubation at room temperature for 30 seconds, and then careful removal and discarding of the supernatant. The ethanol wash was repeated once for a total of 2 washes. Trace amounts of ethanol were removed. The beads were air dried for ~ 7 minutes while the PCR plate was on the magnetic stand with the lid open. The PCR plate was then removed from the magnet and target DNA eluted from the beads into 10 μl of H2O, then 9 μl of cleaned DNA was transferred to a fresh well.
PCR amplification
A volume of 12.5 μl 2x NEBNext Q5 Hot Start Master Mix (New England Biolabs #M0492S) was added to 9 μl ligated DNA, then 3.5 μl of NEB 8bp index primer/universal primer were added to the mix. The reaction ran in a cycling program set at 98°C for 30 seconds as an initial denaturization step; six cycles of denaturation, annealing and extension were performed, cycling between 98°C for 10 seconds and 65°C for 75 seconds. A final 5-minute step at 65°C was performed, with a final 4°C forever step.
| Step | Temp | Time | Cycle |
|---|---|---|---|
| Initial denaturation | 98°C | 30 sec | 1 |
| Denaturation Annealing/Extension | 98°C 65°C | 10 sec 75 sec | 6 |
| Final extension | 65°C | 5 min | 1 |
| Hold | 4°C | forever | 1 |
PCR reaction cleanup
AMPure XP beads were resuspended at room temperature with a brief vortex. A volume of 15 μl of resuspended AMPure XP beads was added to the PCR reactions (~ 25 μl). To mix well, we pipetted up and down at least 10 times. The mixture was incubated for 5 minutes at room temperature. The PCR plate was put on an appropriate magnetic stand to separate the beads from the supernatant. After the solution was clear (about 5 minutes), the supernatant was carefully removed and discarded. We were careful not to disturb the beads containing the target DNA. A volume of 200 μl of 70% ethanol was added to the PCR plate while on the magnetic stand. The mix was incubatedat room temperature for 30 seconds, and then the supernatant was carefully removed and discarded. The ethanol wash was repeated once more. The beads were air dried fof 7 minutes while the PCR plate was on the magnetic stand with the lid open. The target DNA molecules were eluted from the beads into 15 μl of nuclease-free H2O, and 15 μl were transferred into a fresh well.
Sample quality control
Libraries were evaluated on an Agilent Tape Station prior to pooling for Illumina sequencing. Sequencing was performed by GeneWiz, Cambridge MA. A total of 473 million paired reads (2 × 150bp) were generated, averaging over 10 million read pairs per sample and a total sequence of 141Gb.
Fastq files were uploaded to OneCodex) for Kmer analysis and Simpson’s diversity index analysis for each genome (Extended data: Supplementary Table 1, sheet Summary https://doi.org/10.5281/zenodo.4759883). Reads were also assembled with MegaHit v.1.2.9 (Li et al., 2015, 2016). The Nextflow mapping and assembly pipeline is published on GitHub. Quast 5.0 was used to calculate the assembly quality statistics (Gurevich et al., 2013). Sequencing data is deposited in NCBI under Project ID PRJNA725256.
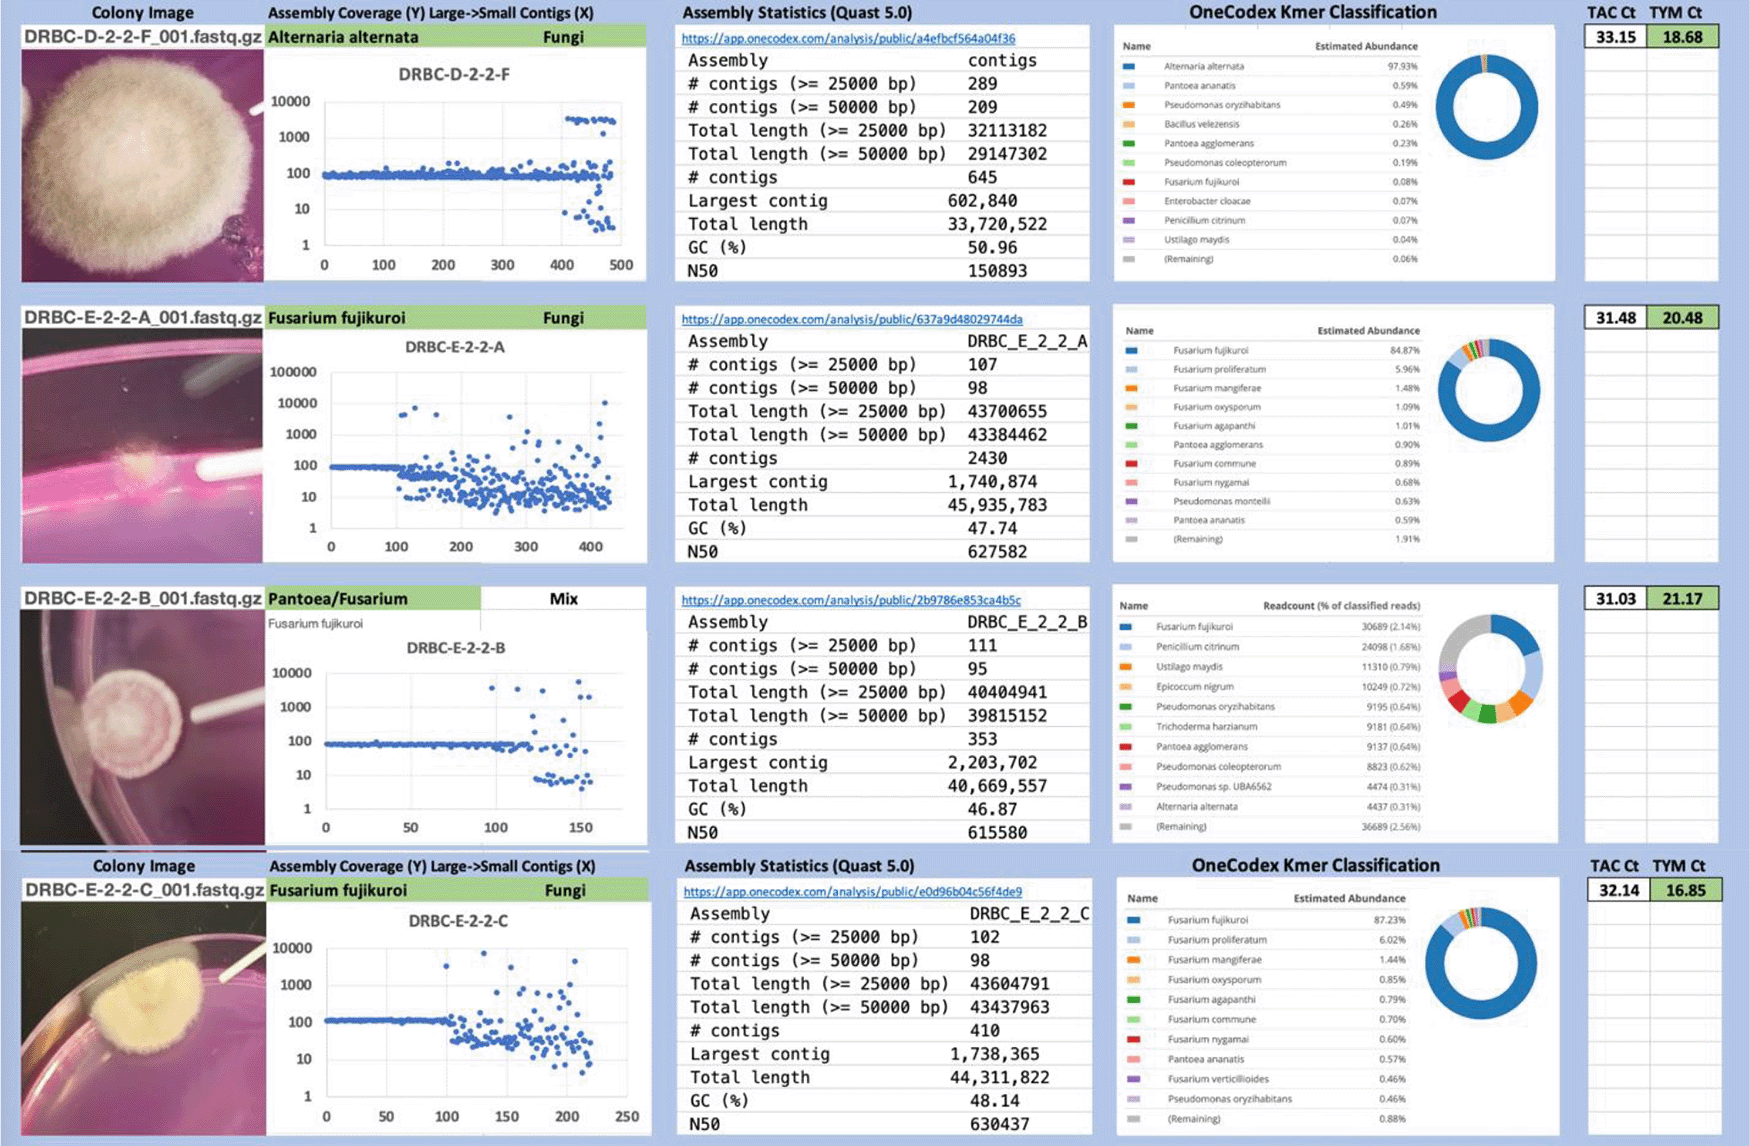
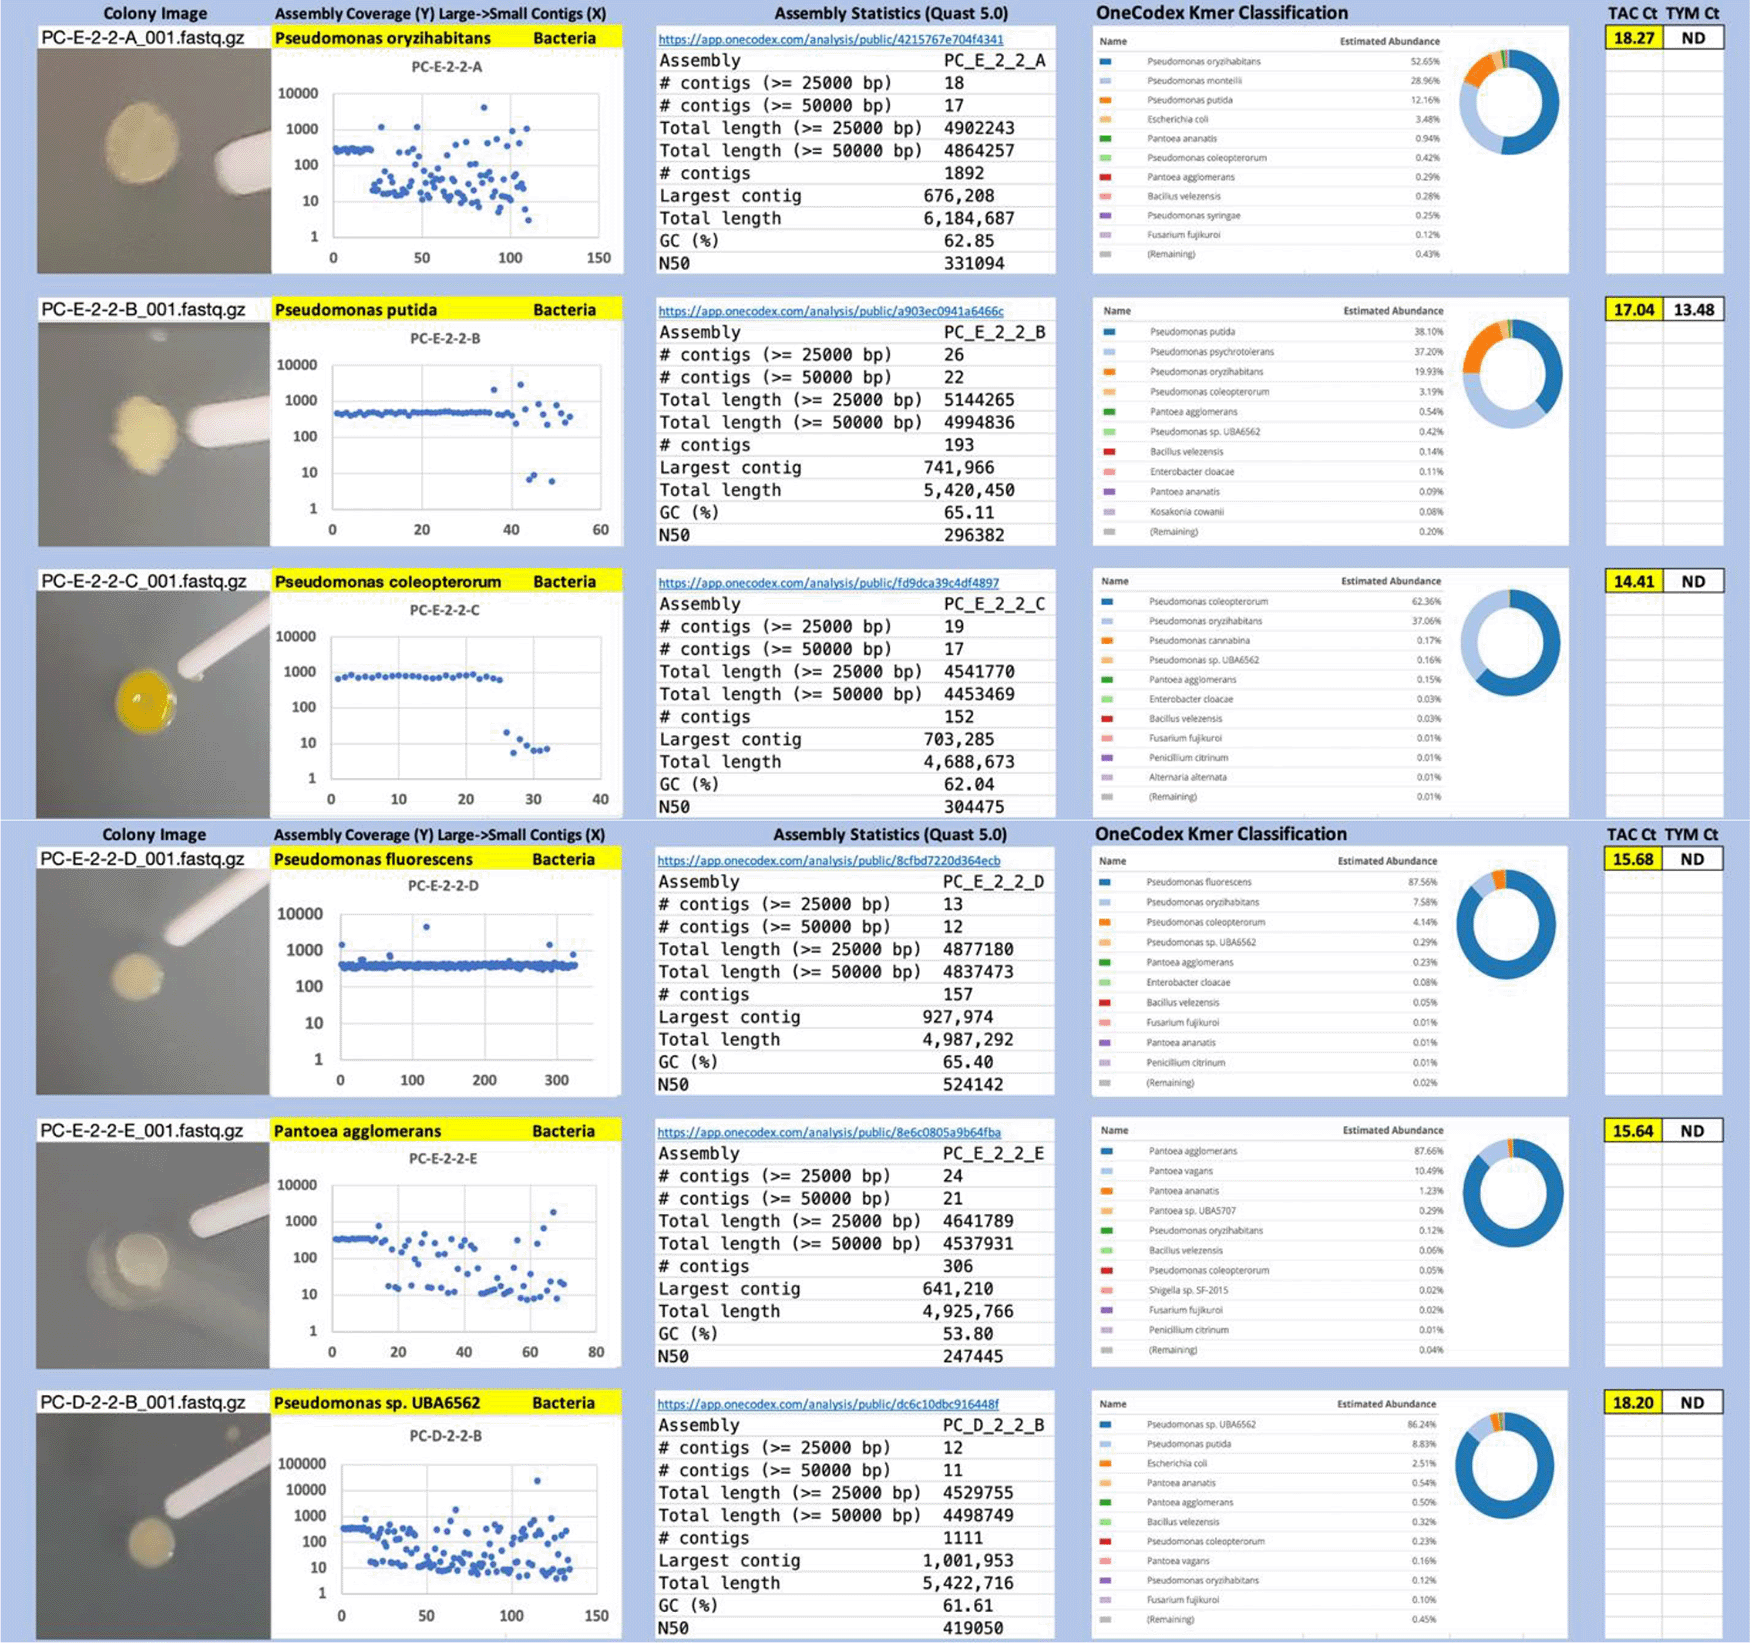
Each colony which was imaged on plates and chosen for whole genome sequencing and OneCodex analysis is displayed in Figure 1 (DRBC), Figure 2 (PDA-chloramphenicol) and Figure 3 (PDA no chloramphenicol). A link to each OneCodex analysis and its respective NCBI submission ID is available in Supplementary Table 1 - Sheet Summary (Extended data, McKernan et al., 2021). Some of the colonies from the plate merged with other colonies producing mixtures of genomes as evident in the OneCodex pie charts. These merged colonies were further evidenced by the display of bimodal sequence coverage (clusters of contigs at 1000X and 10X coverage) and compared with the plating images (Figure 4). A heatmap of sequencing read speciation and purity is seen in Figure 5. While merged colonies can be difficult to resolve visually, whole genome sequencing can resolve simple metagenomes and still extract additional diversity information from the samples. Colonies that were noticeably mixed according to sequence analysis and colony visual inspection were more prevalent with the PDA without selection colonies (Table 1).
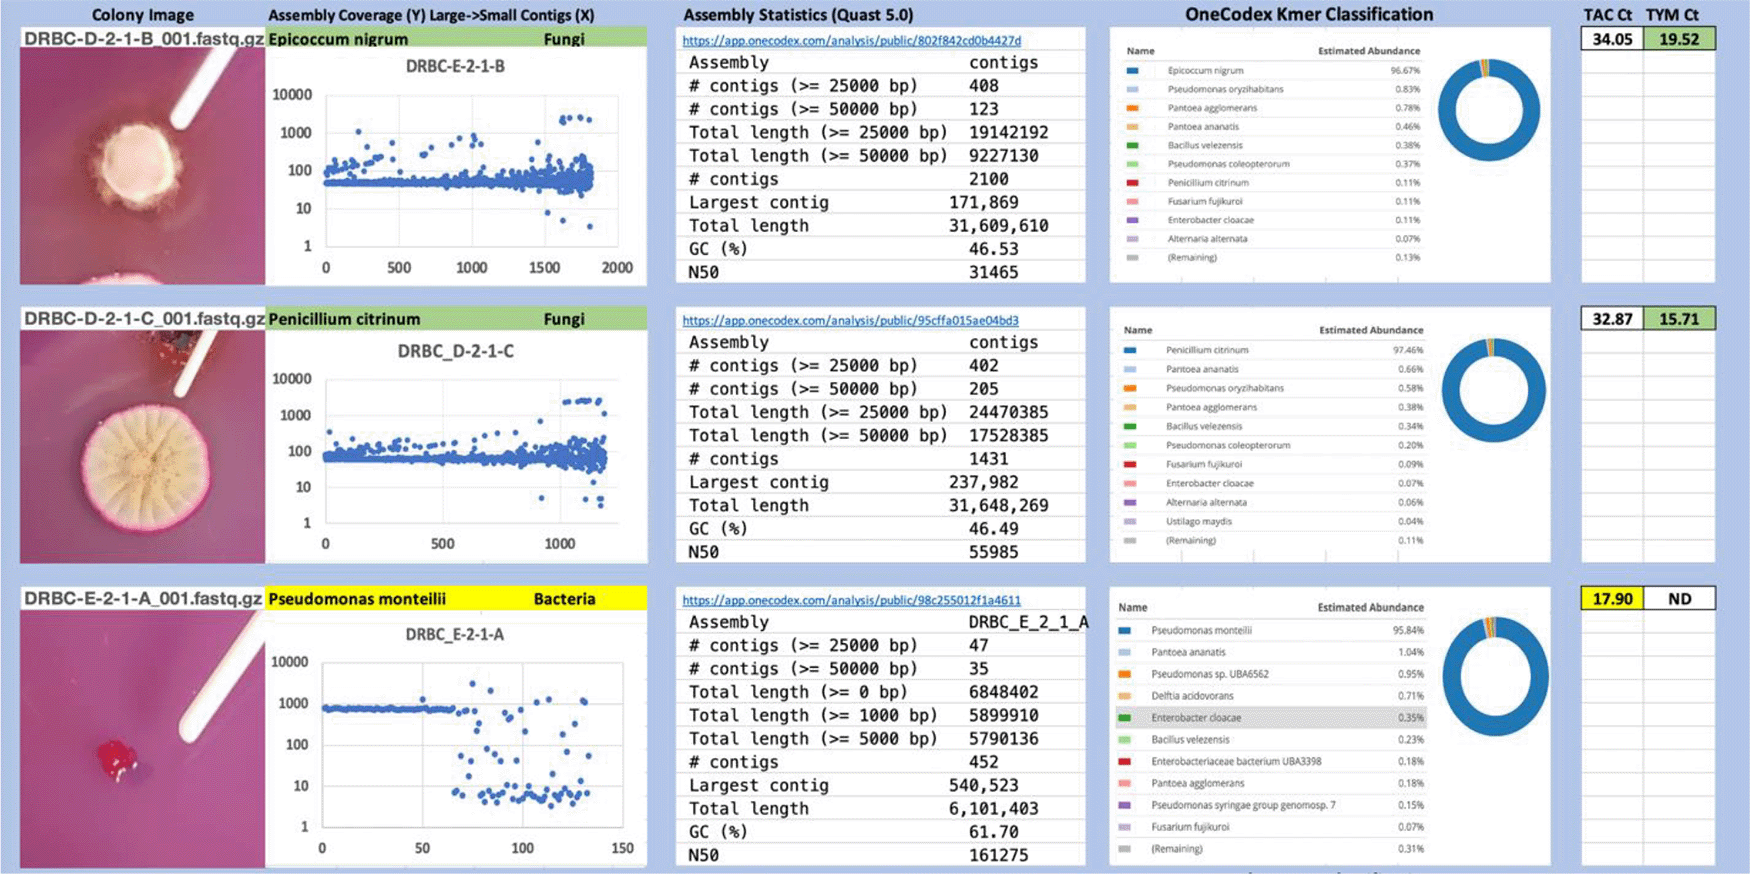
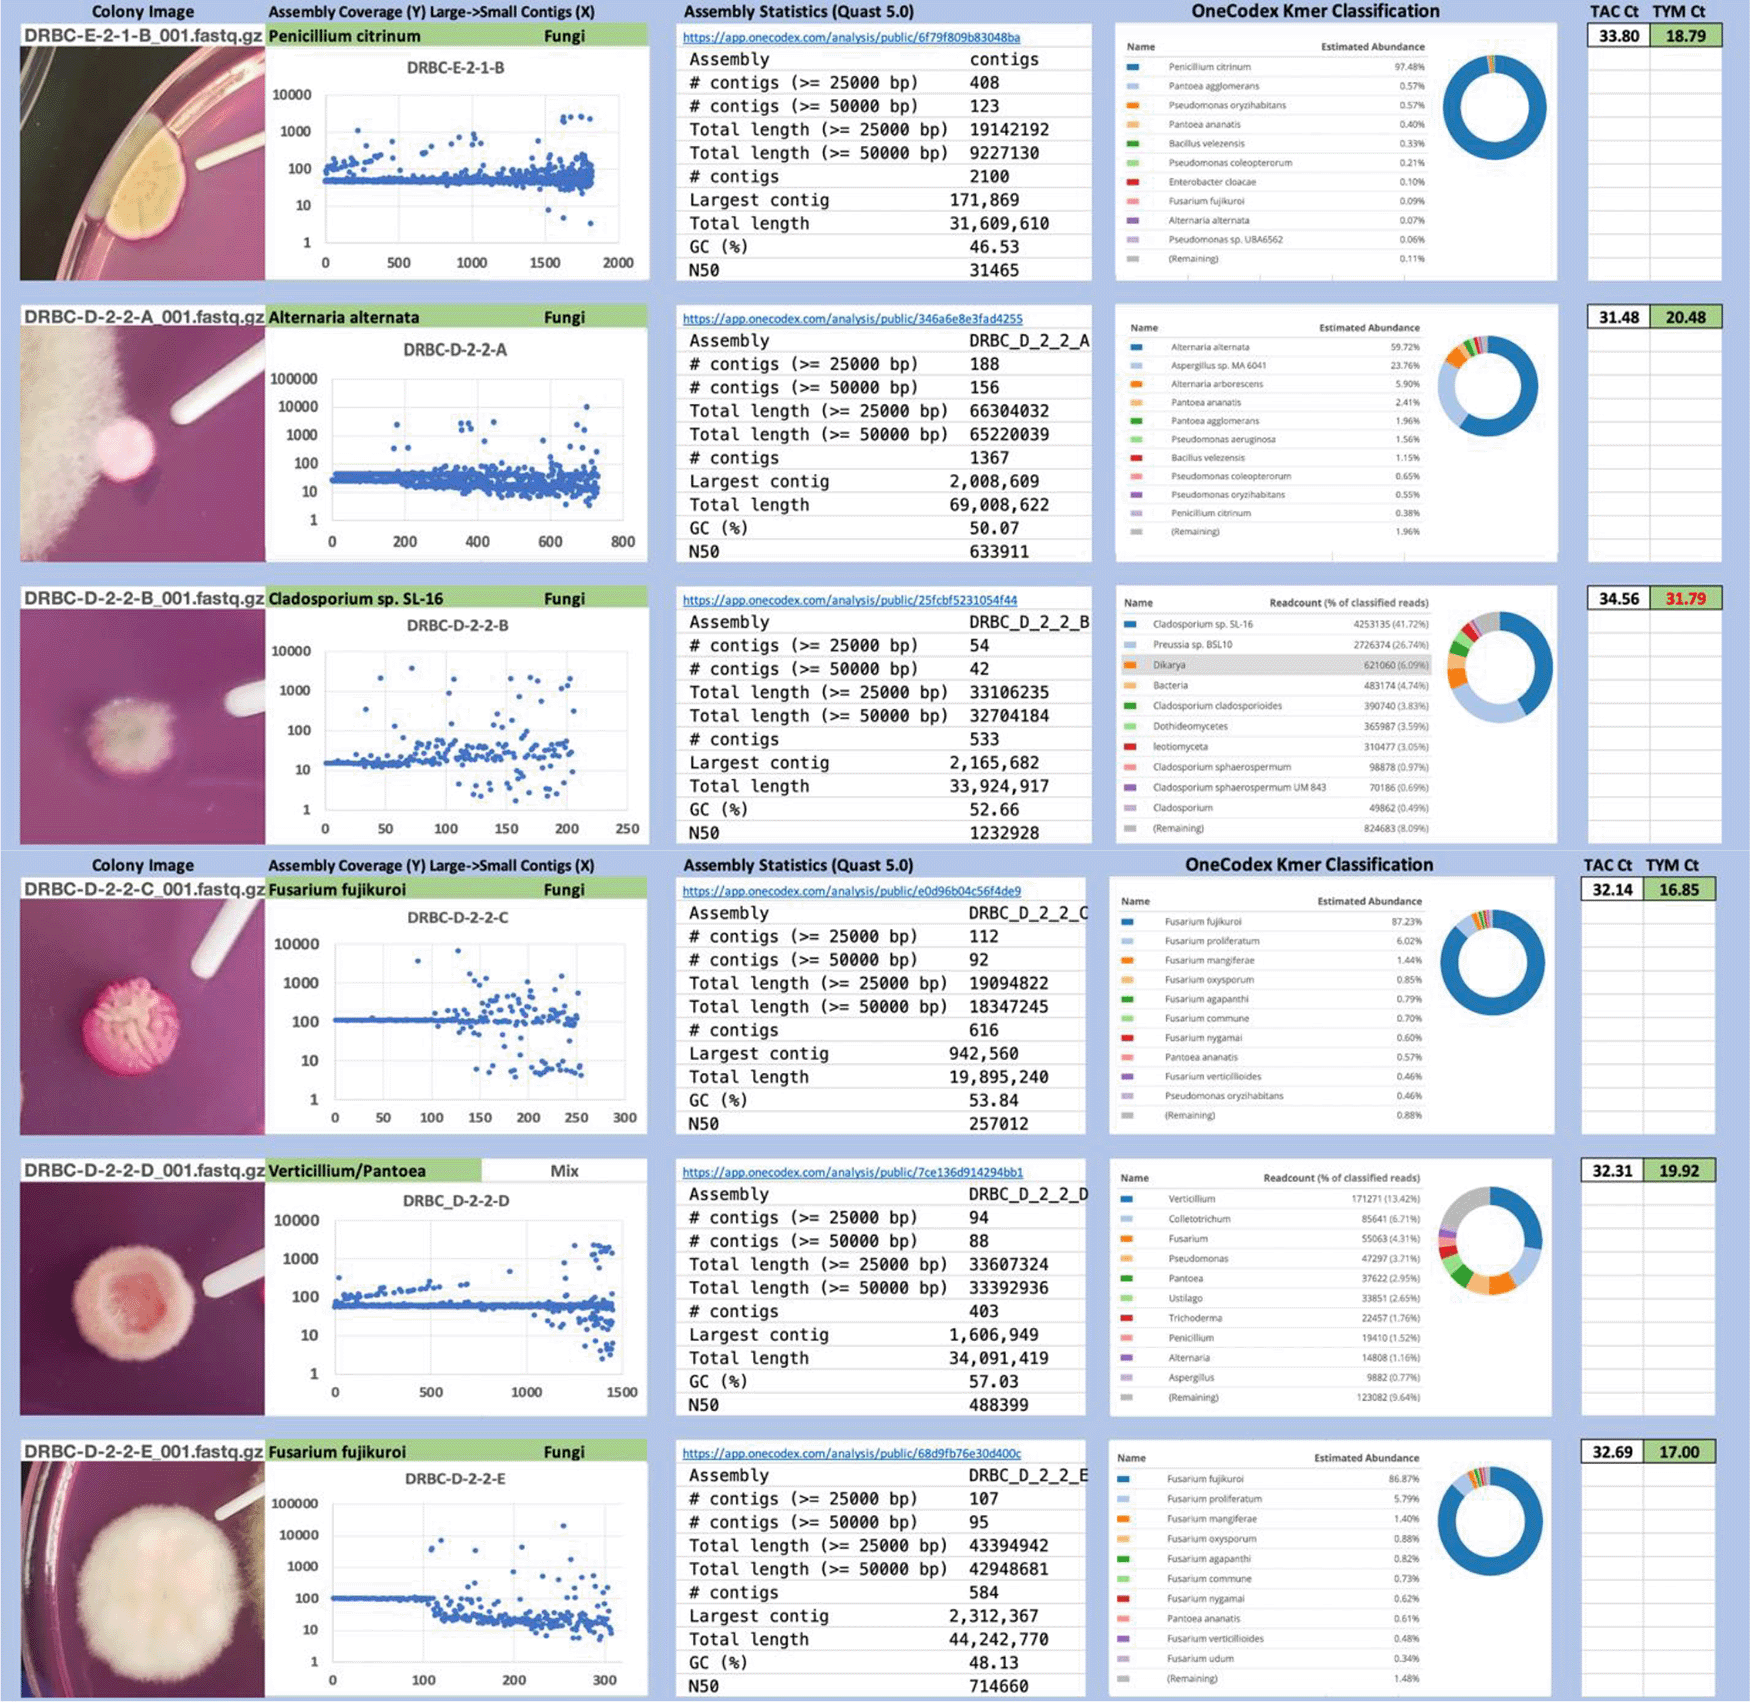
Colony Image (Left), Assembly sequence coverage (Y) compared with contig Length (X) where the contigs are sorted largest to smallest from left to right (Mid-Left). Assembly statistics calculated with Quast 5.0 (Mid Right). OneCodex speciated Kmer count (Right).
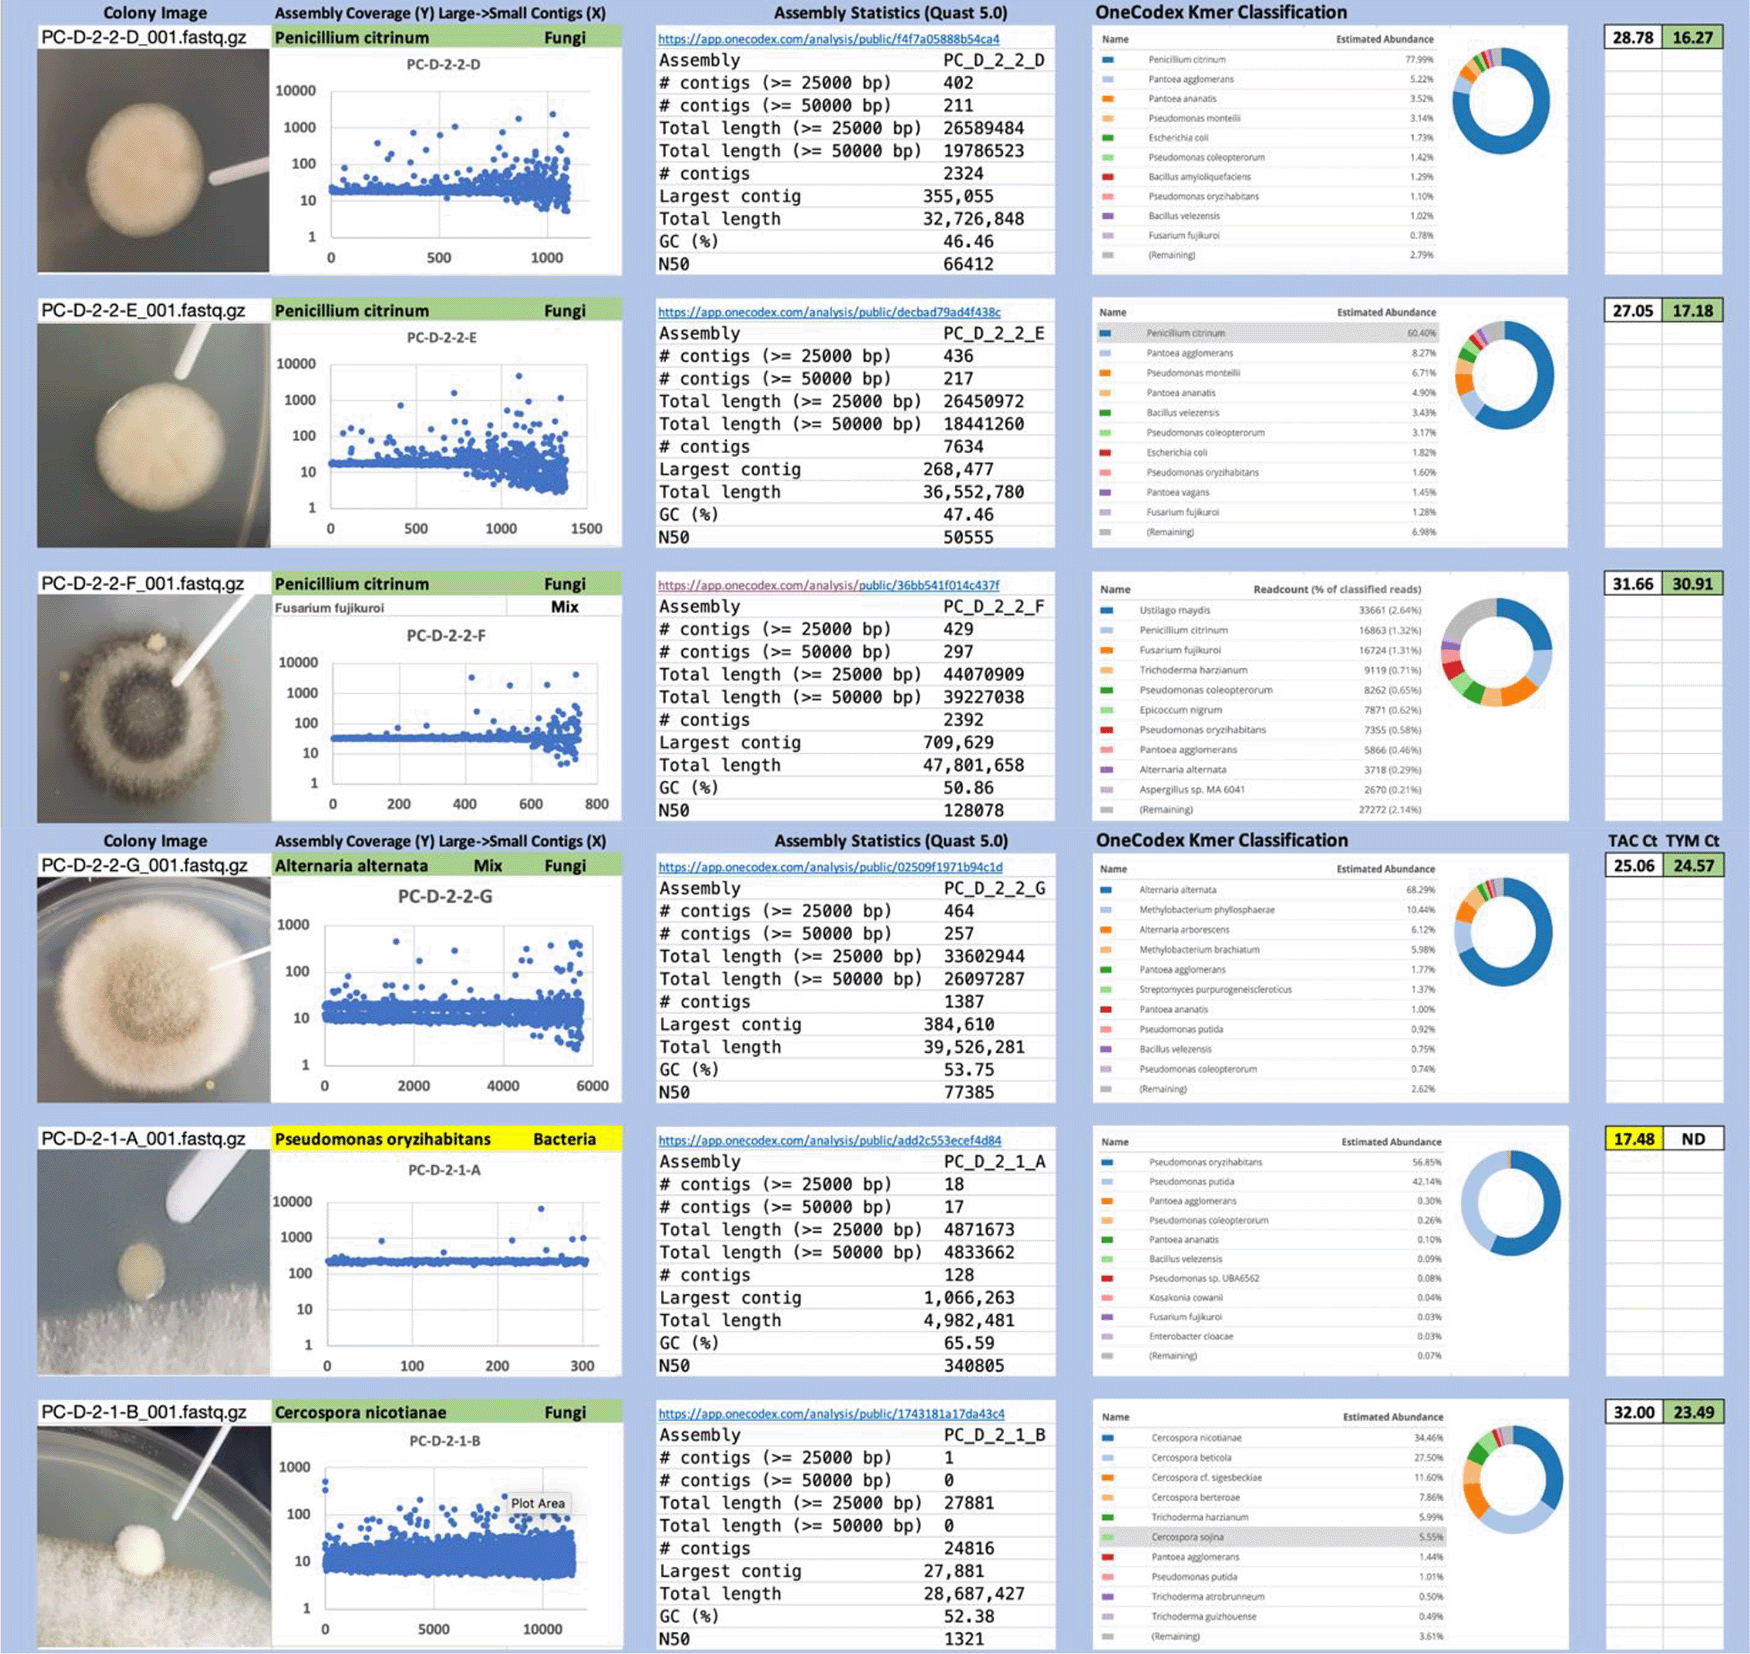
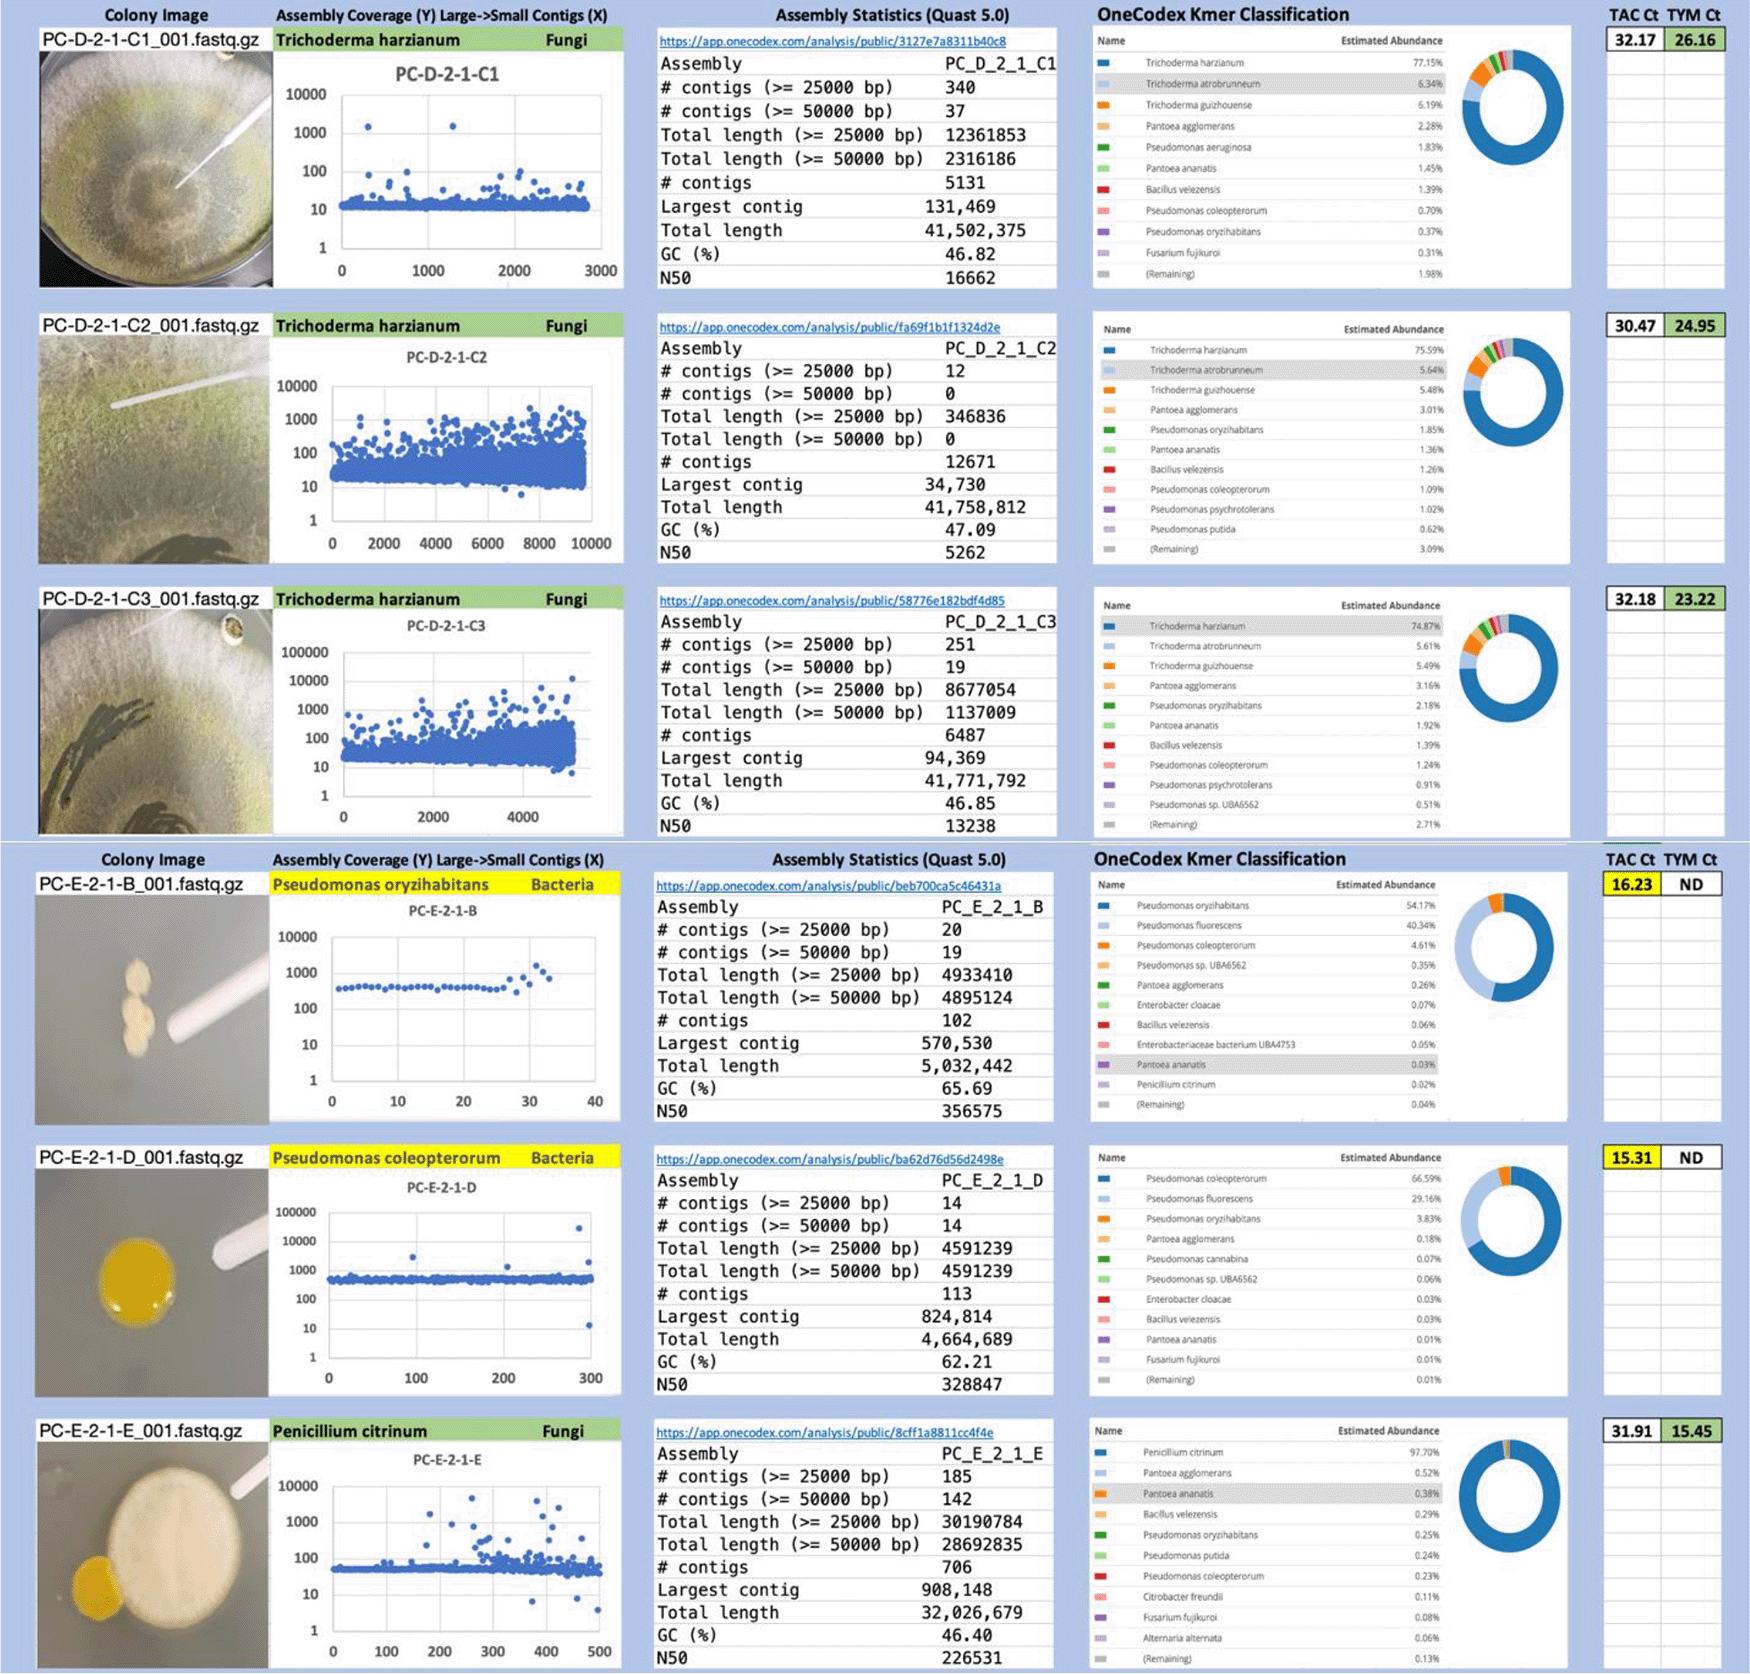
Colony Image (Left), Assembly sequence coverage (Y) compared with contig Length (X) where the contigs are sorted largest to smallest from left to right (Mid-Left). Assembly statistics calculated with Quast 5.0 (Mid Right). OneCodex speciated Kmer count (Right).
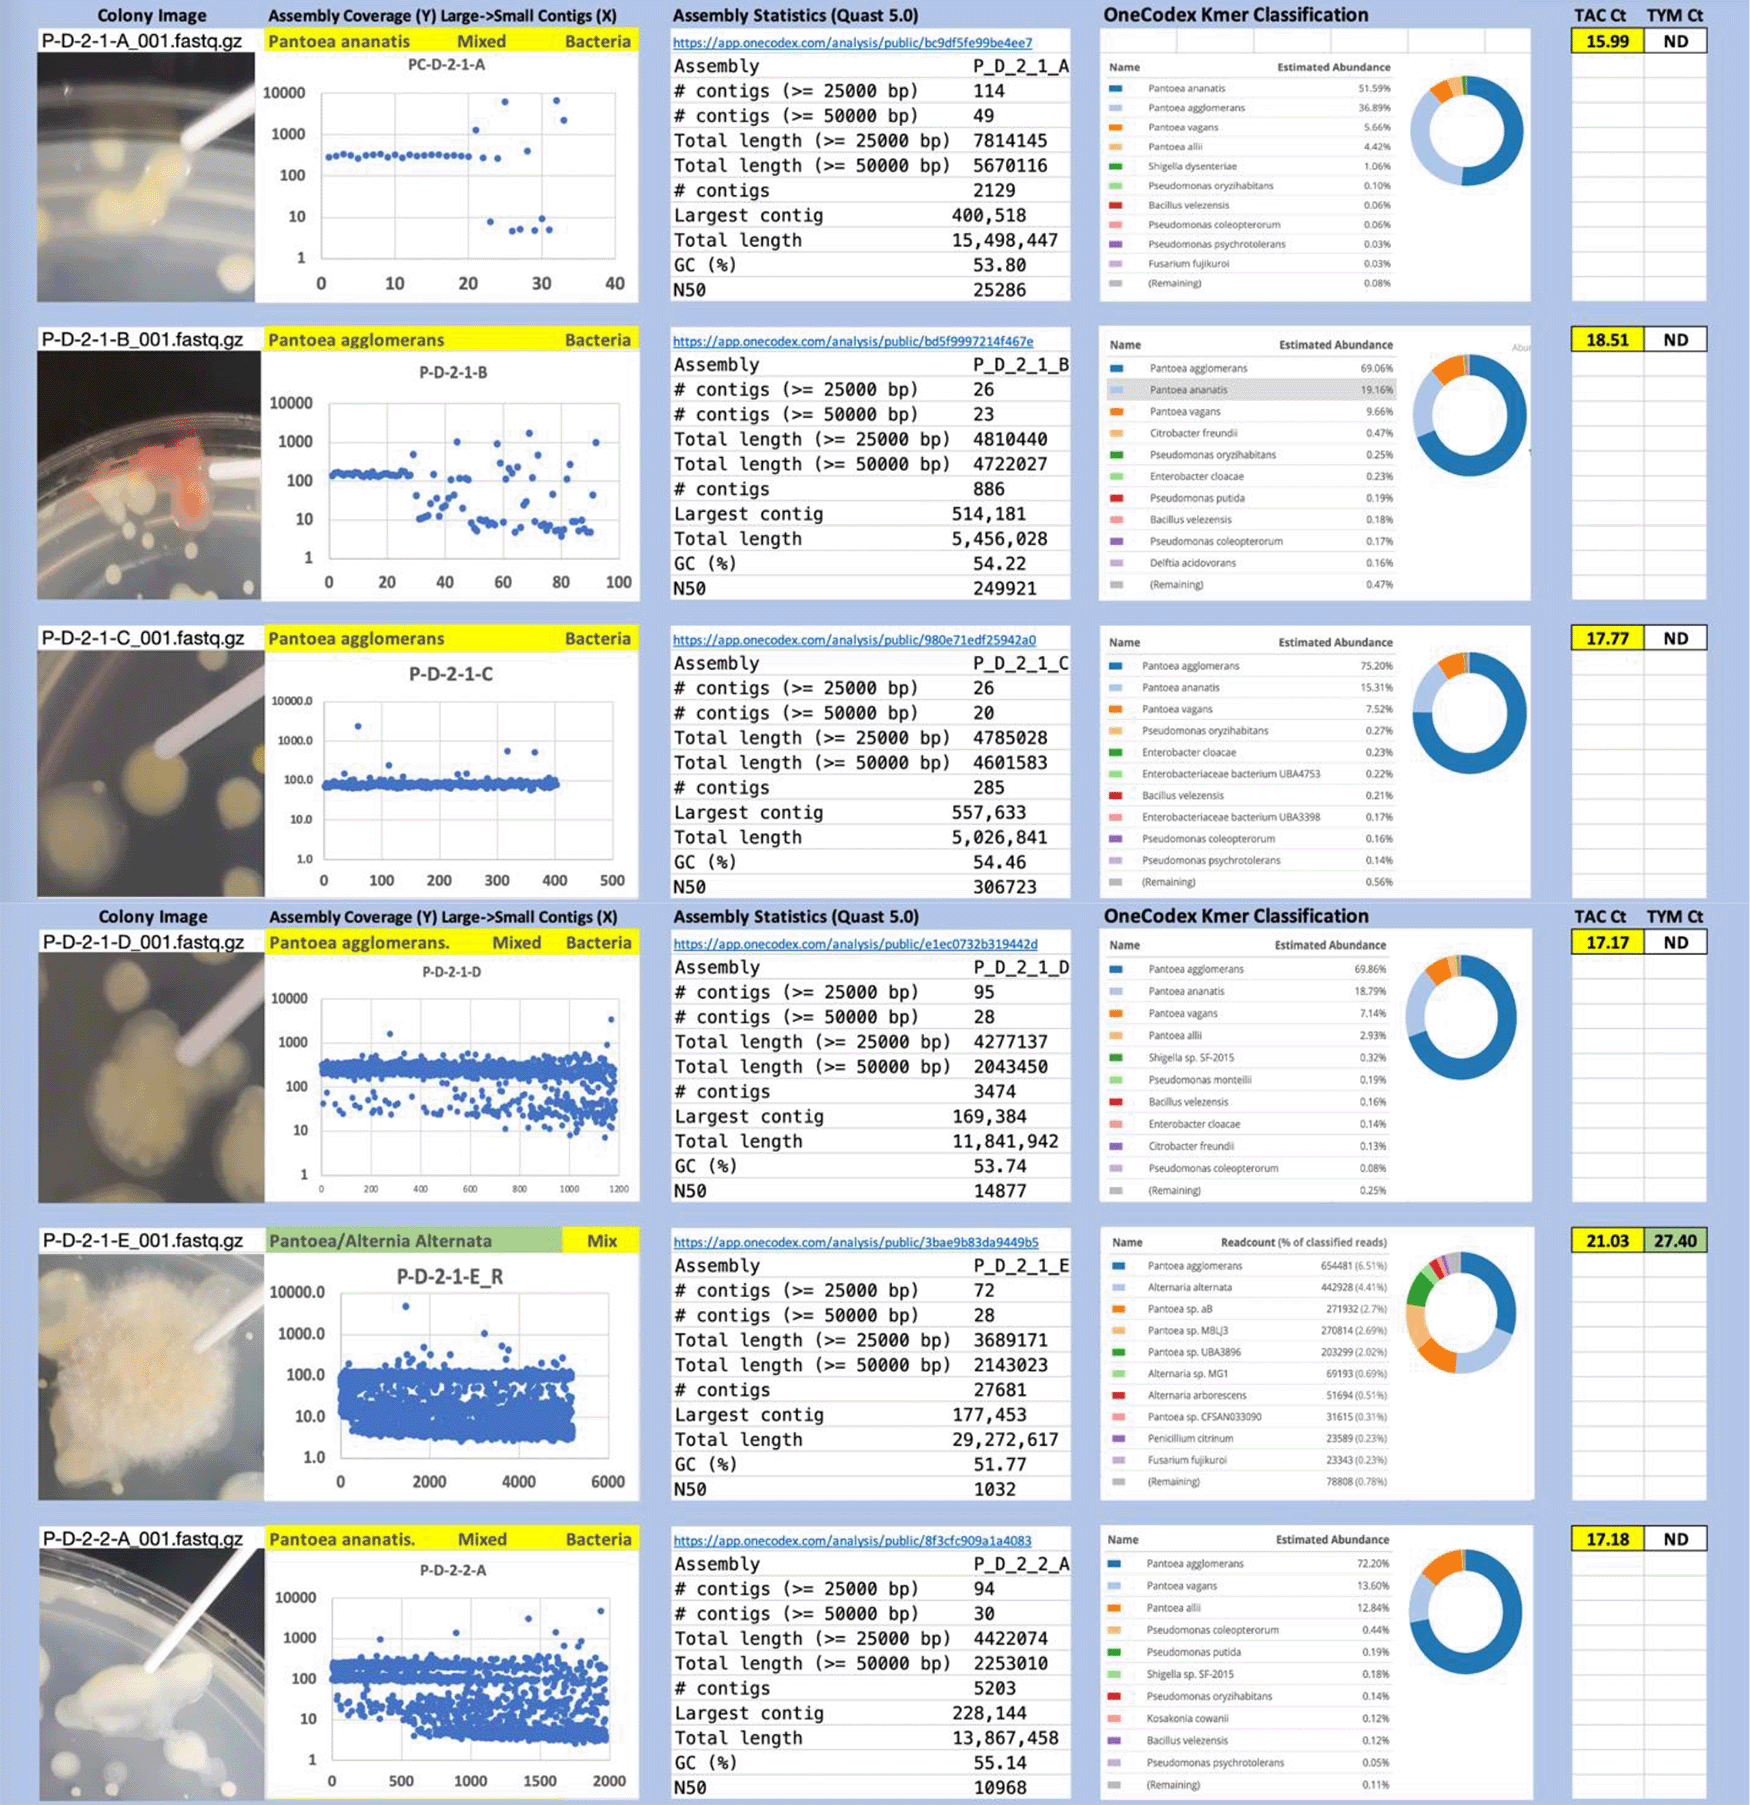
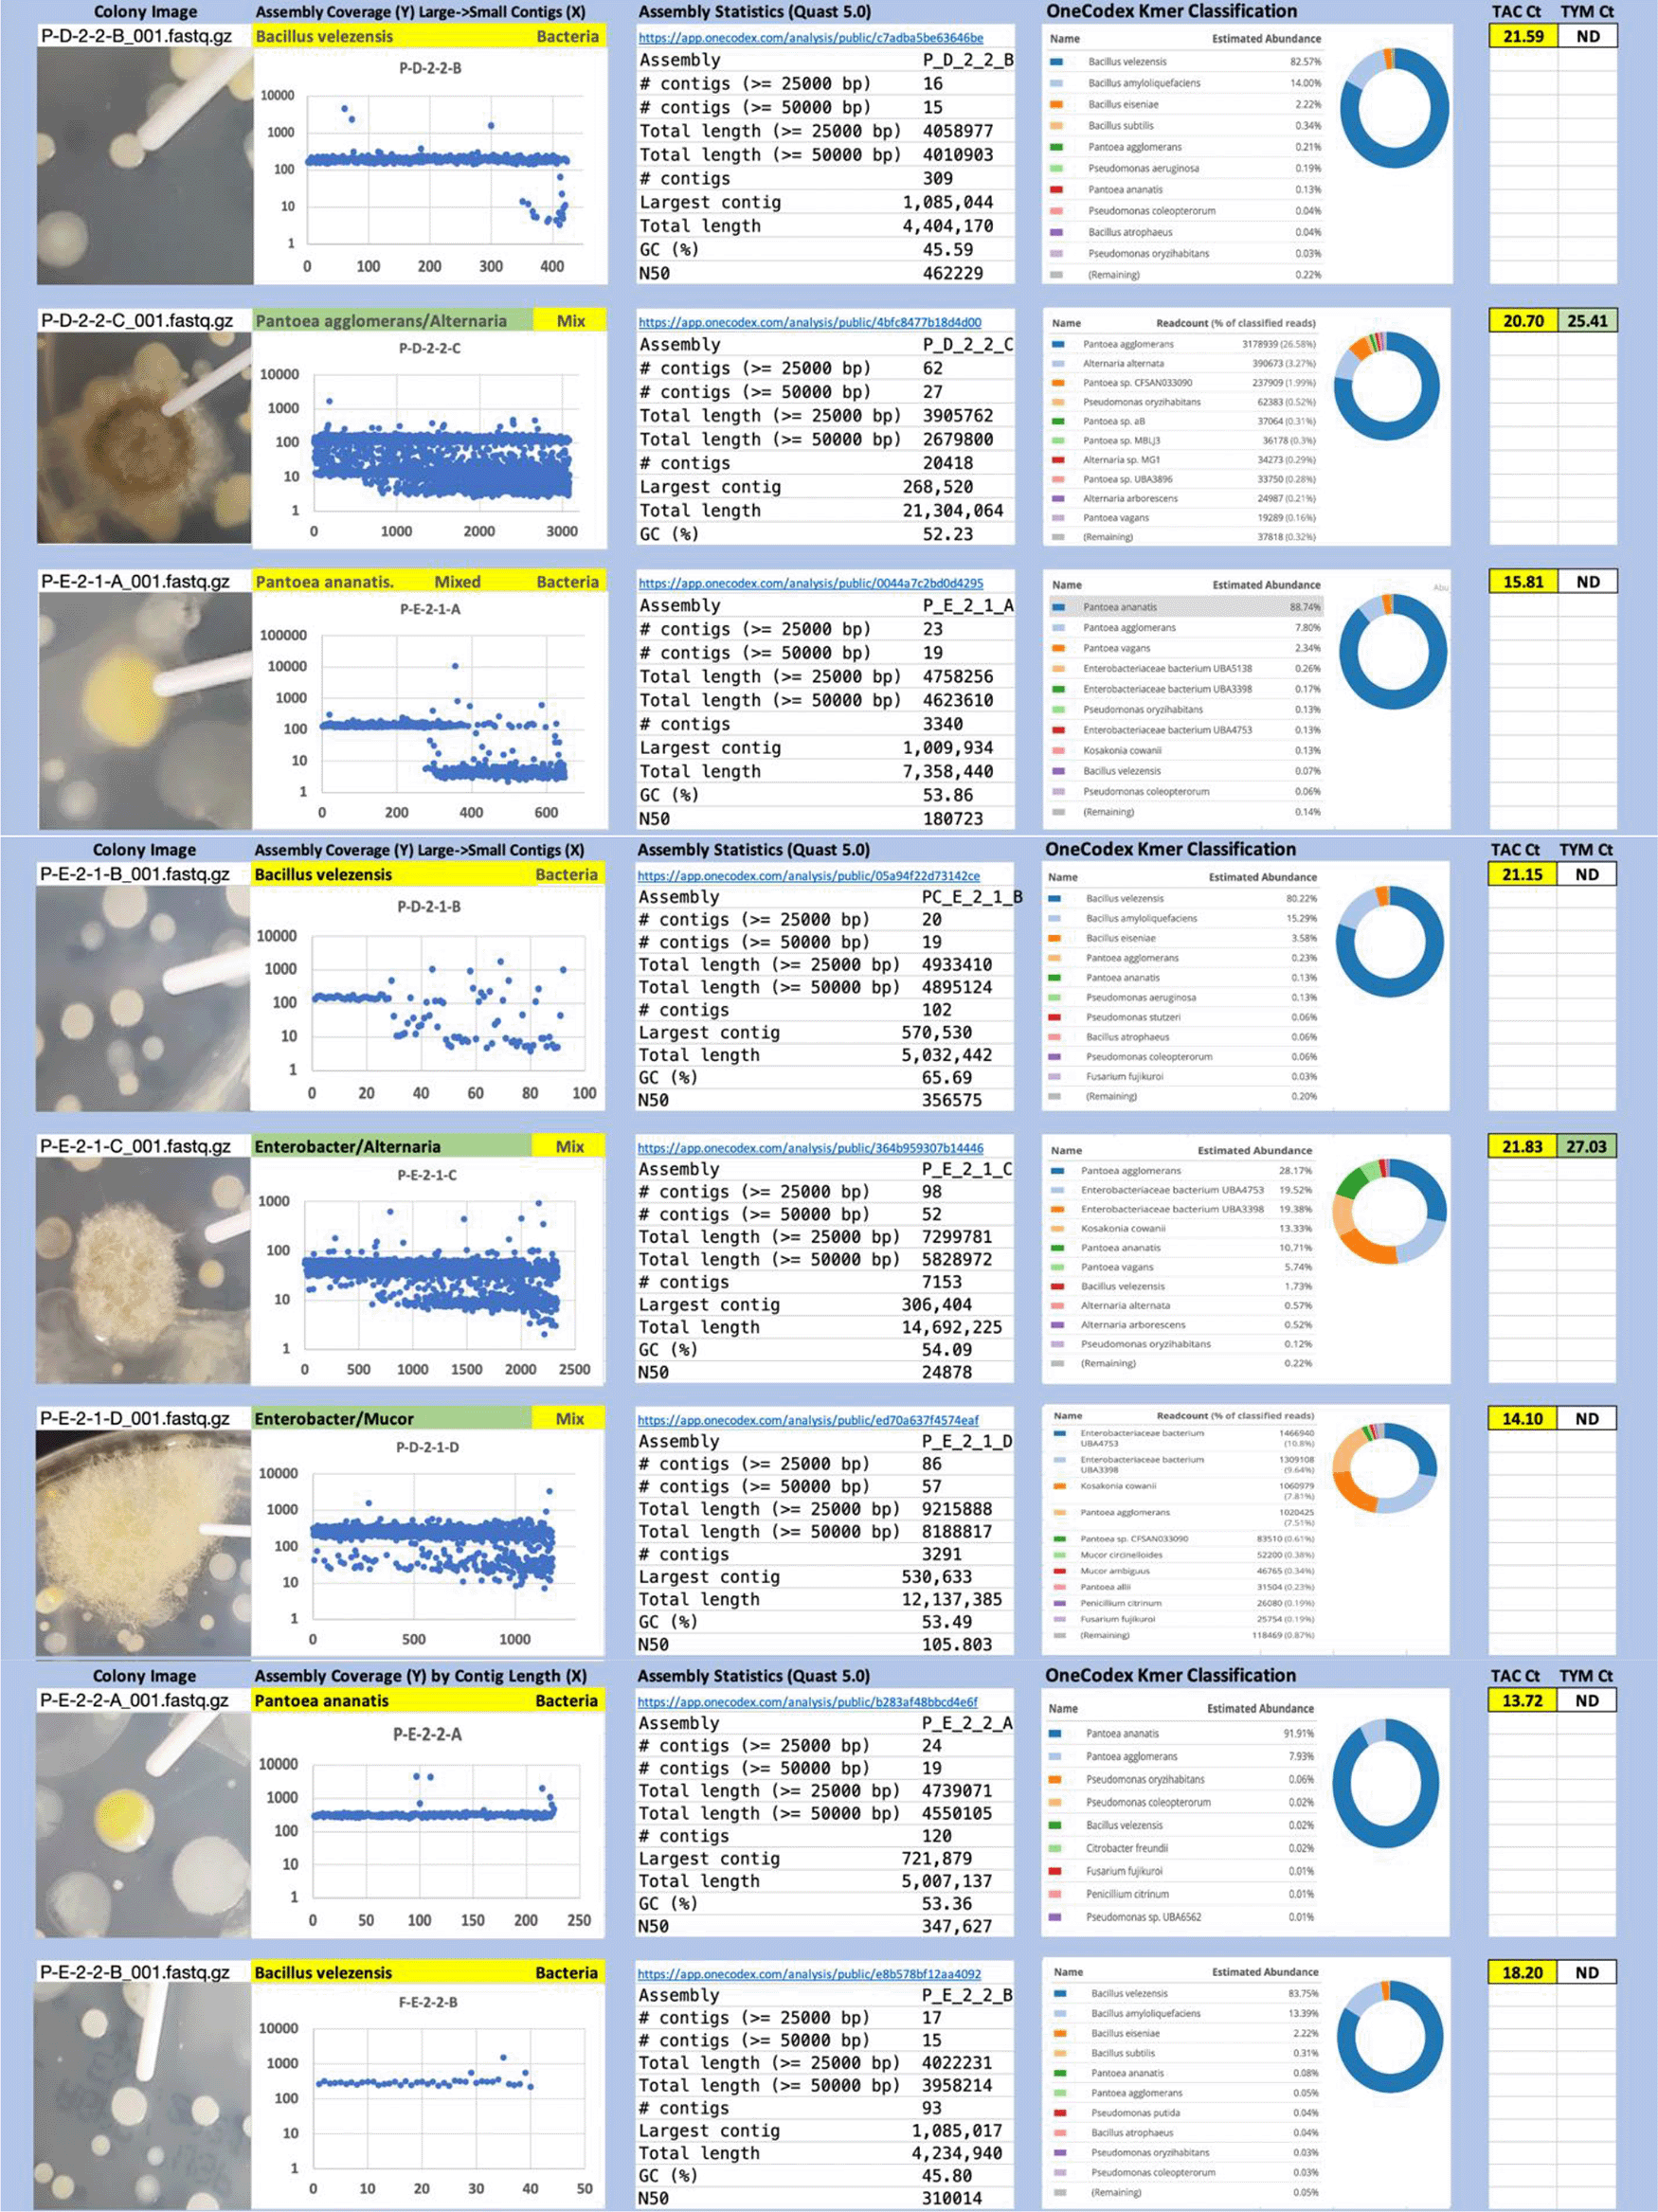
Colony Image (Left), Assembly sequence coverage (Y) compared with contig Length (X) where the contigs are sorted largest to smallest from left to right (Mid-Left). Assembly statistics calculated with Quast 5.0 (Mid Right). OneCodex speciated Kmer count (Right).
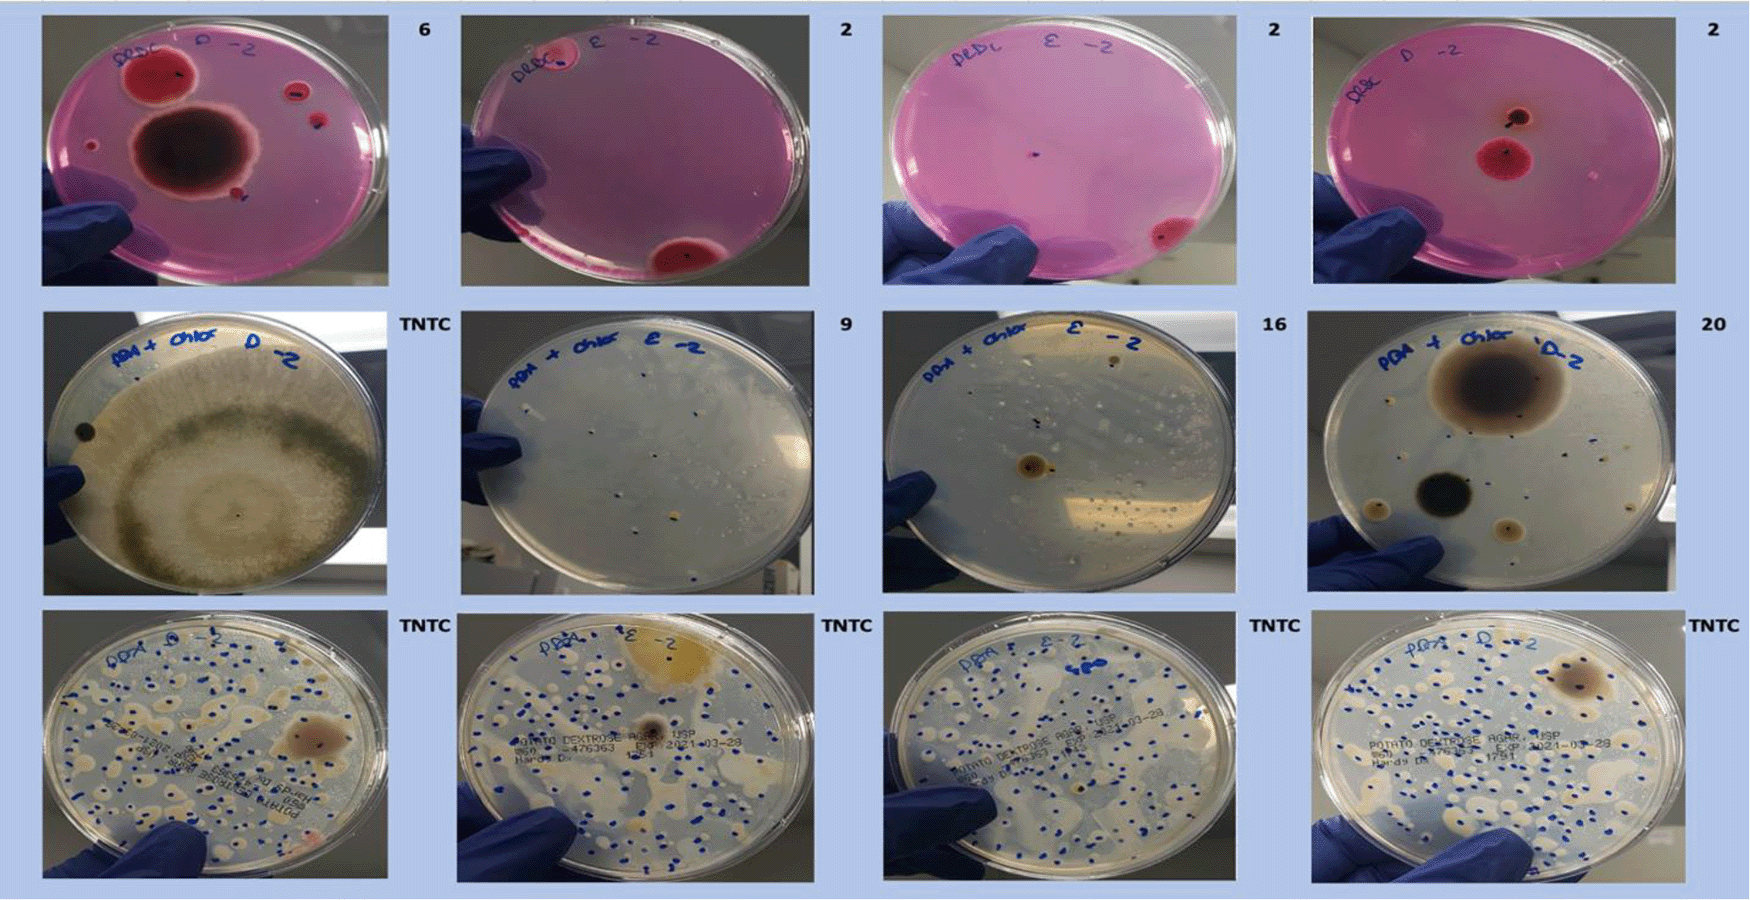
Dichloran Rose Bengal (Top). Potato Dextrose Agar with chloramphenicol (PDA – CAMP, Middle). PDA without CAMP (Bottom).
| Bacteria | Fungi | Mixed | |
|---|---|---|---|
| DRBC CAMP | 3 | 12 | 2 |
| PDA CAMP | 10 | 9 | 1 |
| PDA No CAMP | 14 | 4 | 4 |
A Simpson’s diversity index analysis demonstrated PDA with CAMP provides the highest diversity score (Figure 6) While the DRBC had 100-fold lower CFU counts than PDA without selection, it predominantly displayed fungal colonies (80%) while PDA without selection was biased toward bacteria (22%). PDA with chloramphenicol displayed more fungi (55%) than bacteria and also produced a half log more fungal colonies than DRBC with chloramphenicol (Table 2).
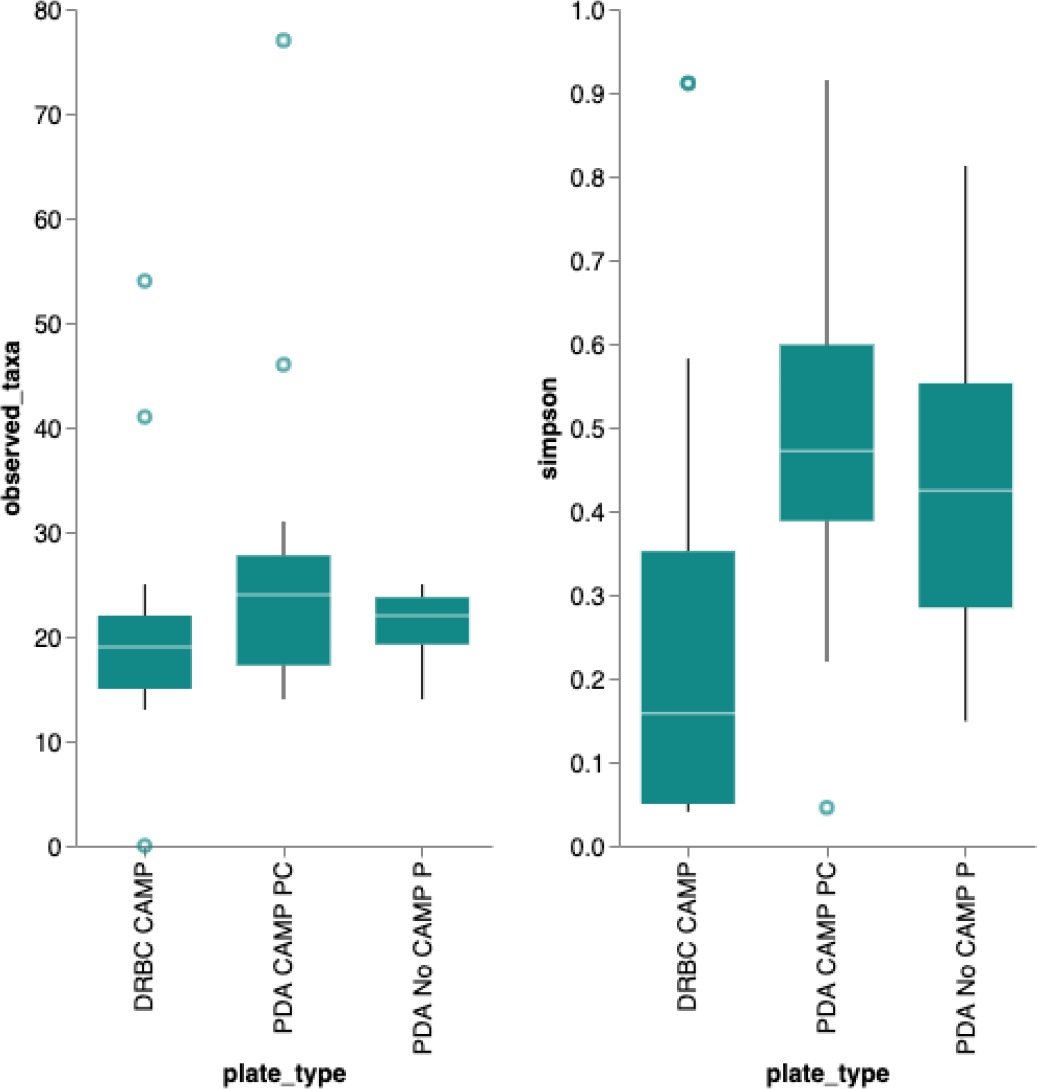
Simpson’s diversity index (https://geographyfieldwork.com/Simpson%27sDiversityIndex.htm) is used to quantify the biodiversity of a habitat on a 0 to 1 scale. It takes into account the number of species present, as well as the relative abundance of each species. A diversity index of 1 represent infinite diversity where 0 reflects no diversity. Dichloran Rose Bengal (DRBC) plating demonstrates the lowest diversity. This is not surprising given DRBC contains 3 different selection agents. While this limits bacterial contamination it also limits yeast and mold growth.
Plating on different media demonstrates a LOG scale difference in Colony Forming Units (CFU) with each plating medium. Sequencing can attribute only half of the colonies as bacteria on Potato Dextrose Agar (PDA) with chloramphenicol. This implies a 5-fold under counting of yeast and mold on Dichloran Rose Bengal (DRBC).
| Sample | DRBC | |||||
|---|---|---|---|---|---|---|
| 10-2 CFU/g | 10-2 CFU/g | 10-2 CFU/g | 10-3 CFU/g | 10-3 CFU/g | 10-3 CFU/g | |
| Low A | 0 | 4 | 1 | 1 | 0 | 0 |
| Low B | 0 | 3 | 1 | 1 | 1 | 0 |
| Low C | 2 | 1 | 0 | 0 | 0 | 0 |
| Low D | 2 | 5 | 2 | 0 | 2 | 0 |
| Low E | 2 | 0 | 2 | 0 | 0 | 0 |
| Average CFU/g | ||||||
| Sample | PDA with Chloramphenicol | |||||
|---|---|---|---|---|---|---|
| 10-2 CFU/g | 10-2 CFU/g | 10-2 CFU/g | 10-3 CFU/g | 10-3 CFU/g | 10-3 CFU/g | |
| Low A | 8 | 16 | 12 | 1 | 3 | 2 |
| Low B | 8 | 12 | 8 | 1 | 0 | 3 |
| Low C | 13 | 19 | 13 | 1 | 2 | 1 |
| Low D | 3 | 12 | 21 | 2 | 0 | 1 |
| Low E | 9 | 7 | 4 | 0 | 3 | 3 |
| Average CFU/g | ||||||
One fungal sample (Cladosporum) presented delayed Ct (31.79) with PathoSEEK Total Yeast and Mold (ITS3-TYM) qPCR primers. Scrutiny of the primer sequences against the Cladosporum genome shows proper primer binding locations but missing probe sequences. This genome has low coverage (10X) and the repetitive ITS qPCR target regions are often poorly assembled in low coverage-genomes. This may explain the missing probe sequence in the low coverage fragmented assembly. Additionally, some significantly delayed PathoSEEK Total Aerobic Count (TAC) signal was observed in fungal colonies. This is the result of the use of the lytic enzyme (TLP) which is cloned and expressed in E. coli and contains some background E.coli DNA. This background TLP expression in E. coli produces signals that can be seen in blank preparations. In some cases, this signal is elevated due to mixed colonies observed in the sequencing data.
The qPCR method represents an increased selectivity in assessing fungal and bacterial CFU compared to DRBC, where only -92% of the colonies were fungal colonies. Quantitative PCR identified all fungi and never mistook one for bacteria. In a minority of cases we had visually mixed colonies. Even if we discount the mixed colonies and count, only the single bacterial colony out of 13 on DRBC, we obtain 92% (1/13) fungal colonies on DRBC where qPCR delivered perfect results. As a comparison, quantitative PCR demonstrated over 10 Cts (1024 fold) differences between the TYM and TAC signals on fungal colonies. The majority of the residual TAC signal being observed in fungi can be normalized and discounted with the background E. coli TLP DNA signal measured in blank preparations.
To confirm these observations several Aspergillus species and Botrytis cinerea were ordered from ATCC and plated on various plating medias in absence of background cannabis matrix (Table 3 and Figure 7). In all cases DRBC showed reduced CFU counts.
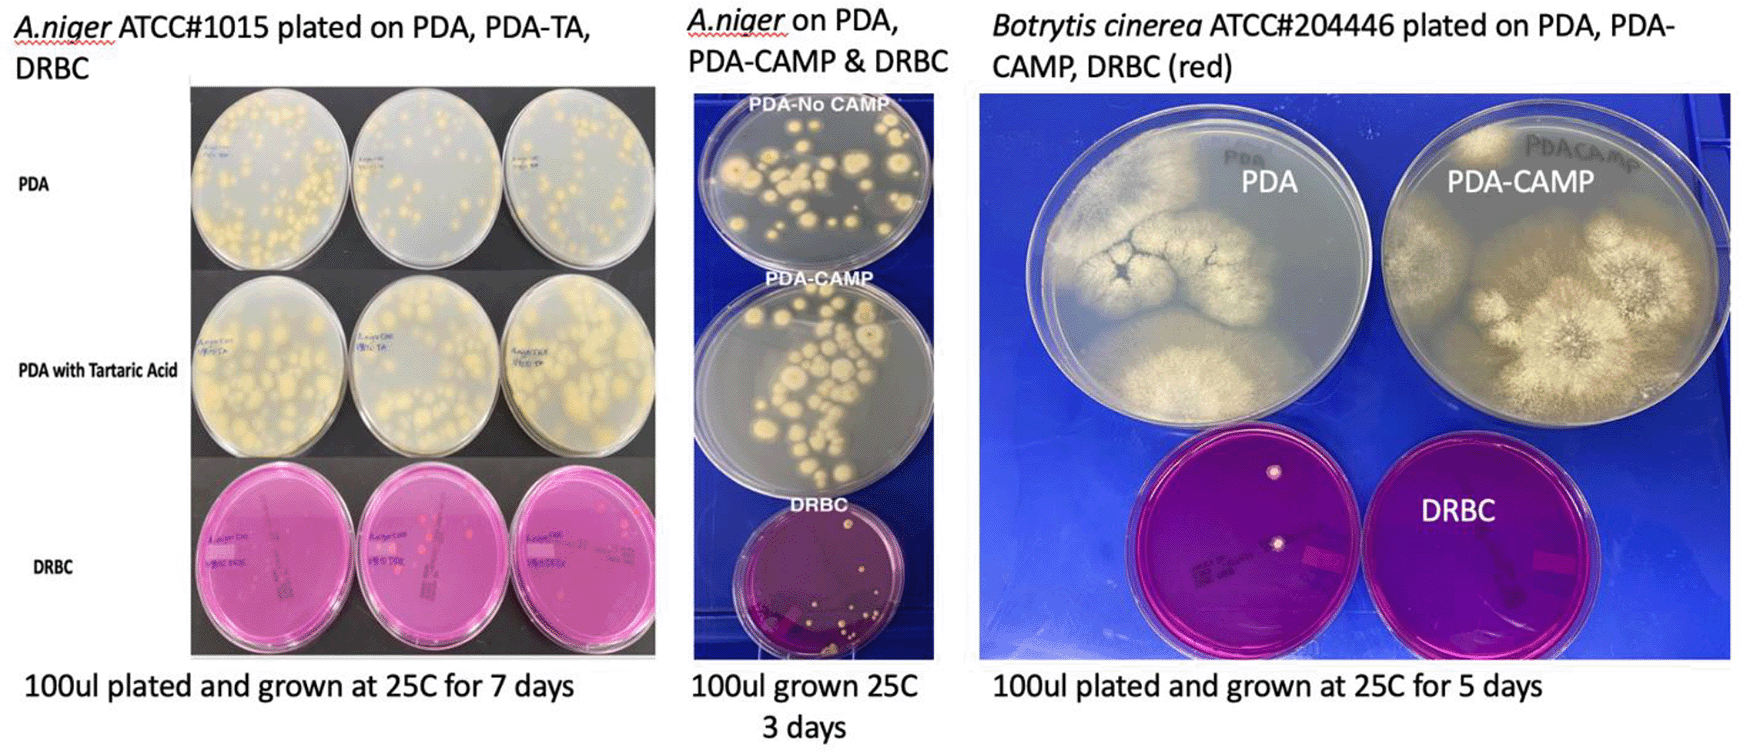
Cultures were plated on Potato Dextrose Agar (PDA), PDA with selection (chloramphenicol or Tartaric acid), and Dichloran Rose Bengal (DRBC). Fewer colonies are consistently found on DRBC.
Fungi species were ordered from American Tissue Culture Collection (ATCC) and plated on 2 different medias (PDA and DRBC) to assess growth performance of the organisms in absence of cannabis background bacteria and matrix.
Microbial media and their selection have a significant impact on the Simpson’s diversity index of microbes observed with whole genome sequencing. This has been noted in prior microbiome surveys in cannabis, in which culturing the microbes changes the representation of the microbiome as measured by qPCR and sequencing performed directly off of the flower (McKernan et al., 2015, 2016). In this study the DRBC selection reduced bacterial growth more than PDA with chloramphenicol, but also reduced the fungal CFU 5-fold in the process. This has important implications for chloramphenicol-sensitive cannabis endophytes like Aspergillus, Pythium and Fusarium. Both media types (PDA and DRBC) are referenced in the FDA Bacteriological Analytical Manual. States exclusively considering DRBC for ease of colony visualization should be aware of the species-specific sensitivities of using a single medium type, and consider species-specific testing for such pathogenic organisms, to complement a partial yeast and mold test offered from a single selection-based medium. PCR-based techniques can identify more organisms than DRBC alone as no selection is occurring given thorough cell lysis is achieved for qPCR analysis.
Plating also suffers from having a very limited dynamic range. Since it is difficult to count colonies when more than 100 colonies are present on a plate, multiple dilutions are often required to understand the full range of CFU counts one may encounter with a test which is attempting to quantify 10,000 CFUs/gram. This results in multiplying diluted CFUs 10, 100 and even a 1,000 fold to back-estimate the total CFU count. In this scenario a single colony can swing the CFU count from passing to failing (9 colonies x 1,000 fold dilution vs 10 colonies at 1,000 fold dilution). Quantitative PCR has a linear dynamic range over 5-6 orders of magnitude and no such multiplication is required. Thus, qPCR provides a more accurate itemization of actual CFUs counts.
In-vitro inclusion and exclusion testing with ITS3 qPCR on ATCC-sourced organisms demonstrated over 96% inclusion (50 yeast and mold) and zero bacterial cross reactivity (30 bacteria) (Extended data: Supplementary Table 1- Sheet TYM Inclusion & TYM Exclusion). In-silico analysis of ITS3 primer sequences, predicts over 1400 yeast and mold should amplify with the described ITS3 primer sequences. All plating media, even with three different forms of selection (DRBC), had bacterial contamination and each level of selection reduced fungal CFU counts.
NCBI Bioproject: Under Counting of Total Yeast and Mold on Cannabis using DRBC, Accession number PRJNA725256, https://www.ncbi.nlm.nih.gov/bioproject?term=PRJNA725256.
Zenodo: Whole genome sequencing of colonies derived from cannabis flowers and the impact of media selection on benchmarking total yeast and mold detection tools, https://doi.org/10.5281/zenodo.4759883 (McKernan et al., 2021).
This project contains the following extended data:
Summary Table 1: OneCodex URLs and NCBI BioSample IDs for every sample.
TYM Inclusion: ATCC organisms tested for inclusion criteria
TYM Exclusion: ATCC organisms tested for exclusion criteria
Sequencing: Number of reads, Read Pairs and Total Gigabases sequenced for each sample.
Assembly: Complete Assembly statistics for each sample generated by QUAST
Data are available under the terms of the Creative Commons Attribution 4.0 International license (CC-BY 4.0).
| Views | Downloads | |
|---|---|---|
| F1000Research | - | - |
|
PubMed Central
Data from PMC are received and updated monthly.
|
- | - |
Is the rationale for developing the new method (or application) clearly explained?
Yes
Is the description of the method technically sound?
Yes
Are sufficient details provided to allow replication of the method development and its use by others?
Yes
If any results are presented, are all the source data underlying the results available to ensure full reproducibility?
Yes
Are the conclusions about the method and its performance adequately supported by the findings presented in the article?
Yes
Competing Interests: No competing interests were disclosed.
Reviewer Expertise: microbiology, plant pathology, plant biology, cannabis pathogens, post-harvest quality
Is the rationale for developing the new method (or application) clearly explained?
Yes
Is the description of the method technically sound?
Yes
Are sufficient details provided to allow replication of the method development and its use by others?
Yes
If any results are presented, are all the source data underlying the results available to ensure full reproducibility?
Yes
Are the conclusions about the method and its performance adequately supported by the findings presented in the article?
Yes
Competing Interests: No competing interests were disclosed.
Reviewer Expertise: plant microbiology; cannabis analytical testing; diagnostics
Alongside their report, reviewers assign a status to the article:
| Invited Reviewers | ||
|---|---|---|
| 1 | 2 | |
|
Version 2 (revision) 12 Aug 21 |
read | |
|
Version 1 21 Jul 21 |
read | read |
Provide sufficient details of any financial or non-financial competing interests to enable users to assess whether your comments might lead a reasonable person to question your impartiality. Consider the following examples, but note that this is not an exhaustive list:
Sign up for content alerts and receive a weekly or monthly email with all newly published articles
Already registered? Sign in
The email address should be the one you originally registered with F1000.
You registered with F1000 via Google, so we cannot reset your password.
To sign in, please click here.
If you still need help with your Google account password, please click here.
You registered with F1000 via Facebook, so we cannot reset your password.
To sign in, please click here.
If you still need help with your Facebook account password, please click here.
If your email address is registered with us, we will email you instructions to reset your password.
If you think you should have received this email but it has not arrived, please check your spam filters and/or contact for further assistance.
Comments on this article Comments (0)