Keywords
microrna, Cancer, miRNA-mRNA Network, CCLE, TCGA
This article is included in the Oncology gateway.
microrna, Cancer, miRNA-mRNA Network, CCLE, TCGA
MicroRNAs (miRNAs) are endogenous, small non-coding RNAs that function in the post-transcriptional regulation of gene expression.1 Using the seed region, the mature miRNAs bind to the 3′ untranslated region (UTR) of the mRNAs via complementary base-pairing and suppress the expression of the targeted genes.2,3 Recently, miRNA has been found to be heavily dysregulated in cancer cells by functioning as either tumor suppressor or oncogenes.4,5 Many investigations suggest that abnormal miRNA expression levels could be used for diagnostic and prognostic biomarkers for lung, prostate, or breast cancers.6–8 Also, the usage of miRNAs as potential therapeutic targets has been shown to be promising in many cancer types.9–11
Recent progress in high-throughput sequencing technology has offered researchers unprecedented opportunities to understand the molecular mechanism of cancer. The Cancer Genome Atlas (TCGA) collects molecular profiling of primary tumors of over 11,000 tumor samples and provides real-world cancer patient information.12 On the other hand, the Cancer Cell Line Encyclopedia (CCLE) characterize of around 1,000 human cancer cell lines for in vivo studies.12,13 Both datasets span across several tumor types and contain multi-omics sequencing data. A comparison between them can provide knowledge about the differences between the two sets and capture how well each cell line represents a specific type of primary tumor. K Yu et al. have previously conducted a pan-cancer comparison between TCGA and CCLE.14 Specifically, they used correlation analysis and gene set enrichment analysis (GSEA) to identify differences between cell lines and primary tumors and found that there is a strong correlation between TCGA and CCLE samples for each tumor type and that tumor purity is a main driving factor of cell line and primary tumor differences. They also identified cell lines representative of primary tumor samples in TCGA. While this study offered a comprehensive comparison of the gene expression profiles between TCGA and CCLE, whether miRNA expression differs between the two data sources is still yet unclear. Here, we seek to use similar correlation analysis to evaluate the concordance of miRNA expression profiles between TCGA and CCLE datasets.
We first obtained respective datasets and mapped miRNAs from TCGA to CCLE to provide consistency between cell lines and primary tumors. For both datasets, technical confounders were adjusted, as well as tumor purities, and the distribution of cell lines or tumor samples were visualized using the distribution in each dataset using t-distributed stochastic neighbor embedding (t-SNE). Then, we performed correlation analysis to evaluate the similarity between cancer cell line models and human primary cancer samples based on miRNA expression profiles. We found that the cell-type composition of cancer samples and the nature of cancer greatly affect the correlation strengths. Also, through studying the expression of miRNAs related to the hallmarks of cancer pathways, we found immune-related pathways were among the most differential expressed pathways between CCLE and TCGA. Lastly, we investigated whether the miRNA–mRNA regulatory networks in the human cancer samples could be accurately captured by the cell line models.
CCLE miRNA count matrix and the cell line annotations were downloaded from the CCLE Broad Institute data portal.15 The current version of CCLE data contains 954 cell lines across 31 tumor types based on TCGA cancer code, among which 258 were labeled as “NA” or “Unable to classify”. The miRNA expression data, as well as the clinical information of each TCGA sample, were downloaded from the GDC data portal using R package TCGAbiolinks, containing 11,082 samples across 32 tumor types.16 Due to the different sequencing technology, much more unique miRNA could be identified in TCGA comparing to CCLE. Thus, we first unified the miRNAs identified in two datasets by summing all raw miRNA counts in TCGA that correspond to a specific CCLE miRNA ID within each sample. Identical mature miRNA reads from different precursors at different genomic locations (eg, hsa-miR-1-1 and hsa-miR-1-2) were also summed in TCGA to match with CCLE (eg, hsa-miR-1), if no exact matching was found in CCLE. Also, for miRNA that is characterized as precursor in CCLE (lacking the -3p or -5p information) but as mature miRNA in TCGA, the corresponding mature miRNA reads from different precursors were summed in TCGA to match CCLE. Next, the counts were normalized using the trimmed mean of M values (TMM) and had log2 counts per million computed using EdgeR.17 MiRNA with an interquartile range equal to zero or a sum across samples equal or less than one was excluded.
Then, since TCGA was sequenced on two different sequencing platforms, namely, 9,411 samples using HiSeq and 1,413 using GA (with 258 unannotated samples dropped), batch correction was done to eliminate differences caused by the difference of platforms using ComBat.18 Finally, as tumor purity has been proven to be a significant confounder in transcriptomic data of primary tumors by K Yu et al, TCGA miRNA expression profiles were additionally adjusted for their tumor purity scores using limma.19 Tumor sample purity scores calculated using the ABSOLUTE20 method were obtained from the TCGA PanCanAtlas website . 1,126 batch-corrected samples without tumor purity measurements were discarded, leaving 9,698 samples.
TCGA and CCLE expression profiles consisted of the 327 miRNAs that passed the quality control. A Spearman correlation coefficient was calculated between each TCGA sample and CCLE cell line with the 327 miRNAs that passed the quality control in both datasets, resulting in a correlation matrix of 954 cell lines by 9,698 human tumor samples. The correlation coefficients were then Fisher-Z transformed and arranged with a hierarchical clustering by the cancer types of CCLE. Further, the coefficients obtained from correlation comparing CCLE to TCGA expression adjusted for tumor purity and not adjusted for tumor purity were compared using two-group t-test.
In the meantime, the correlation matrices between CCLE and TCGA based on gene expression were obtained from the github repository from K Yu et al.14 Then, the correlation coefficients between each cell line and TCGA of the same tumor type based on miRNA expression profiles were compared to that from mRNA expression profiles using Spearman correlation.
The miRNA set associated with either upregulation or downregulation of these hallmarks for cancer pathways were obtained from A Dhawan, et al.4 For each pathway, single-sample gene set enrichment analysis (ssGSEA) was used to summarize the miRNA expression in CCLE, and both adjusted and unadjusted TCGA. Afterward, the GSVA scores were compared between CCLE and TCGA, and between tumor purity adjusted and unadjusted TCGA samples using a two-group t-test.
There are very few cell lines included in CCLE for several certain types of cancer. Also, it is less appealing to study the miRNA–mRNA network when the expression level correlation is low between CCLE and TCGA. Thus, to increase the validity of network analysis based on miRNA–mRNA correlation, we first filtered the cancer type and cell lines based on sample size and miRNA expression level correlation strength. Among the 22 overlapping cancer types between CCLE and TCGA, seven tumor types with 30 or more cell lines strongly correlated (r ≥ 0.45) with TCGA (LUAD, COAD/READ, BRCA, SKCM, STAD, HNSC, SARC) were chosen for miRNA–mRNA network analysis.
For each cancer type, the Pearson correlations between each miRNA and mRNA expression levels were calculated for CCLE cell lines or TCGA primary tumor samples. Then, each negative and statistically significant (FDR < 0.05) correlation was retained to form an edge in the constructed miRNA–mRNA correlation network. For each cancer type, the miRNA-mRNA network was constructed within CCLE and for TCGA samples separately. The intersection between the resulted correlation network and the TargetScan21 predicted target network is taken to construct a regulatory network from miRNA to mRNA.
For each cancer type, the degree distributions of miRNAs of both CCLE and TCGA were calculated. Hub scores of all miRNAs and the correlation between the hub scores from CCLE and TCGA were obtained. Further, the hamming distance between networks of CCLE and TCGA was calculated for each cancer type.
To prioritize miRNA based on the target gene conservation, we compare the overlaps between the connected gene for each miRNA in the CCLE and the TCGA network for each cancer type. Using a one-tailed Fisher’s exact test, the significance of the overlap between targets of CCLE and TCGA as FDR was calculated.
All code for data processing and analysis is available at https://github.com/hanwenzhu/mir-tcga-ccle-paper.22
The TCGA miRNA data were sequenced via small-RNA sequencing, while Nanostring platform was used for CCLE. To avoid the confounding caused by the two drastically different platforms, we processed and normalized the two datasets separately and only compared the relative miRNA expression rather than the absolute expression level. MiRNA counts from 954 cell lines across 31 tumor types from CCLE and from 11,082 samples across 32 tumor types from TCGA remained after processing (Figure 1 and Extended Table 1). Note that there were significantly more samples in TCGA than in CCLE. A significant portion of the CCLE lacked specific annotation of tumor type in the format of TCGA disease code (“NA” or “Unable to classify”), which were excluded for the correlation analysis later on. Overall, the number of samples of each tumor type varied by a lot in TCGA, with multiple types from either dataset having less than 10 samples, such as GBM, which had only five samples. Also, the number of BRCA tumors was the highest and was much greater than any other type in TCGA.
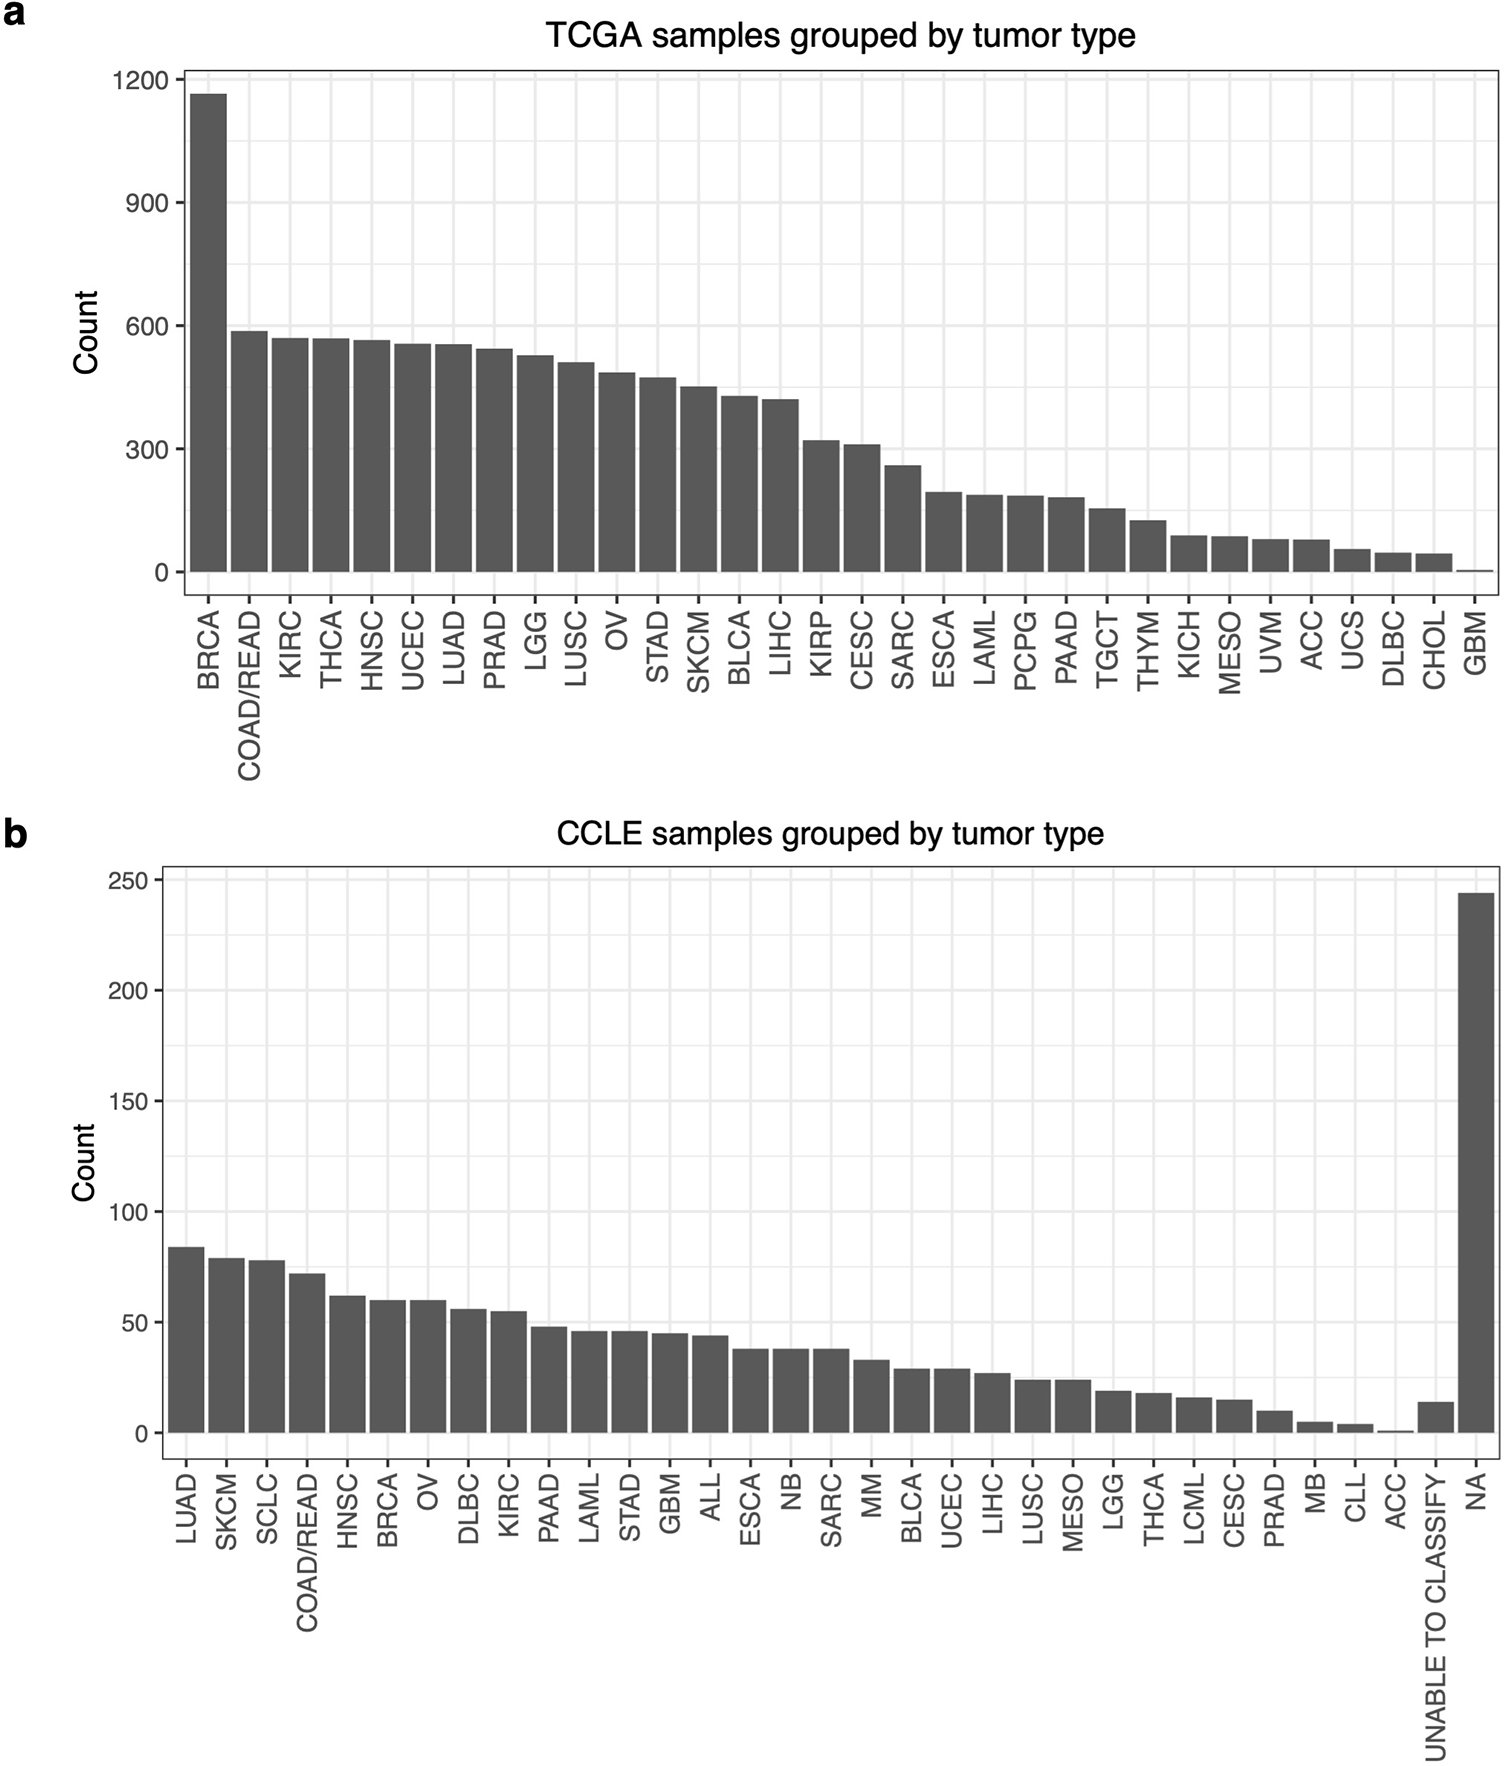
The COAD and READ were merged in TCGA to match the classification used in CCLE. (a) The number of samples by tumor type in the TCGA data. (b) The number of cell lines by TCGA tumor type in the CCLE data. BRCA, breast invasive carcinoma; COAD/READ, colorectal adenocarcinoma; KIRC, kidney renal clear cell carcinoma; THCA, thyroid carcinoma; HNSC, head and neck squamous cell carcinoma; UCEC, uterine corpus endometrial carcinoma; LUAD, lung adenocarcinoma; PRAD, prostate adenocarcinoma; LGG, brain lower grade glioma; LUSC, lung squamous cell carcinoma; OV, ovarian serous cystadenocarcinoma; STAD, stomach adenocarcinoma; SKCM, skin cutaneous melanoma; BLCA, bladder urothelial carcinoma; LIHC, liver hepatocellular carcinoma; KIRP, kidney renal papillary cell carcinoma; CESC, cervical squamous cell carcinoma and endocervical adenocarcinoma; SARC, sarcoma; ESCA, esophageal carcinoma; LAML, acute myeloid leukemia; PCPG, pheochromocytoma and paraganglioma; PAAD, pancreatic adenocarcinoma; TGCT, testicular germ cell tumors; THYM, thymoma; KICH, kidney chromophobe; MESO, mesothelioma; UVM, uveal melanoma; ACC, adrenocortical carcinoma; UCS, uterine carcinosarcoma; DLBC, lymphoid neoplasm diffuse large B-cell lymphoma; CHOL, cholangiocarcinoma; GBM, glioblastoma multiforme; ALL, acute lymphocytic leukemia; NB, neuroblastoma; MM, multiple myeloma; LCML, chronic myelogenous leukemia; MB, medulloblastoma; CLL, chronic lymphocytic leukemia.
While the cell lines of each tumor type in the CCLE did not form perfectly distinct clusters by themselves, we did observe two large separate clusters (Figure 2). The lower cluster consisted of cell lines derived from lymphocyte or myeloid cells, such as those derived from ALL, DLBC, and LAML. The upper cluster contained cell lines derived from solid tumor tissues. This suggests that a large portion of variance within the CCLE miRNA profiles is reflecting the tissue origins of the cell lines. On the other hand, the imperfect distinction between clusters also indicates CCLE cell lines of the same tumor type could be very different from each other as a result of the immortalization or lab culturing process.
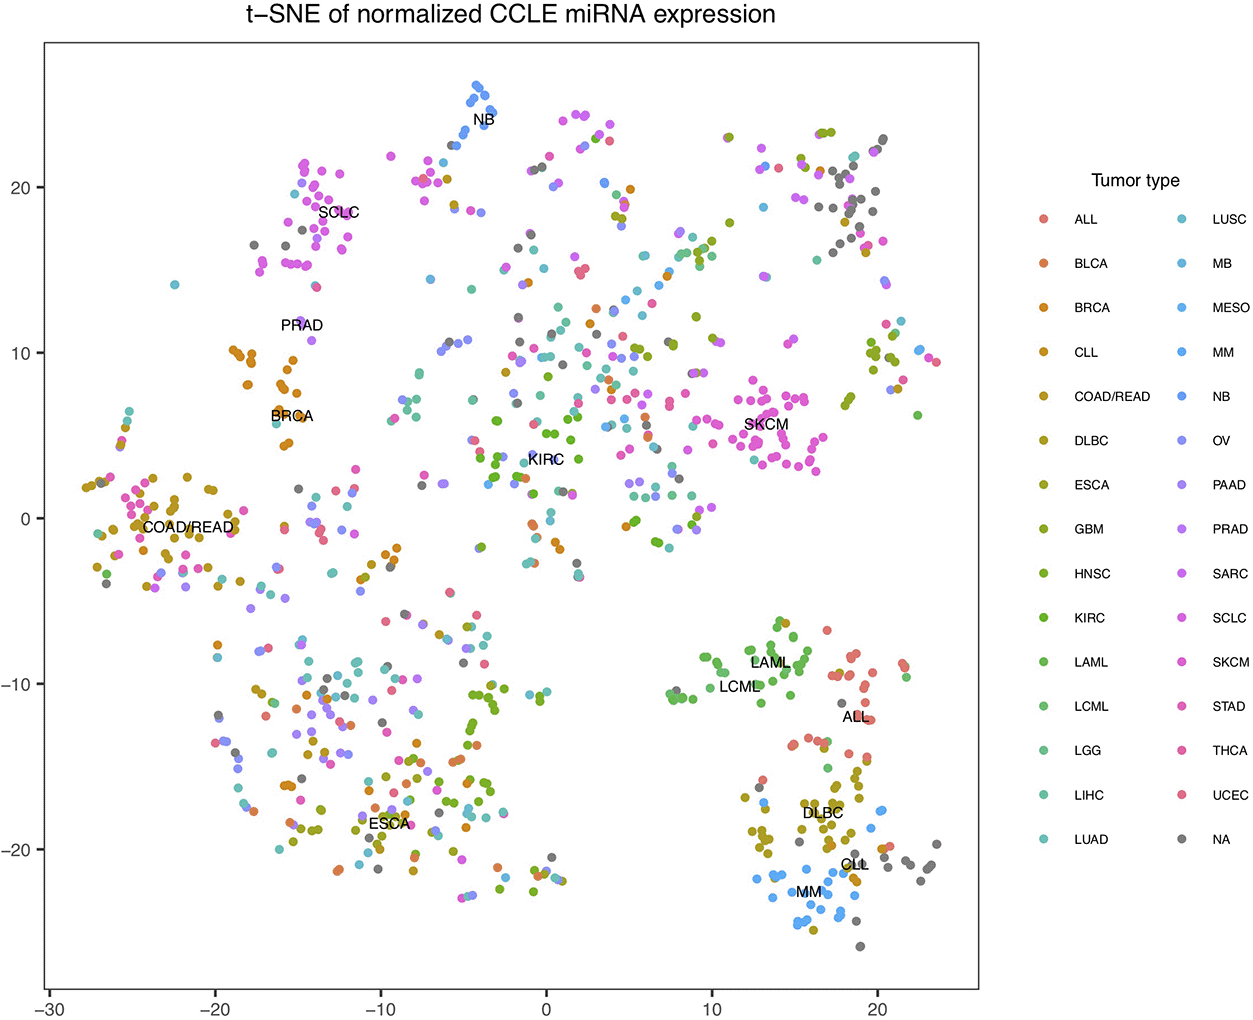
The t-SNE coordinates were calculated based on processed miRNA read counts and the points were colored by tumor types. The “UNABLE TO CLASSIFY” type was merged with NA in the figure above, shown in grey.
In the meantime, we did observe that the TCGA tumor samples clustered much better than the CCLE cell lines (Figure 3). The clusters of tumor types were more distinct after both batch correction and adjustment for tumor purity. Such observation is similar to the results based on gene expression from a previous study.14 The lack of clear cancer type clustering in the CCLE t-SNE might suggest that within each tumor type, the CCLE cell lines are more heterogeneous than the TCGA samples, and not all cell lines are good models for miRNA and cancer studies.
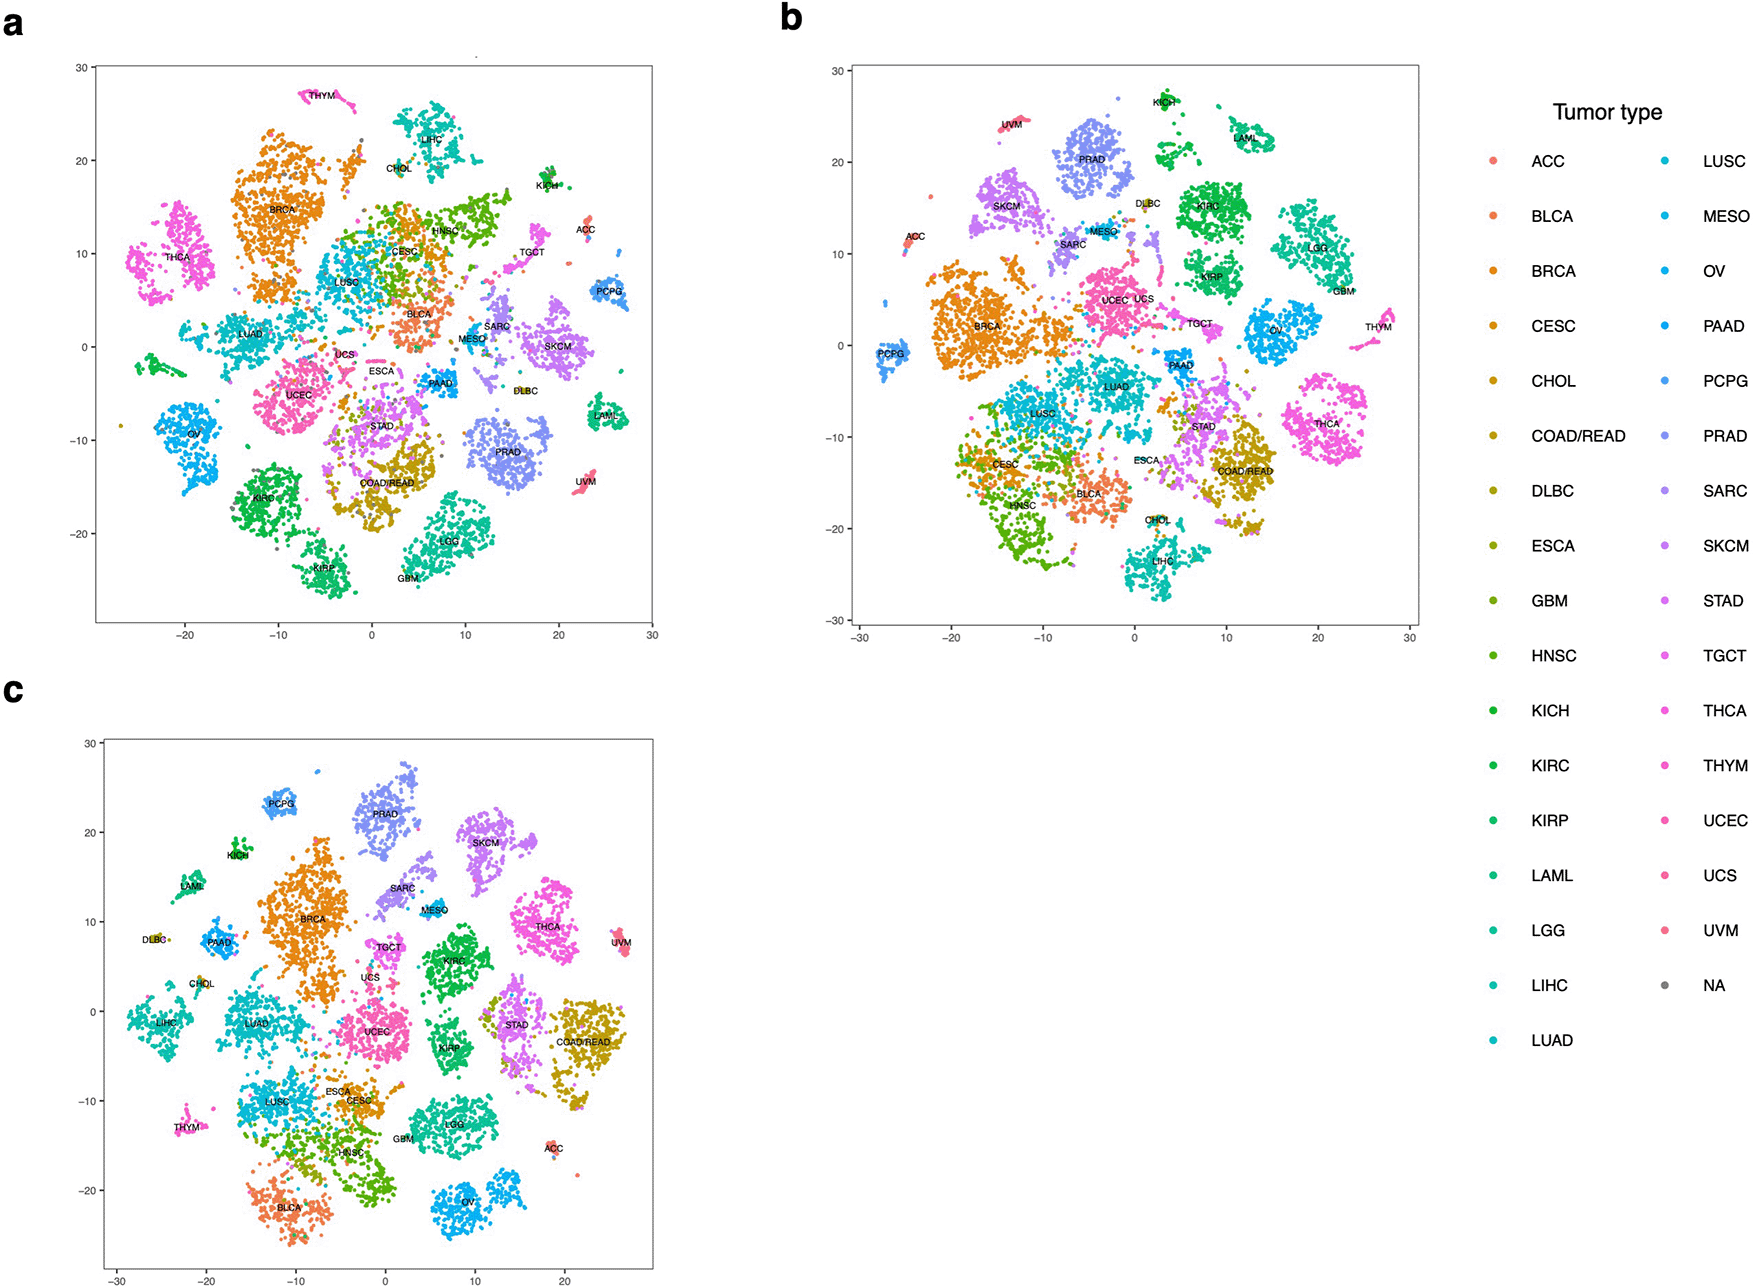
The figures above show the t-SNE of TCGA expression data, after normalization (a), batch correction (b), and purity adjustment (c), respectively. The samples formed highly distinct clusters by different tumor types after batch correction and purity adjustment.
Several tumor types with similar pathological features were mixed with each other when being clustered using normalized miRNA counts or batch corrected counts, such as BRCA, HNSC and LUSC (Figure 3a,b). These samples could be distinguished after we adjusted for the tumor purity, as reported by other studies,14 suggesting that immune infiltration could affect not only the gene but also the miRNA profiles of related tumor types in a similar way (Figure 3c).
Next, we investigated how well CCLE cell lines capture the miRNA expression profiles of TCGA human primary cancer samples. Generally, cell lines show a moderate to high correlation with their matched tumor samples across different cancer types (Figure 4a; see Extended Fig. 1-2 for correlation per each cell line). The median correlation is between 0.5–0.6. However, the correlation coefficient distribution within each tumor type was much larger than that calculated based on gene expression, such as for COAD/READ (0.23–0.83) and SARC (0.19–0.80). This indicates that the miRNA expression might be more prone to the heterogeneity within each tumor type.
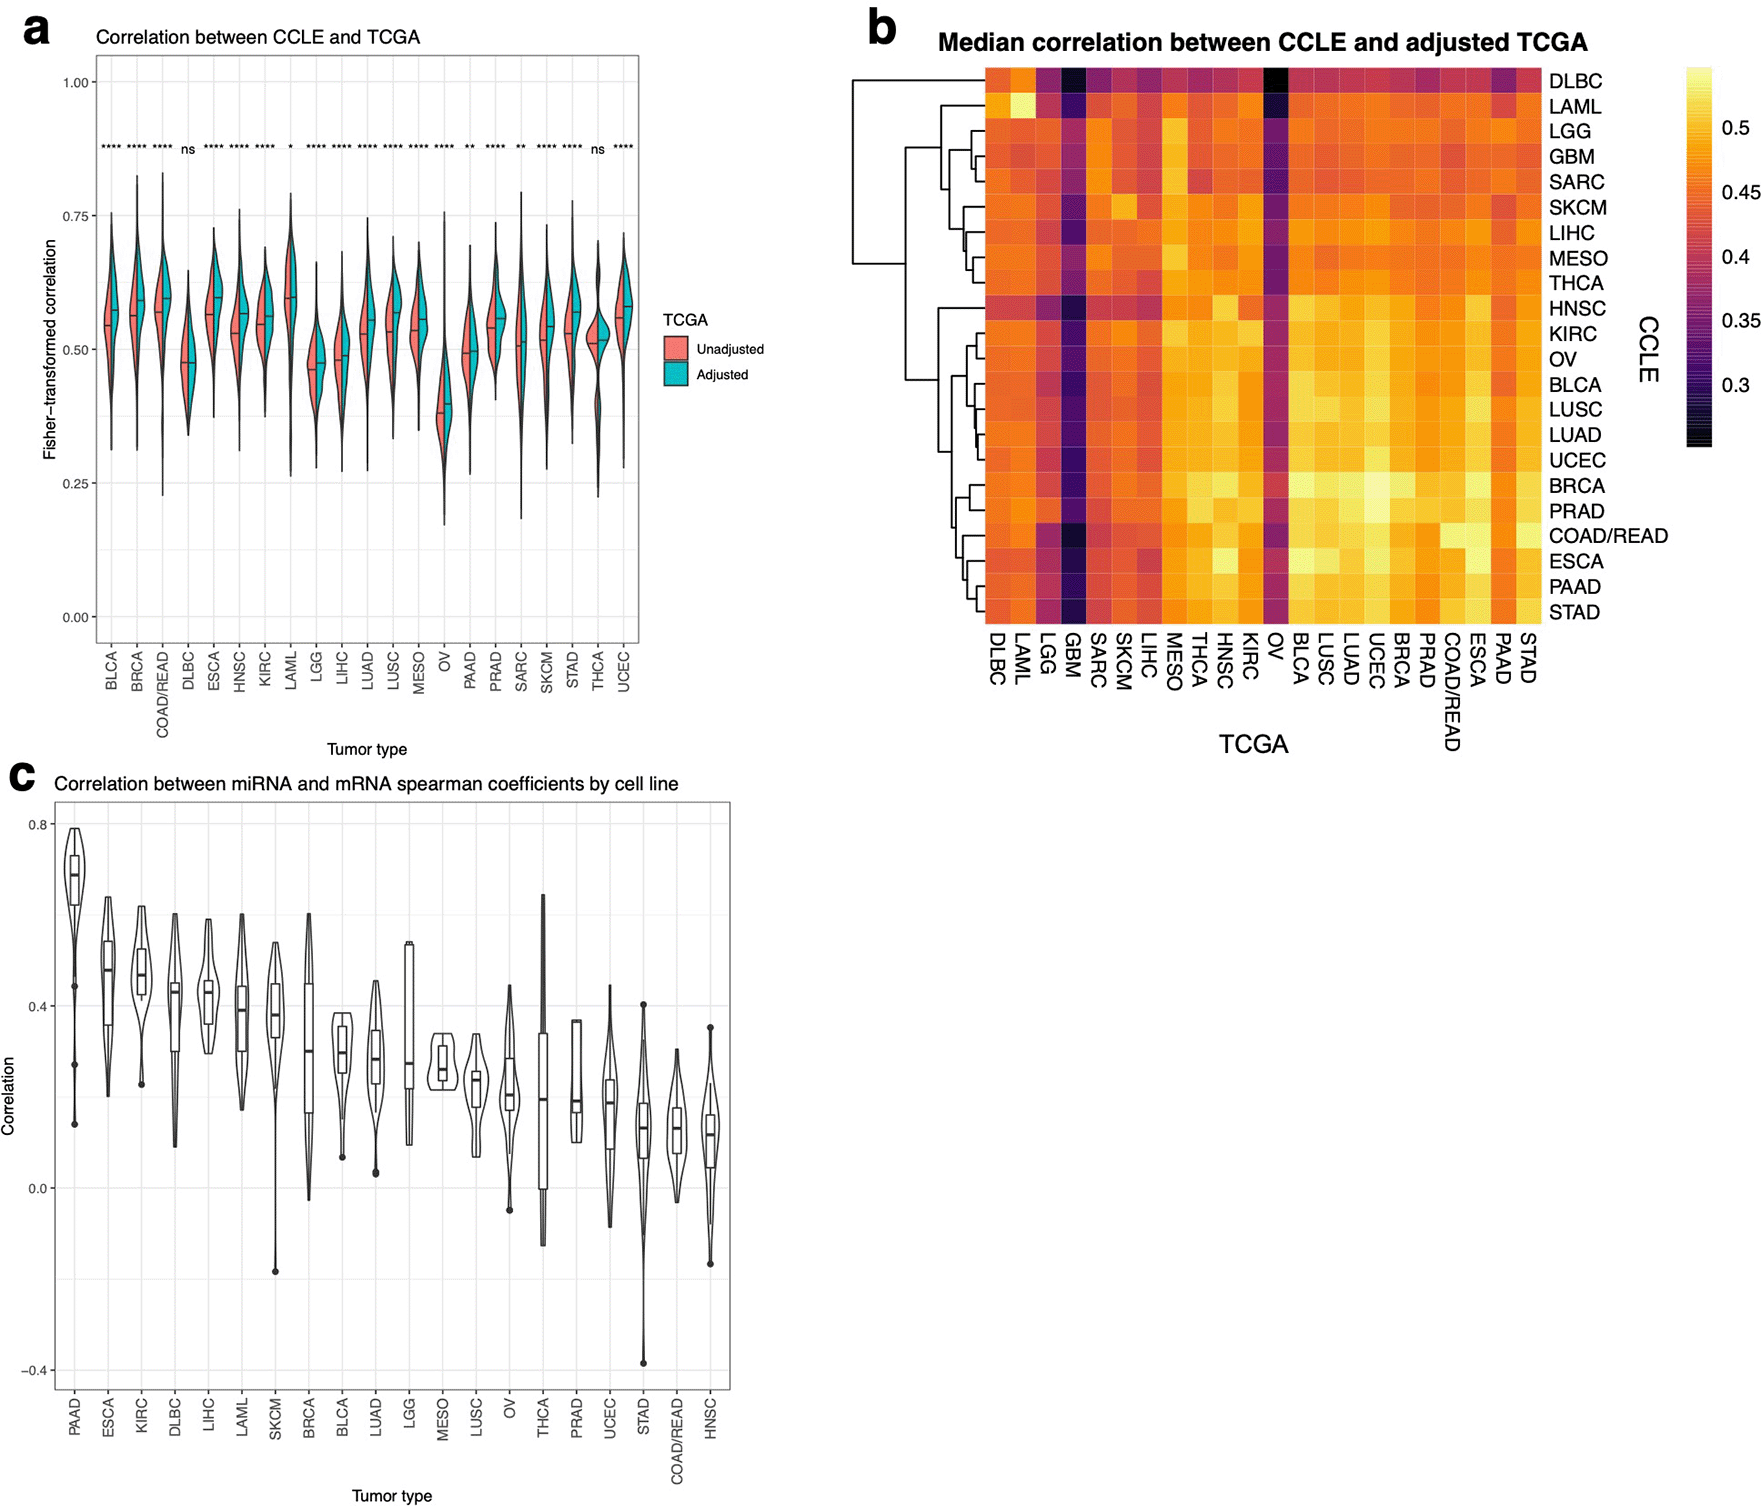
The bars indicate the median value. Tumor types with FDR > 0.05 are labeled with “ns”, FDR ≤ 0.05 with one star, FDR ≤ 0.01 with two stars, and FDR ≤ 0.001 with three stars, and FDR ≤ 0.0001 with four stars. GBM is not shown since it lacks tumor purity estimates. (b) Heatmap of median Spearman correlation coefficients between each cancer type of TCGA and CCLE. CCLE cancer types are clustered based on their correlation with each TCGA cancer type. (c) Violin plot of the Spearman correlation between miRNA and mRNA data of the correlation coefficients between TCGA and CCLE in each cell line.
Based on the correlation between CCLE and TCGA samples, samples of the same tumor type from cell lines and primary tumors are more correlated (Figure 4b). Also, similar to the observation from K Yu et al.14 cancer types with similar pathology cluster together. The two cancer types on the top of the heatmap are DLBC and LAML, both originating from immune cell types. Such separation indicates that miRNA expression could reflect the difference between hematopoietic and solid tumors. Other cancer types that are biologically related also tend to cluster together, such as LUSC and LUAD, or GBM and LGG.
Given that it is been previously reported that the cellular composition of a tumor sample has strong effects on the correlation analysis, we also compared the correlation calculated using tumor purity adjusted and the unadjusted TCGA miRNA expression profiles (Figure 4a). Most of the cancer types have a significant increase in the correlation coefficient distribution after tumor purity adjustment, such as BRCA, HNSC, LUSC, suggesting purity being a driving factor of this increase, which reflects findings based on mRNA from K Yu et al.14 These cancers, as well as the cell lines, are originated from the epithelial cells, and the amount of immune cell infiltration is expected to have a strong influence on their expression obtained from bulk RNA-sequencing. In the meantime, other hematopoietic cancer types such as LAML and DLBC, have small changes in the correlation coefficient distribution, suggesting their cellular composition is not influenced by immune infiltration.
Finally, we compared miRNA and mRNA in terms of the similarity between CCLE and TCGA expression profiles (Figure 4c). Among the tumor types, the ones with the highest median correlations are PAAD, ESCA, and KIRC, and the lowest ones are HNSC, COAD/READ, and STAD, although all median correlations are positive. Interestingly, the cancer types with a higher correlation between CCLE and TCGA based on either miRNA or mRNA expression profiles are not necessarily the ones with higher concordance between miRNA and mRNA based correlation. For example, HNSC is highly ranked by mRNA and miRNA expression (median = 0.63 and 0.57) but ranked the last based on the correlation between miRNA and mRNA correlation coefficients, while LIHC, although showing lower correlation based on expression (0.50 and 0.49), has strong concordance. Such results show that the expression similarity between cell lines and human primary tumor samples does not directly reflect the concordance in the miRNA–mRNA regulatory relationship between sample types.
To further elucidate the biological difference between CCLE and TCGA miRNA expression profiles, we investigated the expression alteration in the miRNAs that are associated with the hallmarks of cancer pathways. Comparing the GSVA score of miRNAs associated with hallmarks of cancer pathways between CCLE and TCGA (Figure 5a and Extended Figure 3), we saw higher enrichment of pathways related to immune cell infiltration in the TCGA (up-regulation of up hallmark miRNA set and vice versa), such as inflammatory response and IL6-JAK-STAT3 signaling pathways,23 suggesting the absence of immune infiltration in CCLE pure cancerous cell compositions might be the major difference between two sample types. In the meantime, CCLE is more enriched in hallmarks related to tumor cells, such as more G2M checkpoint, p53 pathway, and epithelial-mesenchymal transformation pathways, revealing a higher portion of cancerous cells composing the cell lines. These results are consistent with GSVA scores of mRNA from K Yu et al,14 suggesting miRNA is similar to mRNA in terms of the difference in composition and hallmark enrichment between TCGA and CCLE.
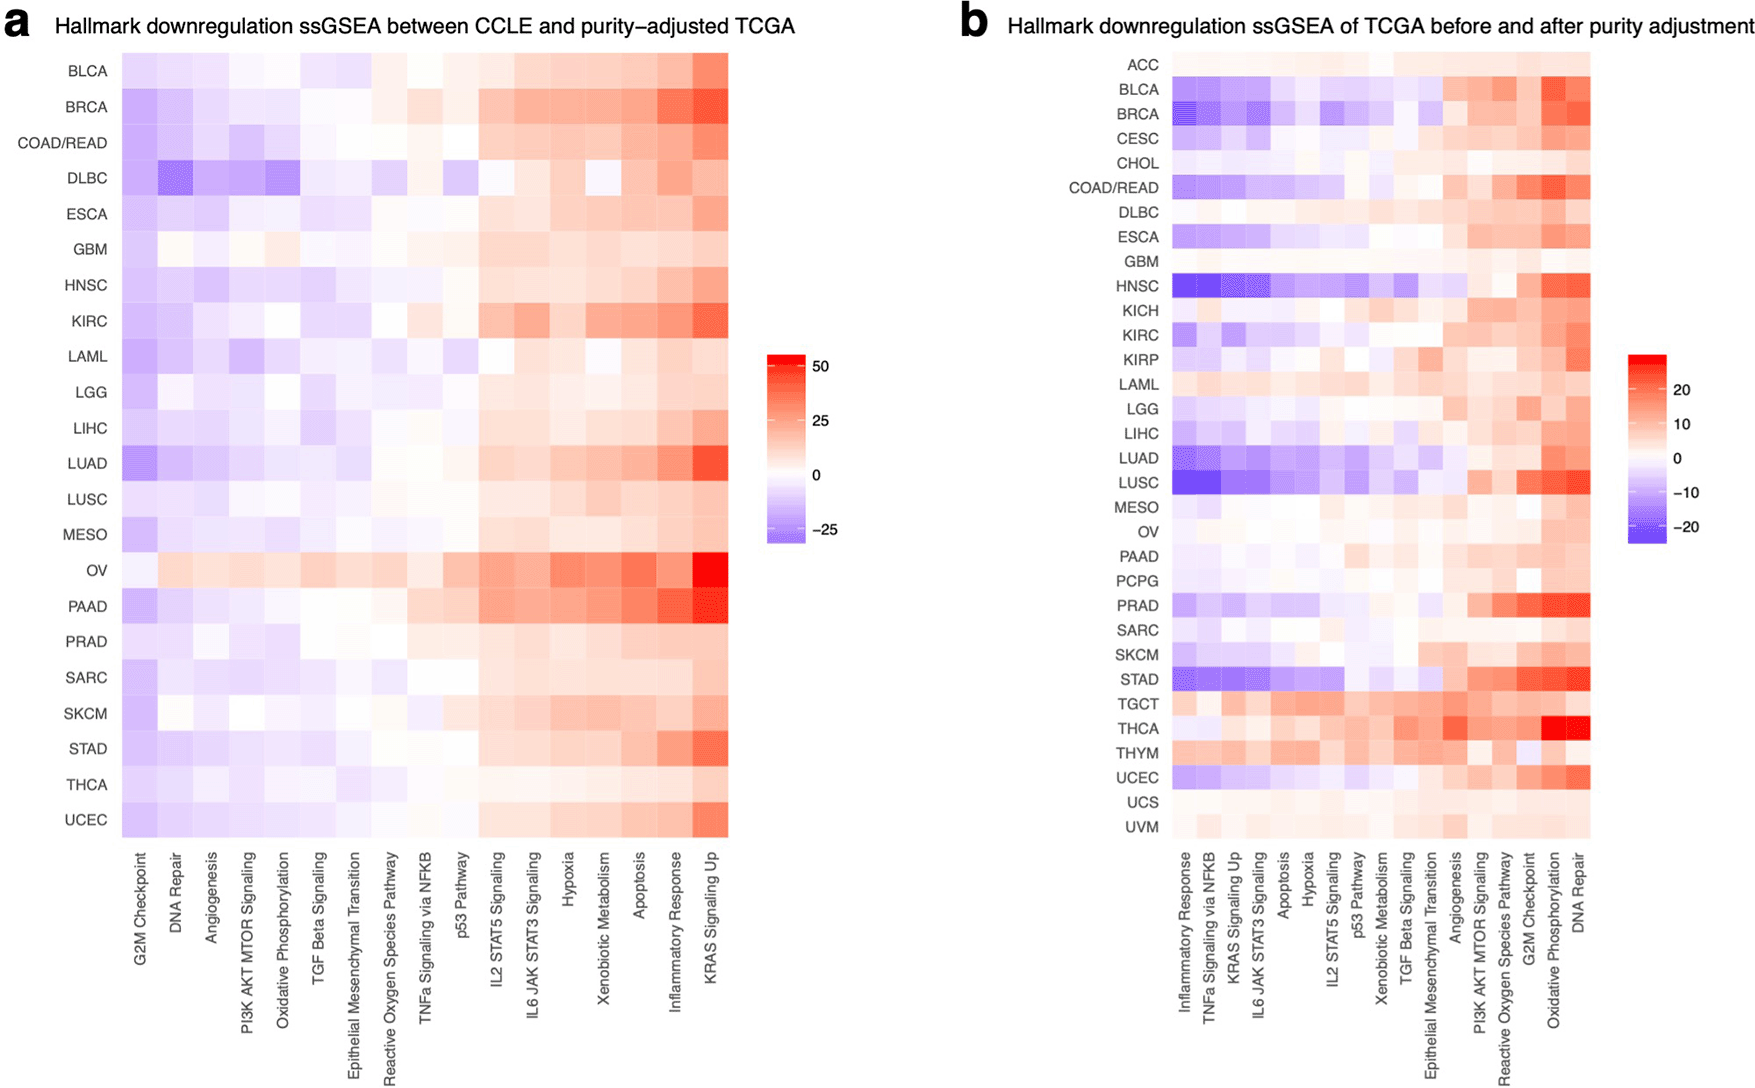
The downregulated hallmarks are compared between CCLE and tumor purity-adjusted TCGA (a) and between TCGA before and after purity adjustment (b) using a t-test and visualized as heatmaps. It is possible to observe that immune infiltrate hallmarks are more present in TCGA, especially before adjustment.
Although both purity-adjusted and unadjusted TCGA compare similarly to CCLE, there is a consistent difference across cancer types due to purity adjustment (Figure 5b). Inflammatory response and TNF-a signaling are significantly more enriched in TCGA before purity adjustment, and other hallmarks from cancer cells such as DNA repair and oxidative phosphorylation are more enriched in TCGA after adjustment. This demonstrates that the purity adjustment of TCGA effectively reduces the impurity of the gene expression data.
To further characterize the difference between cell line models and human primary tumor tissues in terms of transcriptomic profiles, we constructed the miRNA–mRNA network in CCLE and TCGA for each cancer type separately and compared the network metrics. The degree distribution shows the distribution of the number of targets of all 230 miRNAs for each cancer type, reflecting the connectivity of the target network. The results reveal differences in the global connectivity between CCLE and TCGA regulatory networks. CCLE miRNAs have, on average, fewer obvious targets than TCGA, with miRNA out-degrees concentrated at lower values (Figure 6a). Both CCLE and TCGA contain some outlying miRNA hubs with significantly more targets than average. However, since TCGA contains more samples than CCLE (1,030 vs 50 for BRCA in Figure 6b; Extended Fig. 4), there are expected to be more significant correlated miRNA–mRNA pairs in the TCGA data so the degree distribution comparison may be inconclusive.
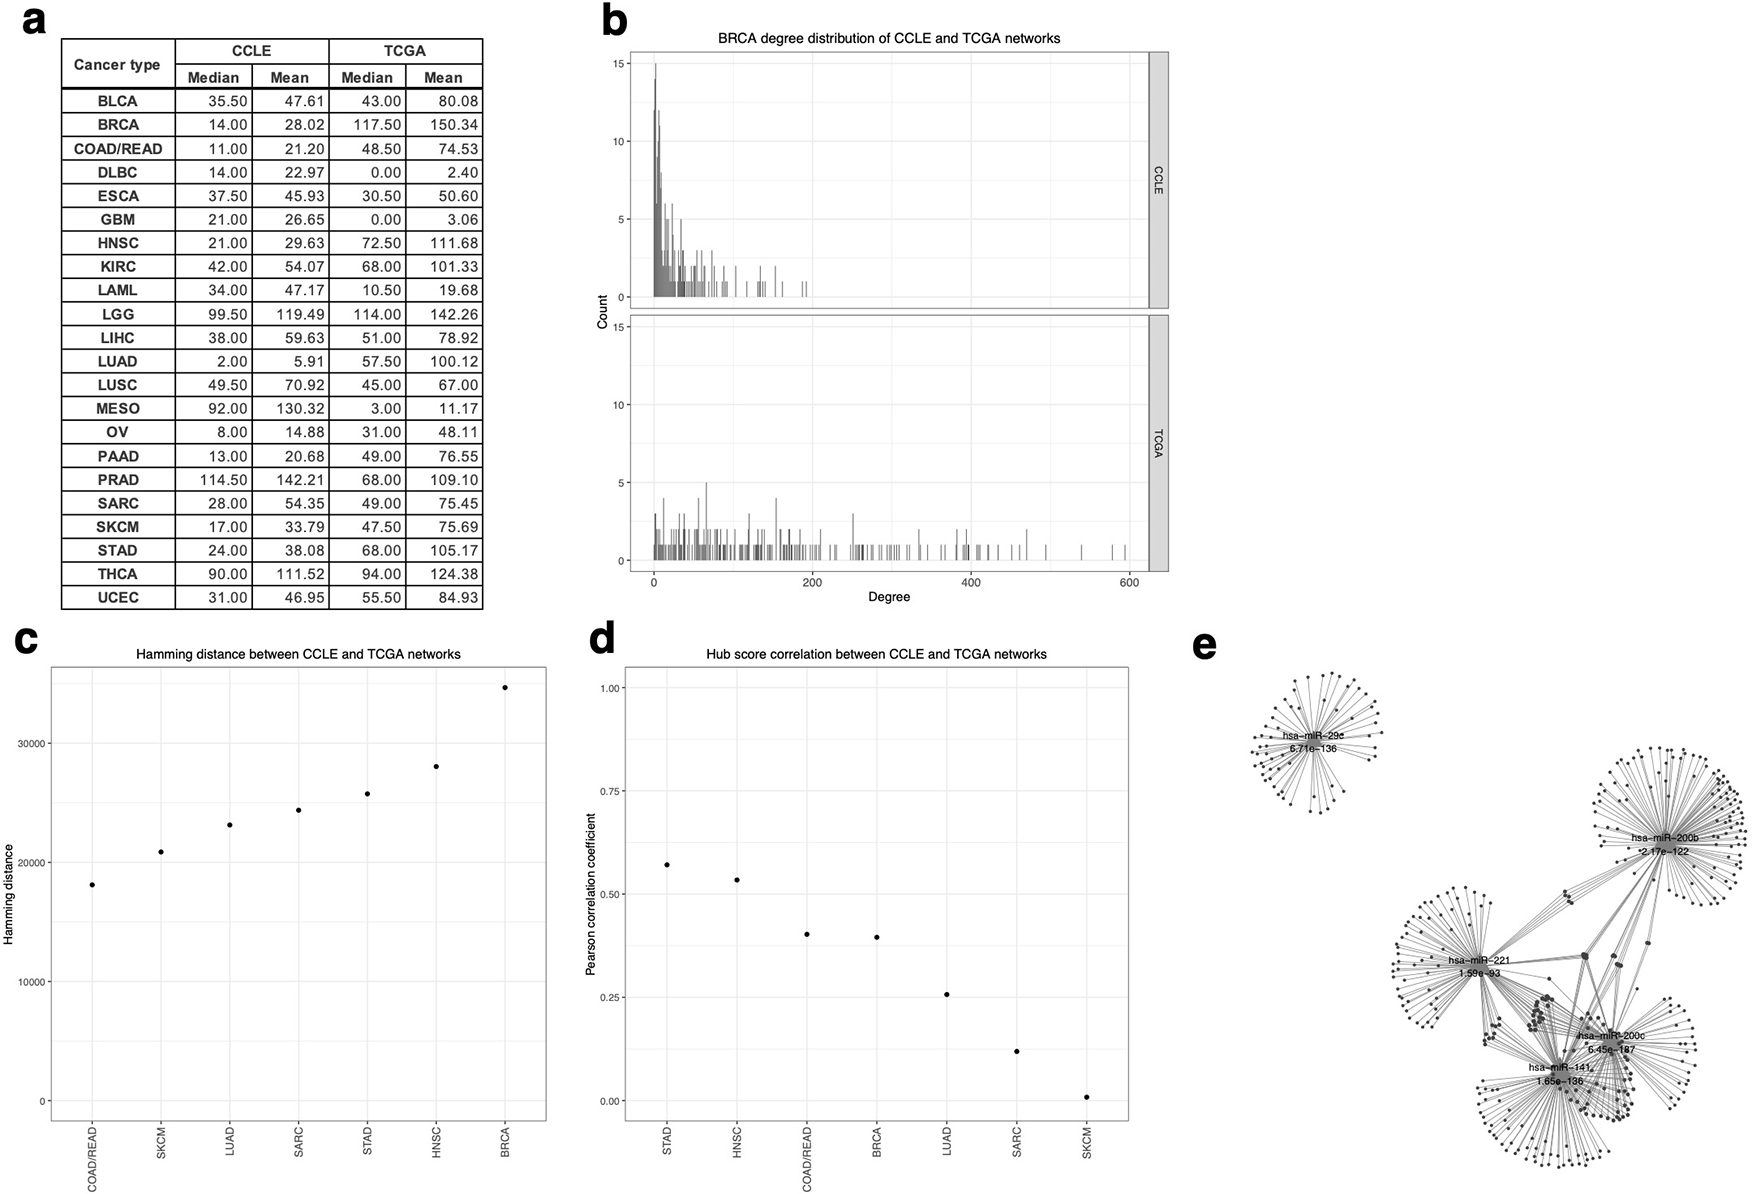
(b) The miRNA out-degree distribution of BRCA target networks. (c) Hamming distance between CCLE and TCGA target networks for each cancer type. (d) Pearson correlation coefficient of hub scores of all miRNAs between CCLE and TCGA for each cancer type. (e) Common targets of the five miRNA hubs with the most significant overlap of targets between CCLE and TCGA networks of BRCA. Each triangle represents a miRNA hub and each circle node represents a target. The FDR values of the one-tailed Fisher exact test of the overlap are labeled below the miRNA names.
The hamming distance offers a metric of the difference between target networks that also takes the edges to mRNA targets into account rather than merely the out-degree of each miRNA. The hamming distances between CCLE and TCGA miRNA–mRNA networks in Figure 6c measure the difference of miRNA regulation between CCLE and TCGA of each cancer type, and a small hamming distance indicates that the two networks are more similar to each other. Cancer types with more similar networks are COAD/READ (distance = 18,114) and SKCM (distance = 20,872), while more different ones are BRCA (distance = 34,677) and HNSC (distance = 28,047). The hamming distance, however, failed to adjust to the greater total number of edges in TCGA target networks than in CCLE, so an analysis focused on miRNA hub scores and without the influence of network size was conducted.
While network metrics as the degree distribution and hamming distance provide a global view on the network similarity between CCLE and TCGA, it is unclear whether individual miRNA targets the same set of genes in both cell lines and human tumor samples. To further explore each miRNA, the Pearson correlations of 230 miRNA hub scores between CCLE and TCGA were calculated (Figure 6d). They reflect whether the network topology, especially the central regulatory miRNA, is conserved between CCLE and TCGA. All coefficients are positive, meaning the regulatory roles between CCLE and TCGA are largely similar, although the correlation strength is very varied in different cancer types. Cancer types with more pronounced similarity of miRNA centrality are STAD (r = 0.57) and HNSC (r = 0.53), while less similar ones are SKCM (r = 0.01) and SARC (r = 0.12).
To prioritize hub miRNAs based on the conservation of regulatory potential, networks of hub miRNAs with the most significant overlap of their targets between CCLE and TCGA were obtained (Extended Fig. 5). Taking BRCA as an example, the miRNAs of BRCA with the most significant overlap of mRNA targets between CCLE and TCGA are hsa-miR-200c, hsa-miR-141, hsa-miR-29c, hsa-miR-200b, and hsa-miR-221 (FDR < 0.0001; Figure 6e). They are miRNA hubs with conserved connectivity between CCLE and TCGA and are ideal regulatory hubs to be studied using cell line models. In fact, previous research involving cell line models has shown that hsa-miR-200 promotes the proliferation of breast luminal progenitor cells and facilitates the growth and metastasis of breast cancer, while hsa-miR-221 regulates breast cancer development and progression and serves as a promising biomarker.24,25 These findings highlight the value of our results for identifying miRNAs with conserved regulatory roles in both cell lines and human tumor samples and could guide cell-line-based research to model how miRNA regulates mRNA in primary tumors.
While previous research has characterized how CCLE cell lines reflect the gene expression profiles of human primary tumors in TCGA, our work extends the analysis to miRNA expression profiles. We show that cell lines of the related cancer type cluster closer based on miRNA expression profiles, similar to the mRNA based analysis. In the meantime, there seems to be a larger variance in the correlation distribution within a cancer type, indicating miRNA affecting by the heterogeneity of the samples. There are two potential technical reasons for such observation: 1) different platforms were used to profile miRNA between CCLE and TCGA; 2) there are smaller number of unique miRNA species comparing the mRNA and could be more affected by the noise. Yet, the larger variance between cell lines and tumor samples based on miRNA profiles indicates that choosing the cell line most similar to the cancer type of interests is even more important when studying miRNAs.
We have also shown that tumor purity affects the correlation between CCLE and TCGA miRNA expressions. With the adjustment of tumor purity in the TCGA miRNA expression profiles, we observe an increase in the correlation between miRNA expression profiles of cell lines and human primary tumor samples. Also, through functional characterization of miRNA related to hallmarks of cancer pathways, we find that TCGA samples have higher expression of immune pathways and lower expression of cell-cycle and cell growth pathways. The discrepancy is particularly stronger for solid tumor comparing to blood cancer, such as AML or DLBC. The observation could be the result of immortalization or simply cells being removed from the original microenvironment. The loss of cancer cell communication with surrounding structural cells and particularly the lack of immune infiltration within cell lines could greatly affect the transcriptomic profiling. We believe extra cautions should be made when cell lines are being used to tackle question involving cell-to-cell interaction.
More importantly, we compared the miRNA–mRNA regulatory networks between cell lines and human tumor samples and observed a very different trend than comparing the expression profiles alone. This result indicates that the similarity in miRNA or mRNA expression profiles between cell line model and human tumor tissues does not guarantee a conserved miRNA regulatory pattern. To comprehensively examine the miRNA–mRNA network, we further evaluated whether each miRNA regulates the same set of genes in CCLE and TCGA samples. The top miRNAs from our analysis function as hub regulators of gene expression and have been previously shown to be biologically essential to cancer development. Such miRNAs with strong conservation in regulatory functions from tumor to cell lines are ideal candidates for in vitro analysis.
There are several limitations to our analysis. Firstly, the CCLE and TCGA miRNA expressions were measured using very different techniques. We tried to overcome such discrepancy by applying a stringent filter during data preprocessing and avoided direct expression comparison. Given the consistent observations between our results and previous work, we believed our analysis is valid. Second, we used CCLE cell lines of the same cancer type to calculate the correlation network even though there might be underlying differences. Given that there is only one replicate for each cell line in CCLE, there was no easy way to circumvent this issue. We filtered for cell lines with a high correlation to TCGA samples and cancer types with enough number of cell lines to ensure the reliability of the analysis. Finally, we understand miRNA-mRNA correlation based on normalized count data should not be interpreted as causal relationship. In a more rigorous setting, miRNA regulatory roles should be examined based on perturbation assays, in which we would observe whether target gene expression levels are altered following over-expression or knock-out of a miRNA. However, such task is beyond the scope of this project. Here, we only aim to objectively explore the differences between cell lines and human tumors samples from two public databases.
In summary, we conducted systematic comparison between CCLE and TCGA in terms of miRNA expression profiles and the regulatory landscapes. Our results highlight the importance of choosing appropriate cell lines to study miRNA in cancer research. The cellular composition heterogeneity, particularly for the solid tissue tumors, greatly affect whether the cell lines can accurately capture the miRNA expression profiles of the tumor. Certain miRNAs, not all, have preserved target gene regulatory roles in the cell lines and may be more suitable for in vitro investigation. We believe our results can provide valuable resources for selecting cell lines to study how a particular miRNA regulates cancer-related gene expression.
We would like to graciously acknowledge the Pioneers China Program (PCP) program which supported this research.
Prof. Marc Lenburg confirms that the authors have an appropriate level of expertise to conduct this research and confirms that the submission is of an acceptable scientific standard. Prof. Lenburg declares they have no competing interests. Affiliation: Boston University School of Medicine.
CCLE miRNA counts were downloaded from Broad Institute data portal: https://portals.broadinstitute.org/ccle/data. TCGA miRNA counts were downloaded from the GDC data portal https://portal.gdc.cancer.gov/ using the R package TCGAbiolinks.16 Correlation matrices between transcriptomic data of TCGA and CCLE from the work by K. Yu were released on GitHub: https://github.com/katharineyu/TCGA_CCLE_test. Tumor purity estimates of TCGA using the ABSOLUTE method are available on the TCGA PanCanAtlas publications website: https://gdc.cancer.gov/about-data/publications/pancanatlas. The hallmark miRNA gene sets from A. Dhawan were available on GitHub: https://github.com/andrewdhawan/miRNA_hallmarks_of_cancer/. TargetScan miRNA target predictions were downloaded from the TargetScan website: http://www.targetscan.org/vert_72/.
Github: Regulatory landscapes of specific miRNAs are conserved between cell lines and primary tumors, https://github.com/hanwenzhu/mir-tcga-ccle-paper.22
This project contains the following extended data:
• Extended Table 1.pdf (TCGA and CCLE tumor type abbreviations).
• Extended Figure 1.pdf
Distribution of Spearman correlation coefficients between CCLE and miRNA expression profiles for each cancer type.
For each cell line of CCLE, Spearman correlation was calculated with TCGA tumor samples of the same tumor type based on miRNA expression (see Methods). The distribution of correlation coefficients for each cell line is plotted as a boxplot, where the center line shows the median and the upper and lower hinges show the first and the third quantiles. A violin plot is also plotted to represent the shape of the distribution.
• Extended Figure 2.pdf
Distribution of Spearman correlation coefficients between CCLE and tumor purity adjusted TCGA miRNA expression profiles for each cancer type.
Similar to Extended Fig. S1, except that the correlation was calculated between CCLE cell line and the tumor purity adjusted TCGA miRNA expression profiles.
• Extended Figure 3.pdf
Cancer hallmark GSVA score for the miRNA expression of TCGA and CCLE.
The upregulated hallmarks GSVA scores were compared between CCLE and tumor purity adjusted TCGA (a) and between TCGA before and after purity adjustment (b) using a t-test and visualized as heatmaps.
• Extended Figure 4.pdf
The miRNA out-degree distribution in target networks of selected cancer types.
The degree distribution is plotted for CCLE and TCGA separately. The selection criteria for cancer types and methods for constructing miRNA–mRNA networks are described in the Methods section.
• Extended Figure 5.pdf
The miRNA–mRNA networks for miRNAs with conserved target genes between CCLE cell lines and TCGA tumor samples.
For each miRNA within each cancer type, a Fisher exact test was performed to find the significance of the overlap of targets between CCLE and TCGA networks. The top five most significant miRNA hubs are shown in the figure for each cancer types. miRNAs are shown as triangles and target genes as circles. Edges represent significant negative correlation between each miRNA and its predicted targets in both CCLE and TCGA. The Fisher exact test FDR values are shown below each miRNA name.
The source code for this project can be found at: Zenodo: hanwenzhu/mir-tcga-ccle-paper. http://doi.org/10.5281/zenodo.4726328.22
This project contains the following files;
• README.md (Description for the github repository)
• compare. Rmd (Rmarkdown file including scripts for analysis done in this manuscript, including visualization, correlation analysis, gene set variation analysis and network analysis)
• download. R (R script for downloading TCGA miRNA expression data using TCGAbiolinks16)
• preprocessing. Rmd (Rmarkdown file including scripts for processing and normalizing data used in this manuscript)
• LICENSE (MIT license for the codes in the github repository)
License: MIT
| Views | Downloads | |
|---|---|---|
| F1000Research | - | - |
|
PubMed Central
Data from PMC are received and updated monthly.
|
- | - |
Is the work clearly and accurately presented and does it cite the current literature?
Yes
Is the study design appropriate and is the work technically sound?
Yes
Are sufficient details of methods and analysis provided to allow replication by others?
Yes
If applicable, is the statistical analysis and its interpretation appropriate?
Partly
Are all the source data underlying the results available to ensure full reproducibility?
Yes
Are the conclusions drawn adequately supported by the results?
No
Competing Interests: No competing interests were disclosed.
Reviewer Expertise: Drug discovery, gene expression, signaling mechanism, prognostic biomarkers, proteomics studies
Is the work clearly and accurately presented and does it cite the current literature?
Yes
Is the study design appropriate and is the work technically sound?
Yes
Are sufficient details of methods and analysis provided to allow replication by others?
Yes
If applicable, is the statistical analysis and its interpretation appropriate?
Yes
Are all the source data underlying the results available to ensure full reproducibility?
Yes
Are the conclusions drawn adequately supported by the results?
Yes
Competing Interests: No competing interests were disclosed.
Reviewer Expertise: computational biology, cancer genomics and epigenetics
Alongside their report, reviewers assign a status to the article:
| Invited Reviewers | ||
|---|---|---|
| 1 | 2 | |
|
Version 1 22 Jul 21 |
read | read |
Provide sufficient details of any financial or non-financial competing interests to enable users to assess whether your comments might lead a reasonable person to question your impartiality. Consider the following examples, but note that this is not an exhaustive list:
Sign up for content alerts and receive a weekly or monthly email with all newly published articles
Already registered? Sign in
The email address should be the one you originally registered with F1000.
You registered with F1000 via Google, so we cannot reset your password.
To sign in, please click here.
If you still need help with your Google account password, please click here.
You registered with F1000 via Facebook, so we cannot reset your password.
To sign in, please click here.
If you still need help with your Facebook account password, please click here.
If your email address is registered with us, we will email you instructions to reset your password.
If you think you should have received this email but it has not arrived, please check your spam filters and/or contact for further assistance.
Comments on this article Comments (0)