Keywords
cell conversion, scRNA-seq, scATAC-seq, transcription factors, epigenetics
This article is included in the Cell & Molecular Biology gateway.
This article is included in the Bioinformatics gateway.
cell conversion, scRNA-seq, scATAC-seq, transcription factors, epigenetics
The cell identity is largely controlled by transcription factors (TFs). TFs regulate gene expression by binding DNA in a sequence-specific manner, targeting short sequences called transcription factor binding sites (TFBS). Although almost half of all TFs are expressed in a particular cell type,21 only a minor share of these TFs — so-called core TFs — are sufficient to maintain cell identity by defining the corresponding gene expression programs.11,22,23 The identification of core TFs for a large number of cell types would be a valuable addition for an atlas of transcription regulators supplementing the Encyclopedia of Regulatory DNA Elements (ENCODE, Ref. 16). Such an atlas, in turn, would facilitate systematic investigation of regulatory networks and contribute to establishing and refining direct cell conversion protocols for clinically relevant cell types.6,7
Systematic determination of core TFs controlling individual cell type identity has previously been attempted. Initial efforts were mainly focused on the experimental screening of the TFs, presumably regulating the deferentially expressed genes (DEGs) in the comparison between query cell type, and a small number of alternative cell types that could potentially serve as an initial stage for conversion. Some of these TFs could play a role as regulators controlling cellular identities. For example, studies showed that over-expression of MyoD1 in fibroblasts leads to its conversion into the muscle cells,19 while inhibition of Oct4 resulted in the suppression of the pluripotent stem cell population during mammalian embryo development.12 Recent experiments with TF over-expression leading to conversion of cells to another cell type appeared to be used as a stringent test of the potential of specific TFs to establish and maintain cell identity.11,22,23 Nonetheless, while being illustrative validation for each TF, such experiments are still time- and labor-consuming, and resulting observations are limited to specific cell types.
The growth of genome-wide sequencing technologies allowed to develop computational systems capable of predicting candidate core TFs.2,9,14,17 However, being broad in scope and easily scalable, these methods infer predictions using preferably only bulk RNA sequencing (RNA-seq) data, which estimates the average gene expression level across a hundred thousands to millions of cells. As a result, they are insufficient for analysis of heterogeneous systems, such as early embryonic populations or complex tissues, including brain or bone marrow.
Here we propose an approach that uses single-cell expression and DNA accessibility data to select core TFs for cell differentiation or directed conversion. A distinct feature of the approach is incorporating not only TFs expression levels in the original and target cell types, but also (1) the chromatin conditions in gene regulatory elements, as well as (2) TF putative binding sites. Thus, this method simultaneously takes into account the accessibility and expression profile of the initial and terminal cell types involved in the conversion. Additionally, our method uses modified gene set enrichment analysis (GSEA)18 for the selection of core TFs, thus reducing the number of arbitrary thresholds in the pipeline.
To validate our method, we applied it to hematopoietic differentiation datasets,5,1 since this process has been extensively studied. We provided TFs for the hematopoietic stem cells (HSC) differentiation into CD4(+) cells as an example (Table 1). The detected TFs are critical for the HSC-to-CD4(+) cells differentiation. The top-ranked TF, TCF7, is a transcription activator recruited in T-cell lymphocyte differentiation and is necessary for the survival of immature CD4(+) and CD8(+) thymocytes.13,10 RORA gene plays a crucial role in the regulation of embryonic development, differentiation and immunity.4 TBX21 is a lineage-defining TF, which initiates Th1(CD4(+)) lineage development from naive T helper (CD4(+)) precursor cells.24,10 The LEF1 TF has a higher affinity to a functionally important site in the T-cell receptor-alpha enhancer, and thereby its presence in these regions increases the activity of the enhancer.3
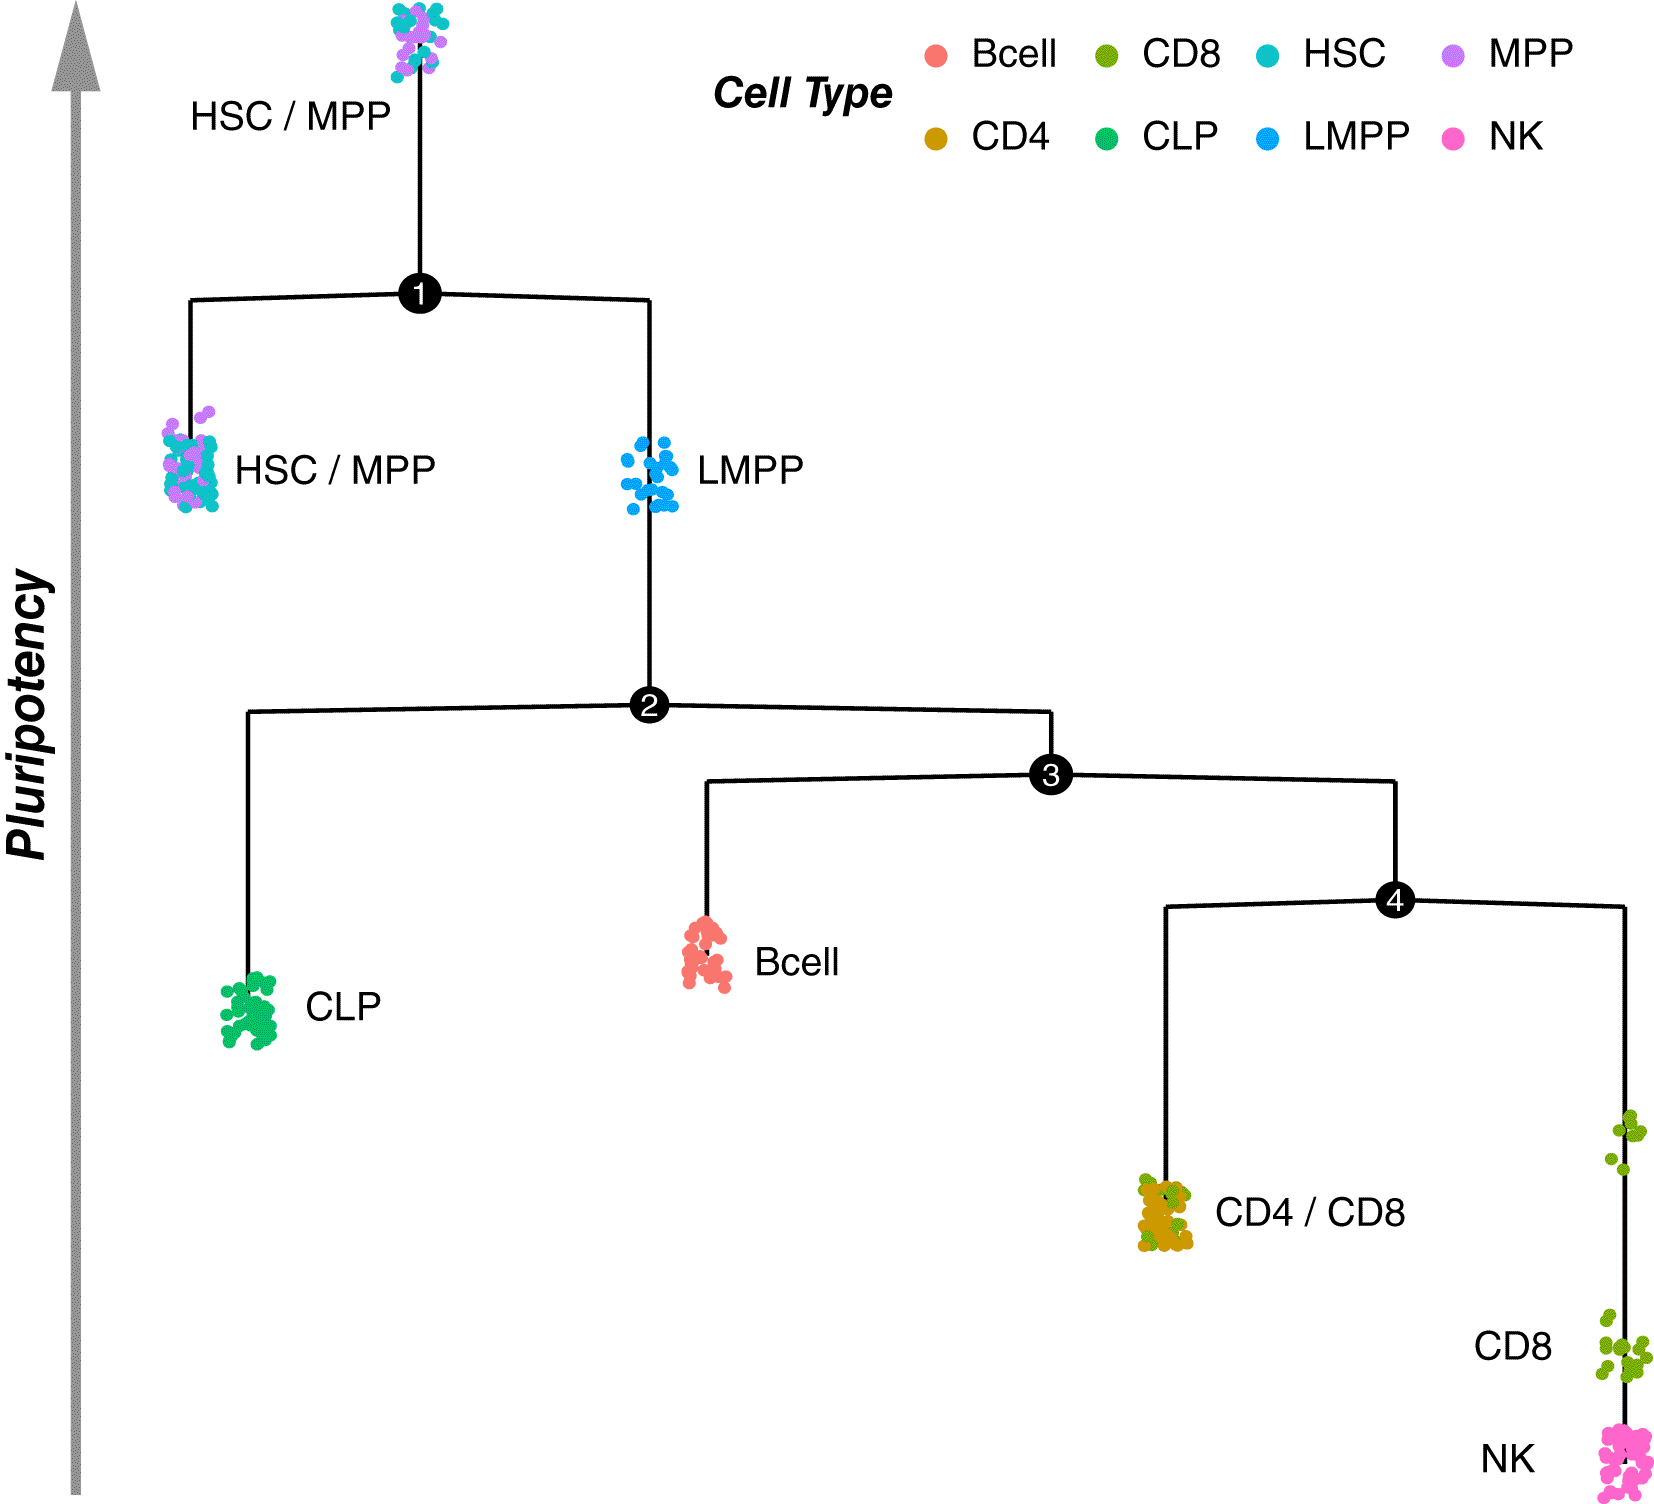
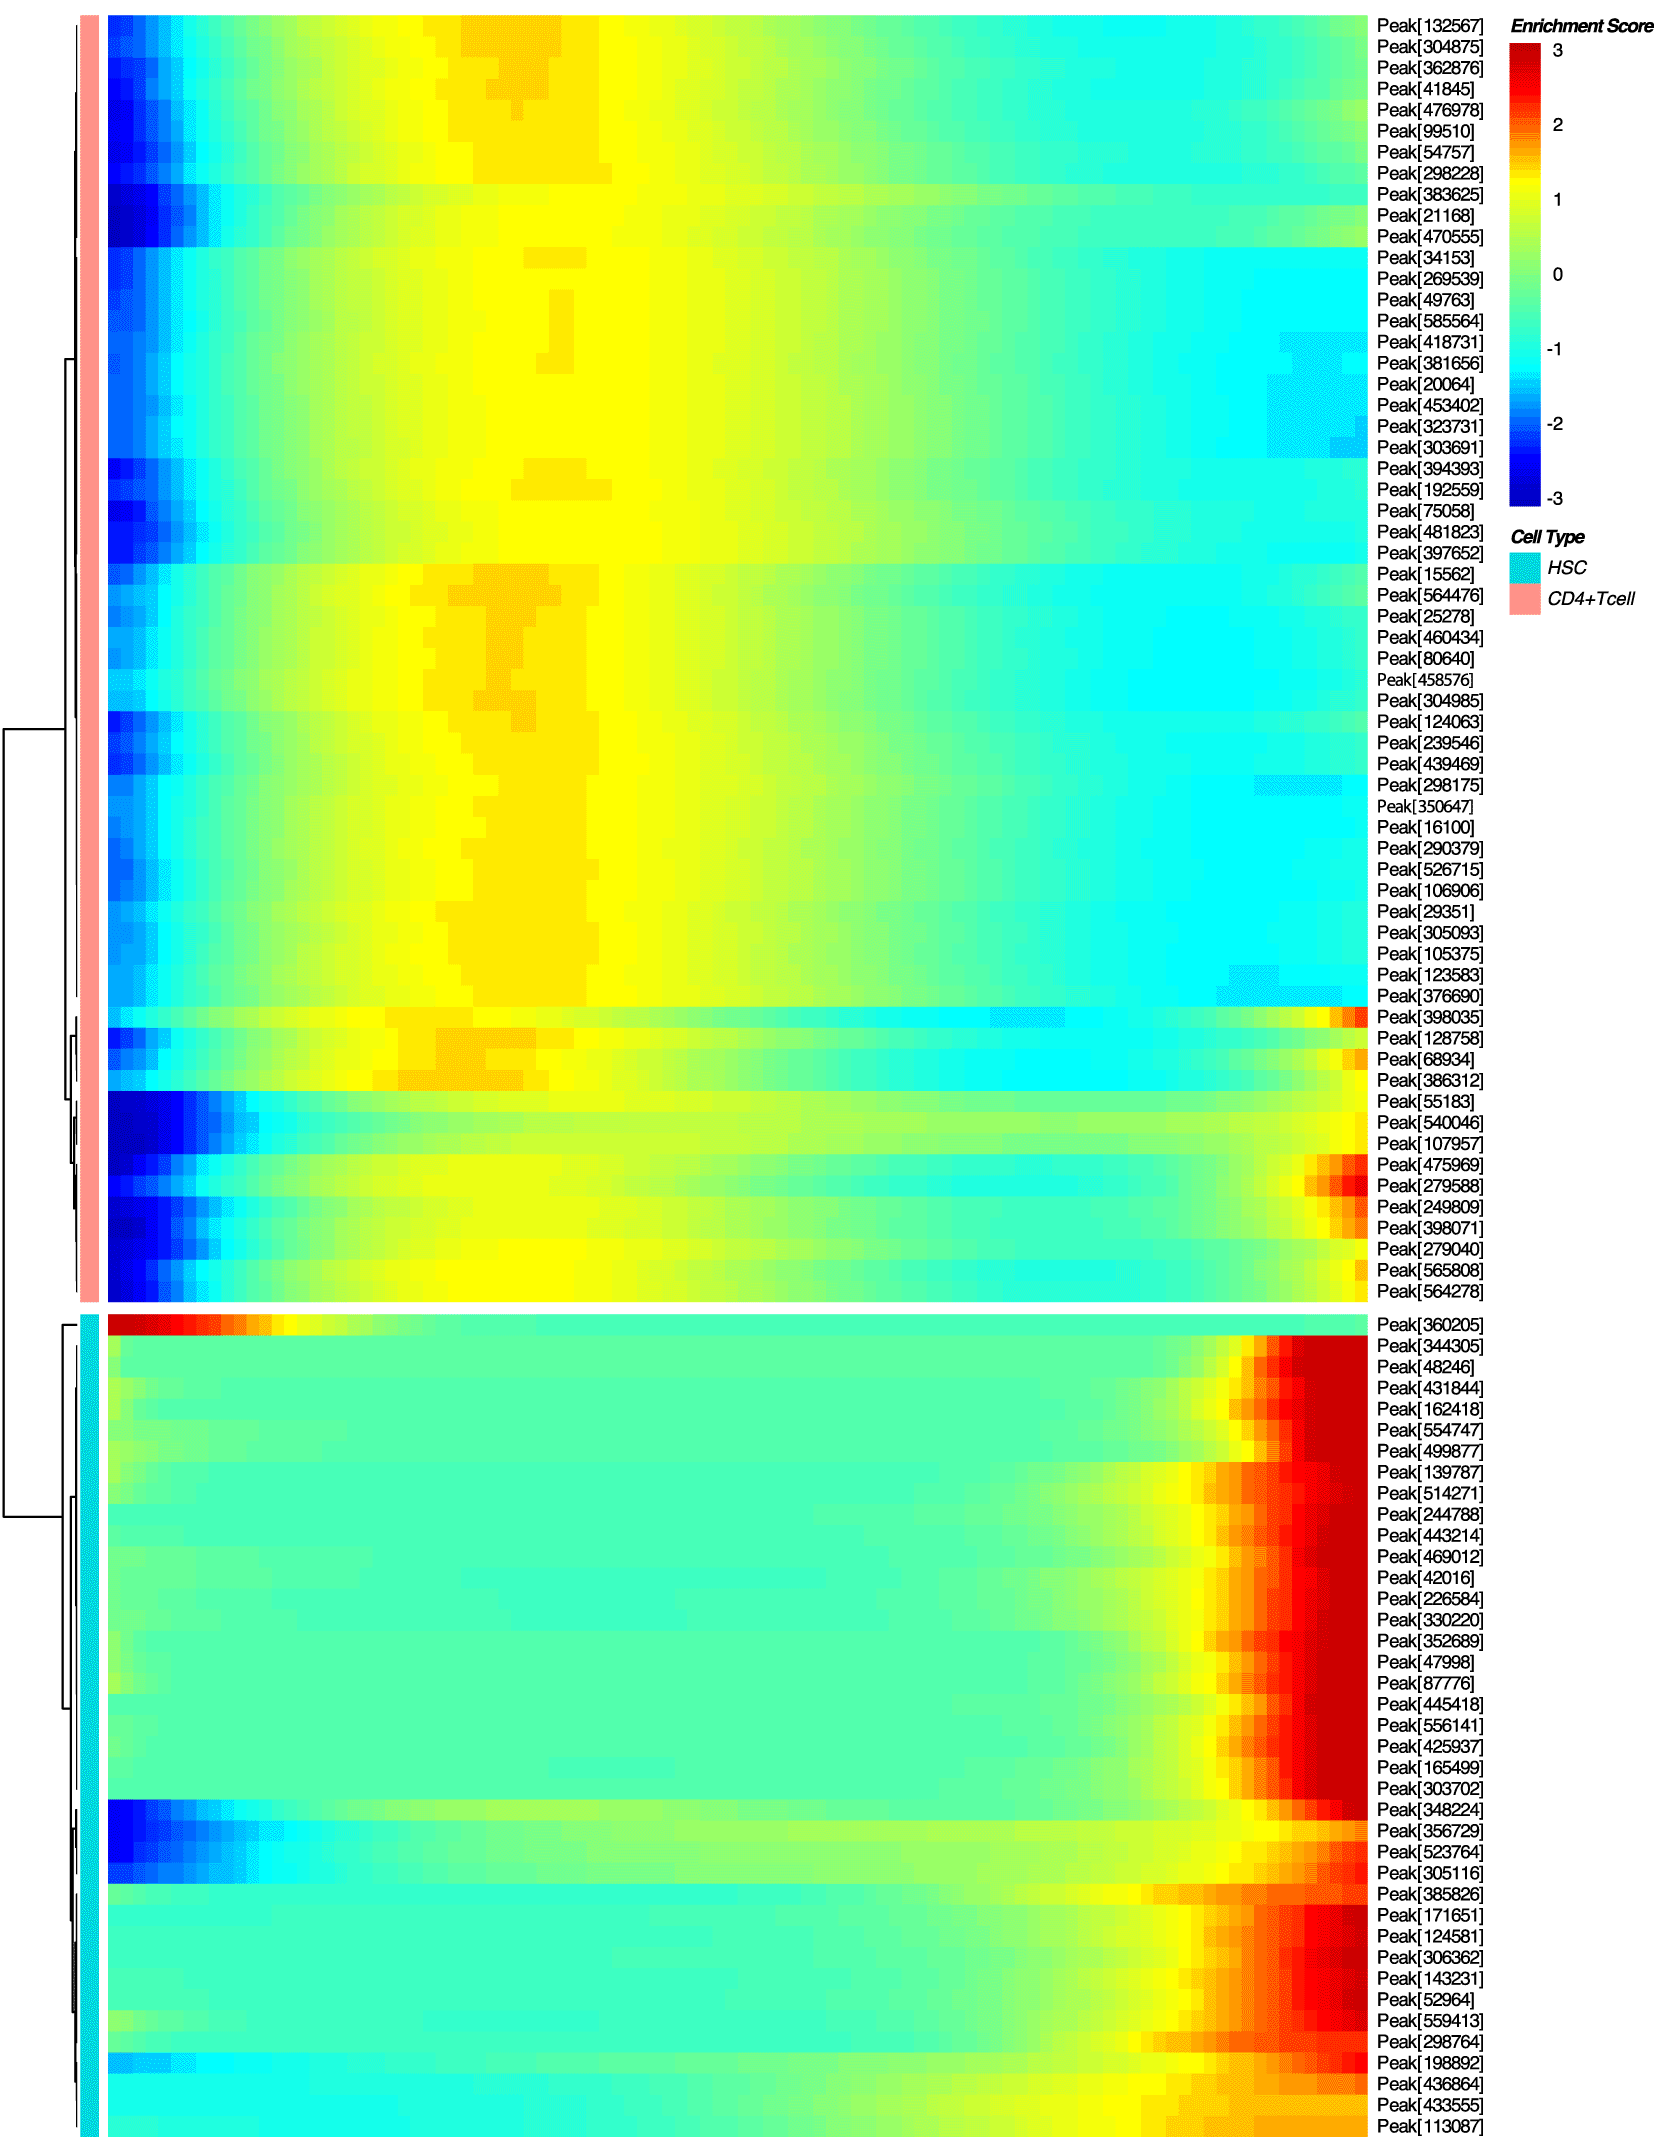
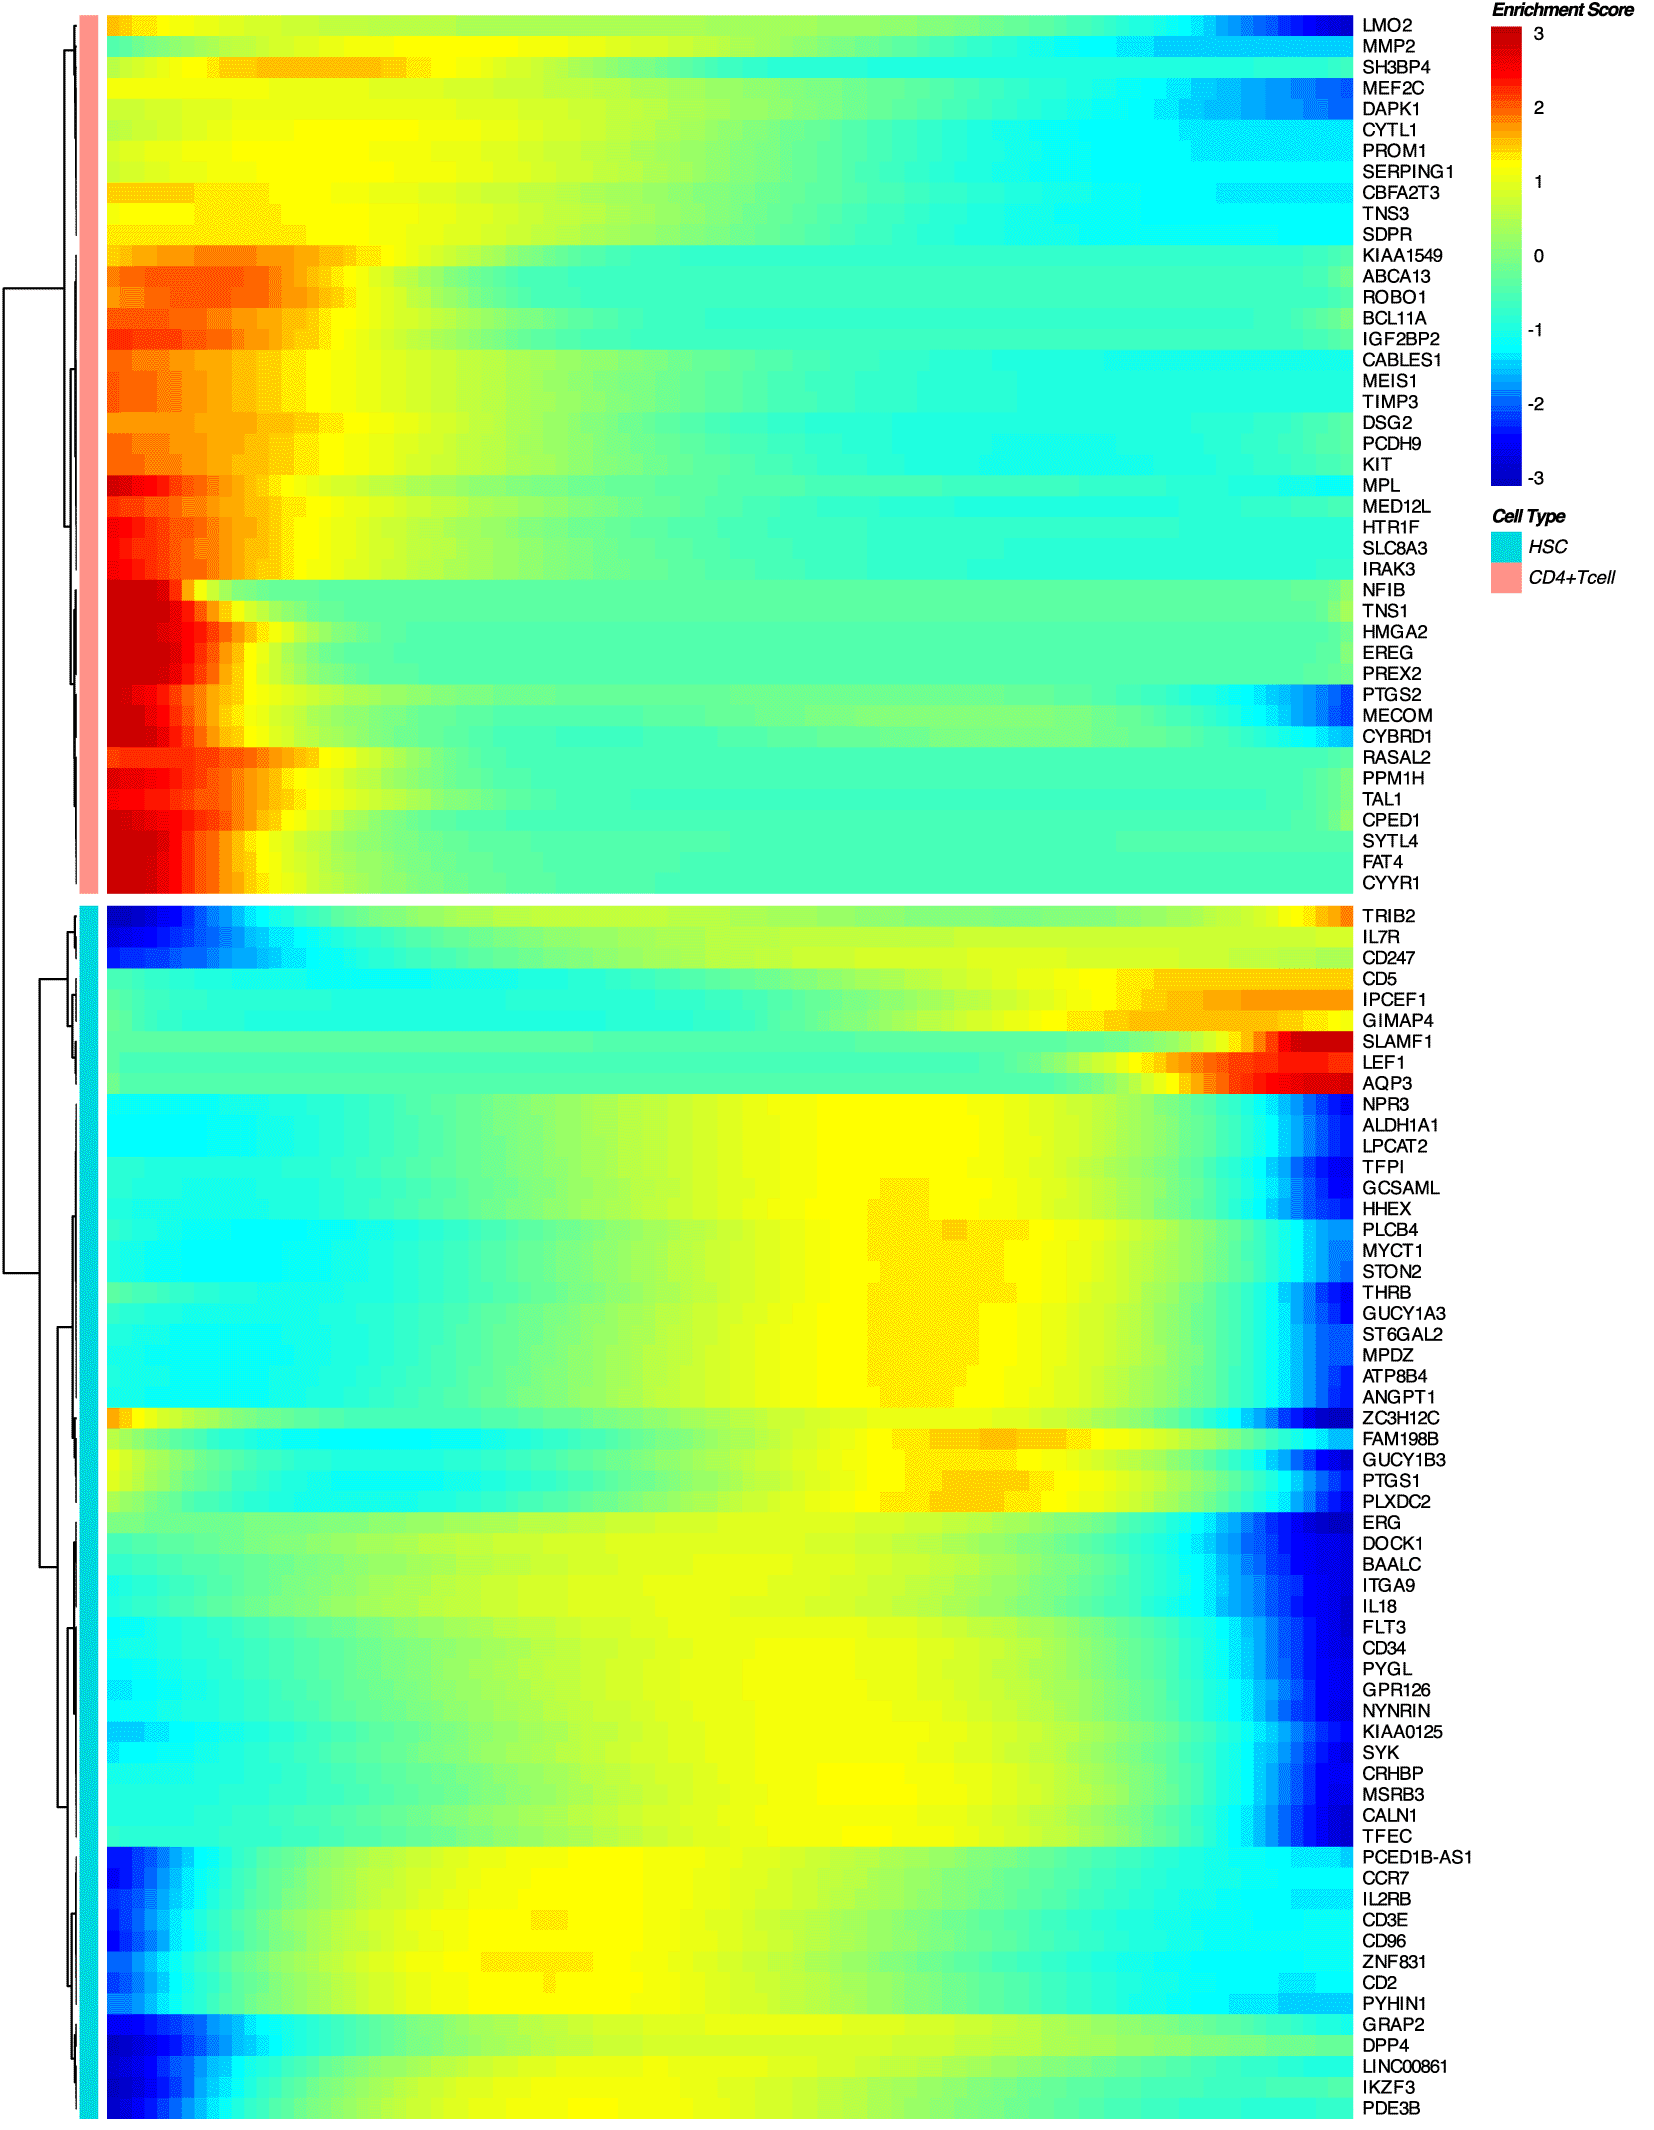
The proposed approach (Figure 1) consists of the following steps. First, for two given cell types involved in cell differentiation or conversion pathways, the minimal spanning tree (MST) is reconstructed based on the open chromatin in regulatory regions (Figure 2, Figure 3). Then, a differential accessibility analysis (DAA) between initial and final cell types is performed to retrieve a list of genomic regions (ATAC-seq peaks) ranked by the statistical significance of a change in chromatin accessibility for a given cell conversion (Figures 4, 5). Next, the sequences corresponding to each of the ranked regions undergo the functional annotation with TFBS. Finally, TFs ranking is inferred by GSEA,18 which was adjusted to estimate the tendency of TFBS for given TF under investigation to be over-represented at the most statistically significant genomic regions for a given cell differentiation or conversion.

HSC, hematopoietic stem cells; MPP, multipotentent progenitor; LMPP, lymphoid-primed multipotent progenitor; CLP, common lymphoid progenitor; NK, natural killer cells.


scATAC-seq data (GEO: (GSE96769, GSE111586)) were used to reconstruct the minimal spanning tree (MST) of hematopoietic cell types, the hierarchy of which was aligned along pseudo-time, reflecting a degree of pluripotency of the cells observed in the single-cell assay for transposable-accessible chromatin (scATAC-seq) dataset.15 Thus, the obtained MST presents a collection of possible cell trajectories among the analyzed cell types.
Similarly to DEG analysis,20 a differential accessibility analysis (DAA) of genomic regions was performed between two given cell types on the cell trajectory by hrefhttps://www.bioconductor.org/packages/devel/bioc/manuals/slingshot/man/slingshot.pdfSlingshot v2.3. Accordingly, for each cell population on the MST, such a subset of regions ranked by p-value can be obtained, discriminating given cell population from others.
We excluded from the downstream analysis TFs that had either a near-zero median expression (below 5% percentile) in the final cell type or had a higher expression in the original cell types based on scRNA-seq data (GEO: GSE74912). Thus, only TFs uniquely expressed in a final cell population were considered.
Genomic regions (scATAC-seq peaks from GSE74912) were listed and ranked based on the significance of DAA (p-value < 0.01) performed by Monocle2, and used for functional annotation by TFBS using position weight matrices (PWM, p-value < 0.0001) from the HOCOMOCO database.8
GSEA18 was modified to perform the TF ranking according to their significance for a given cell conversion.
Since TF sequence preferences and, therefore, the quantity of TFBS for each TF is different, TFs annotations are presented highly unequally in the regions ranking. Thereby, GSEA here was utilized to infer the degree of TFBS abundance at the top of the regions ranking for a given conversion.
Consequently, for GSEA, the genomic regions ranking annotated with TFBS was taken as a pre-ranked list of TFs and each separate factor as a signature gene set. The final TFs ranking obtained from GSEA, thus, represents the significance of distinct TFs for cell differentiation or conversion.
The proposed pipeline utilizes both transcriptomic and epigenenomic data at the single-cell resolution to search for core TFs that enable cell differentiation and conversion within the human hematopoietic system. The transcription factors rankings obtained (Table 1) suggest that the current approach is capable of predicting subsets of core TFs as well as reflecting their importance for cell differentiation and conversion between cells.
Herein, we described a method for integrating single-cell chromatin accessibility and gene expression data that can successfully select core TFs for cell differentiation and conversion in silico.
Gene Expression Omnibus: A Single-Cell Atlas of in vivo Mammalian Chromatin Accessibility, https://identifiers.org/geo: GSE111586
Gene Expression Omnibus:Single-cell epigenomics maps the continuous regulatory landscape of human hematopoietic differentiation [scATAC-Seq], https://identifiers.org/geo: GSE96769
Gene Expression Omnibus: ATAC-seq data, https://identifiers.org/geo: GSE74912
Analysis code available from: https://github.com/annykay/transFactorsPrediction
Archived analysis code as at time of publication: https://doi.org/10.5281/zenodo.5799254
License: MIT
The study was supported by Ministry of Science and Higher Education of the Russian Federation (agreement no. 075-15-2020-899).
| Views | Downloads | |
|---|---|---|
| F1000Research | - | - |
|
PubMed Central
Data from PMC are received and updated monthly.
|
- | - |
Is the rationale for developing the new method (or application) clearly explained?
Partly
Is the description of the method technically sound?
Partly
Are sufficient details provided to allow replication of the method development and its use by others?
Partly
If any results are presented, are all the source data underlying the results available to ensure full reproducibility?
No
Are the conclusions about the method and its performance adequately supported by the findings presented in the article?
No
References
1. Melton D: ‘Stemness’. 2014. 7-17 Publisher Full TextCompeting Interests: No competing interests were disclosed.
Reviewer Expertise: Cell biology, human cell reprogramming, regenerative biomedicine
Is the rationale for developing the new method (or application) clearly explained?
Yes
Is the description of the method technically sound?
Yes
Are sufficient details provided to allow replication of the method development and its use by others?
Partly
If any results are presented, are all the source data underlying the results available to ensure full reproducibility?
No
Are the conclusions about the method and its performance adequately supported by the findings presented in the article?
Partly
Competing Interests: No competing interests were disclosed.
Reviewer Expertise: Epigenetics, transcriptional control, bioinformatics
Alongside their report, reviewers assign a status to the article:
| Invited Reviewers | ||
|---|---|---|
| 1 | 2 | |
|
Version 1 13 Jan 22 |
read | read |
Provide sufficient details of any financial or non-financial competing interests to enable users to assess whether your comments might lead a reasonable person to question your impartiality. Consider the following examples, but note that this is not an exhaustive list:
Sign up for content alerts and receive a weekly or monthly email with all newly published articles
Already registered? Sign in
The email address should be the one you originally registered with F1000.
You registered with F1000 via Google, so we cannot reset your password.
To sign in, please click here.
If you still need help with your Google account password, please click here.
You registered with F1000 via Facebook, so we cannot reset your password.
To sign in, please click here.
If you still need help with your Facebook account password, please click here.
If your email address is registered with us, we will email you instructions to reset your password.
If you think you should have received this email but it has not arrived, please check your spam filters and/or contact for further assistance.
Comments on this article Comments (0)