Keywords
Firm Innovation Performance, Innovation Culture, Technological Capability, Customer and Supplier Relationship, Innovation Strategy, Organizational Capability
Firm Innovation Performance, Innovation Culture, Technological Capability, Customer and Supplier Relationship, Innovation Strategy, Organizational Capability
The telecommunication industry is one of Indonesia's most competitive and developing industries. It was claimed to be a prominent driver of the national economy.1 Therefore, it ultimately contributes to the efficiency and effectiveness of the National Budget, local industry, employment, national governance, and social development in science and telematics.
Indonesia Ministry of Communication and Informatics stated in 2019 that the number of significant telecommunication firms in Indonesia was 216 entities.2 Their service entails wired telecommunication service, the Public Switched Telephone Network (PSTN), and wireless telecommunication, including fixed wireless access (FWA), cellular network, and satellite network. Chief of Indonesia Telecommunication Association, Ririek Adriansyah, stated that by 2020 the telecommunication industry was able to show 7% positive growth.3
The Indonesian government body targeted the telecommunication industry as one of the priority industries to be developed in the government plan of national industry development 2015-2035.4 Within the report, the telecommunication industry development roadmap was separated into three phases: developing transmission-based telecommunication (radar and satellite) and smart mobile phones. The phases stipulate the development of requisite technologies, such as telecommunication and computation device integration, and high-speed wireless and optical infrastructure. Various resources are required to support industrial development, such as natural resources, human capital, innovation capability, and creativity, which ultimately lead to competitive industrial advantage.
Strategic Innovation Management refers to the whole innovative practice which involves competition mechanism analysis, such as creating an innovative vision, business strategy alignment, strategy dissemination to entire organization levels, market tendency, technology, and competitor actions. Since innovation became one of the primary resources required to develop the Indonesian telecommunication industry, this research aims to understand how strategic innovation management influences telecommunication firms’ innovation performance.
This research aimed to investigate the influence of innovation strategy, organizational structure, technological capability, and customer-supplier relationship, shown as the common practices of strategic innovation management in literature on firm innovation performance.5 Figure 1 illustrates how the variables interact as the basis of research hypotheses development.
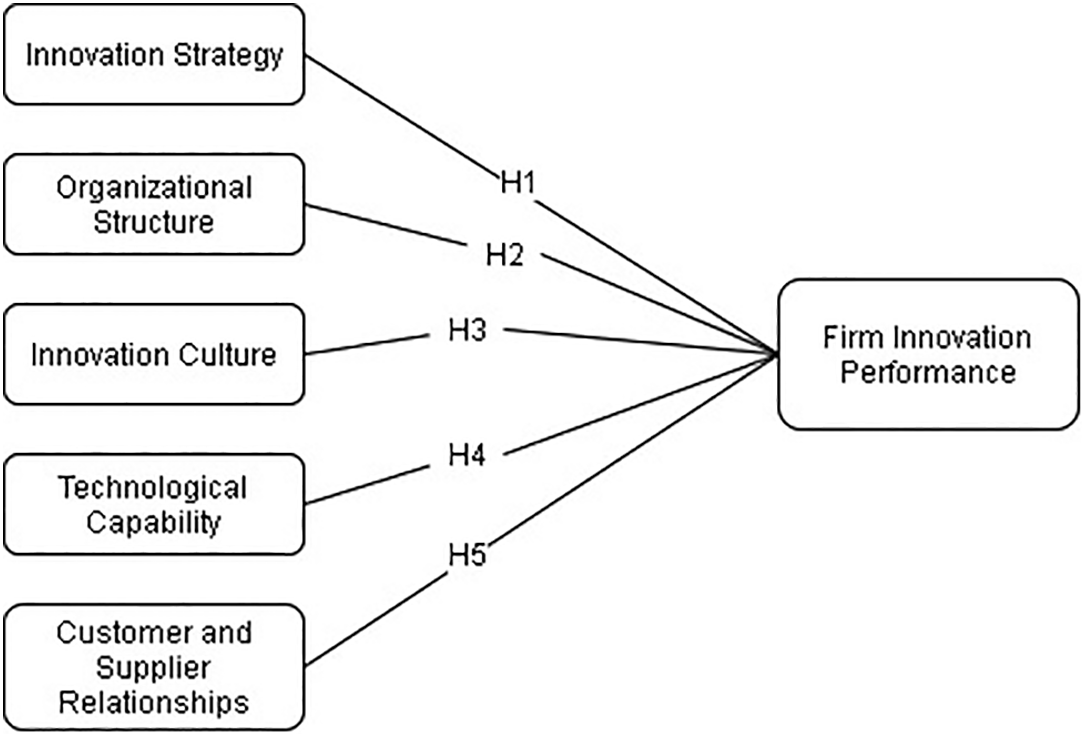
H1: Innovation strategy positively influences Firm Innovation Performance.
Various prior studies supported the first hypothesis.6,7 One prior study found that Innovation strategy positively influences Firm Innovation Performance.5 Indicating that firms implementing innovation strategy would increase their innovation performance better than those who do not.
H2: Organizational structure positively influences Firm Innovation Performance
Organizational structure was the second variable of strategic innovation management studied. Akhter et al.8 support the notion that organizational structure influences organizational performance. Therefore, the second hypothesis to test in this research indicates that individuals would perform their task better and become more productive with a clear structure.
H3: Innovation Culture positively influences Firm Innovation Performance
Next, this study would like to examine the relationship between innovation culture with firm innovation performance. The connection was investigated in prior research that found that the organization's higher innovation perception would lead to higher firm performance.9 The same notion was used as the third hypothesis in this study.
H4: Technological Capability positively influences Firm Innovation Performance
The fourth hypothesis was supported by prior research examining the influence of technological capability on firms’ financial and competitive performance.10 The research categorized a firm’s technological capability into technology intensity and technology diversity, in which case both are found to positively influence a firm’s performance.
H5: Customer and Supplier Relationships positively influence Firm Innovation Performance
A recent study found that supplier and customer relationships became one of the critical factors in business competition.11 Suggesting that firms should build, maintain, and engage better with their customer and supplier to excel in their industry.
This study employed a quantitative method with descriptive purpose. The study objects were the firms in the Indonesian telecommunication industry. Analysis was done on the organizational level. The study took place in 2021 with data collection taking place between April-July.
The population of research objects in this study were the firms in the Indonesian telecommunication industry listed in Indonesian Ministry of Communication and Informatics (Kominfo). A total of 843 firms were found and categorized in Table 1.2 The sample size was determined using Equation 1. With 10% margin of error, the formula resulted in a required sample size of 90 for the research.
| Firm category | Quantity | Sample size |
|---|---|---|
| Fixed Network | 195 | 21 |
| Wireless Network | 21 | 2 |
| Telecommunication Service | 517 | 55 |
| Special Telecommunication | 110 | 12 |
| TOTAL | 843 | 90 |
To ensure sample firms would be able to represent the industry subsector, a population proportional stratified random sampling technique was employed to obtain the required research samples using Equation 2. The firm categories were used as the basis for subpopulation determination. The sample size for each subpopulation is presented in Table 1. The sample firms amounted to the calculated sample size and were randomly selected out of the population list and described in Table 2.
Data was gathered with a questionnaire containing 43 questions adapted from a prior study.5 A copy of the questionnaire can be found under Extended data.12 The questionnaire was disseminated to sample firm representatives through company email, social media (Instagram and LinkedIn), and private message.
Bivariate Pearson technique were used to test the validity of the questionnaire. The questionnaire was disseminated to thirty respondents and tested with 5% degree of significance and R value of 0,361, resulting in 43 valid questions out of 47 total questions in the initial questionnaire. Consequently, the invalid question items were deleted from the questionnaire later disseminated to sample firms.
Descriptive analysis and structural equation model (SEM) analysis were used to analyze the data. This was used to measure the current implementation of measured variables.9 For each variables’ indicators, the result of respondents’ answers were divided by the ideal score of the questionnaire (score obtained when the respective maximum score answered each question). Afterward, the percentage score would be compared with the given category. A score between 25-43.75% meant the indicator was very lowly implemented; a score between 43.76-62.5% meant the indicator was lowly implemented; a score between 62.6-81.25% meant the indicator was highly implemented; Lastly, a score between 81.26-100% meant the indicator was very highly implemented.
To measure the correlation between variables, in order to determine significantly influencing variables, the Partial Least Square (PLS) method was chosen as the measurement method. This provides consistent and reliable results and can be applied to complex structural equation models with many constructs.11,13 With the absence of a requirement of normally distributed input data and a high requirement on sample size and distribution compared to covariance analysis.14,15 The PLS model consists of two components: the measurement model (outer model) and the structural model (inner model). The outer model relates the observed manifest variable to the latent variable, while the inner model describes the relationship between latent variables in the SEM-PLS model.
The outer model's evaluation criterias comprise convergent validity, discriminant validity, and reliability. Convergent validity is how a measure is positively correlated with alternative measures of the same construct. High outer loadings on the constructs indicate that the related indicators have many similarities captured by the constructs.16 An acceptable value for convergent validity is if the loading factor value was higher than 0.7 and the average variance extracted (AVE) value was higher than 0.5.17 Discriminant validity is the extent to which a construct is utterly different from other constructs by empirical standards. It will be considered acceptable if the square root AVE is greater than the inter construct correlation coefficient.18 Lastly, reliability is measured through composite reliability (CR) with the criteria of CR > 0.7, which means it has high reliability.
The inner model evaluated by the value of R2 and f.2 The value of R2 was used to measure the degree of change from the independent variable to the dependent variable. A higher R2 value indicates a better predictive capability of the model. F2 shows a change in the value of R2 in the endogenous construct.12 Changes in the value of R2 indicate whether the exogenous construct has a substantive effect on the endogenous construct. If the value of f2 < 0.02, then the effect of exogenous latent variable is insubstantial, 0.02 < f2 < 0.15 is weak, 0.15 < f2 < 0.35 is moderate and f2 > 0.35 is a strong category.
Table 3 summarizes the descriptive analysis of the respondents’ answers. For each studied variable, the total score obtained from the questionnaire was divided by the ideal score for the given question. They resulted in a percentage score on how each variable can achieve the desired score. The descriptive analysis result indicates that strategic innovation management has been highly implemented in Indonesia's telecommunication industry.
| Variables | Score | Criteria |
|---|---|---|
| IS | 99.80% | Very High |
| OS | 96.80% | Very High |
| IC | 90.90% | Very High |
| TC | 97.90% | Very High |
| CSR | 98.84% | Very High |
| FIP | 94.46% | Very High |
SEM-PLS analysis tested the hypotheses developed in this research through the conceptual model depicted in Figure 2. The model consisted of the measurement model (outer model) and structural model (inner model). In the outer model, we evaluate the convergent validity, discriminant validity, and internal consistency. At the same time, the inner model was evaluated using R2 and coefficient path or T-values.
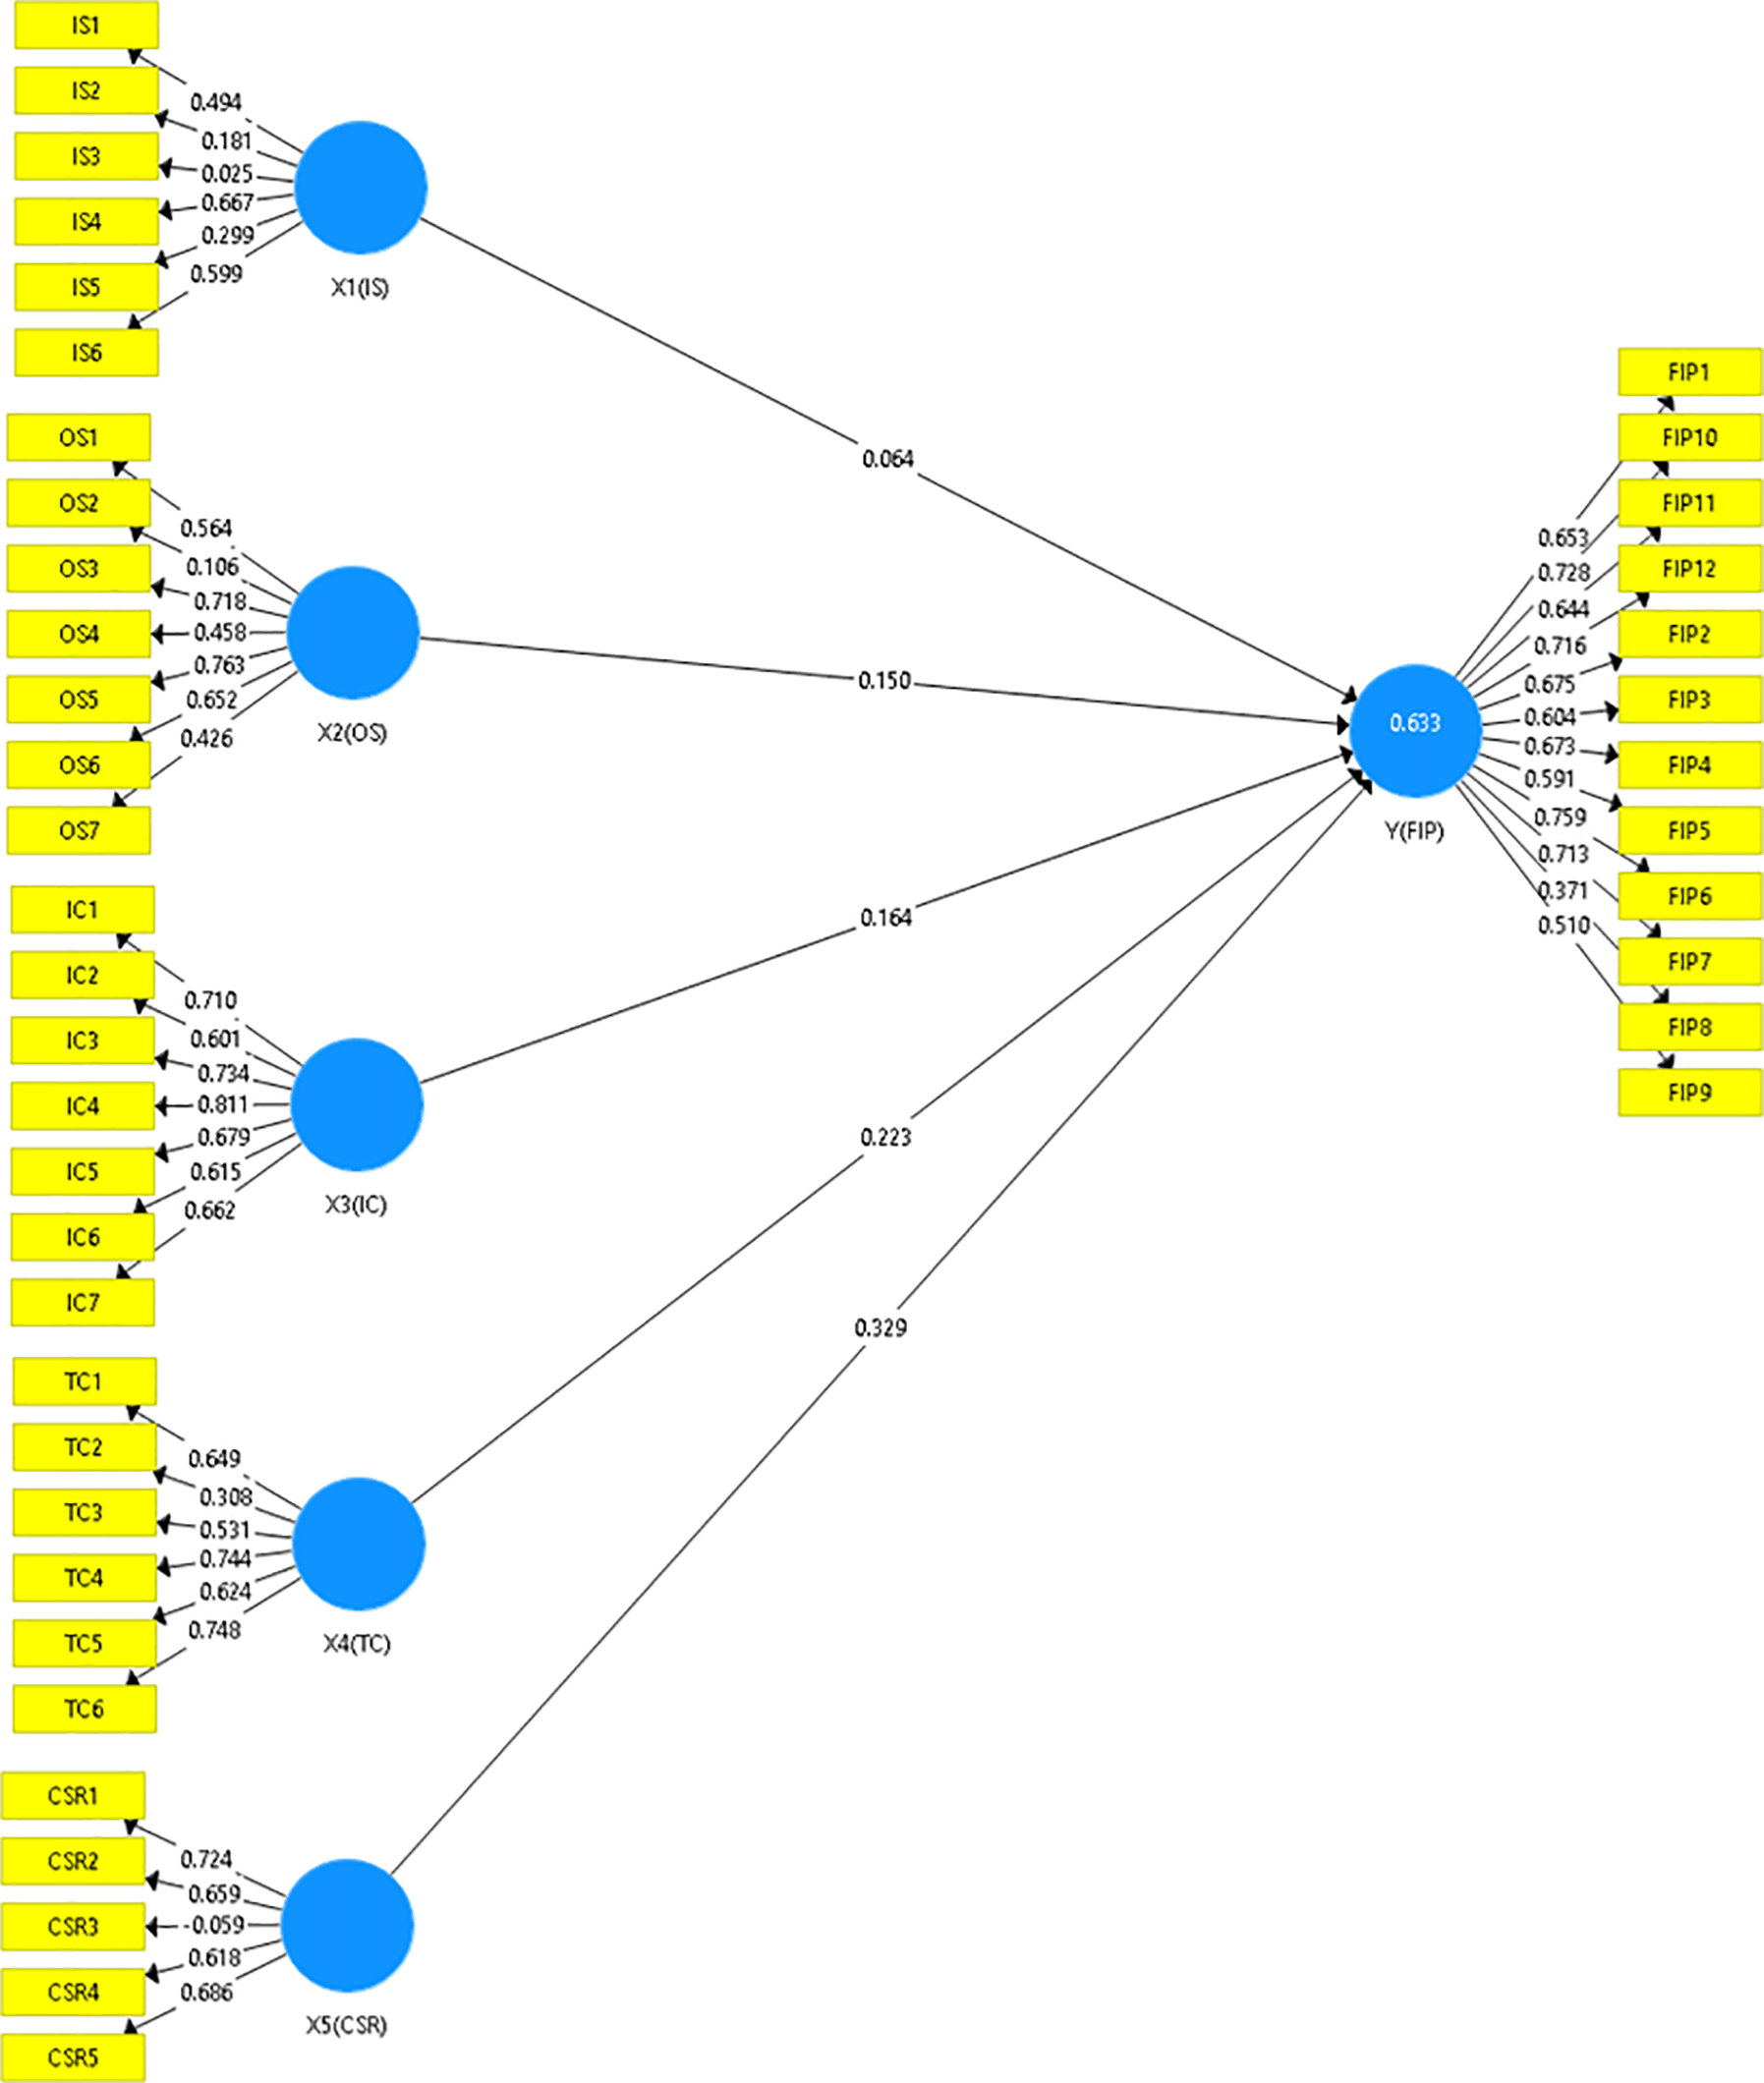
The measurement model evaluated the validity and reliability of the model developed in this study. Loading factor, internal consistency (Cronbach’s α and composite reliability/CR), and the value of average variance extracted (AVE) were the criteria used to determine the convergent validity of this research instrument. At the same time, cross-loading value and Fornell-Lacker criterion were used to determine the discriminant validity of this research instrument.
The loading factor shows the correlation between an indicator score and to construct indicator score of the given construct. An indicator should be valid as a research instrument if the loading factor value is higher than 0.7.19 The development of variables indicators was iterated several times before finding valid research indicators described in Table 4.
Cronbach’s α and composite reliability (CR) were used as criteria to determine the reliability of research variables. Although Cronbach’s α was a frequent measurement used,20 CR was the main criterion in this research considering CR does not assume the weight equality of each indicator. The result of Cronbach’s α and CR value of the research variables is shown in Table 5. The result indicates that the variables were internally consistent, considering the value of Cronbach’s α or CR was higher than 0.7.
The last criteria to determine the research instruments' convergent validity was the value of average variance extracted (AVE). Table 6 shows the result of the AVE test for every research variable used. The AVE value of all research variables was higher than 0.5, indicating that the research instruments fulfill the criteria of convergent validity.
The discriminant validity test of research instruments was conducted by observing the value of cross-loading of variable indicators. The cross-loading value shows the correlation of each construct from the same indicators and with the other indicators. A measurement model should be discriminantly valid if the correlation value within the same indicator is higher than the correlation value outside the indicator. The result cross-loading test of this research instrument is shown in Table 7. The bold numbers in the table mark the inter-indicator correlation. As the correlation value intra-indicator was higher than inter-indicator, these research instruments were found to fulfill the criteria to be discriminantly valid.
Lastly, the research instrument was tested using the Fornell-Lacker criterion to determine its discriminant validity. Table 8 shows the result of the test. The bold numbers were the square root value of AVE, while the numbers under them were the correlation value between the constructs. Because the square root value of AVE was higher than the correlation value, this research instrument should fulfill the criteria to be discriminantly valid.
The second test in evaluating the SEM-PLS model was its structural model (inner model). The structural model was evaluated by observing the value of R2 for the dependent construct and the t-statistics value from the path coefficient test. The R2 value indicates the variance of the dependent variable caused by independent variables. This research found that the R2 value of the dependent variable amounted to 0.540. It indicated that 54% of changes in firm innovation performance were caused by strategic innovation management.
SEM-PLS model developed in this research was further evaluated by the f2 value to determine the degree of effect for each studied variable. Table 9 describes the result of the f2 test for each variable. The degree of effect indicated by the f2 value was categorized as follows: a value between 0.02-0.14 was weak, a value between 0.15-0.34 was moderate, and a value higher than 0.35 was strong. This research found that only CSR had a moderate effect on FIP from the four independent variables, while the others had a weak effect on FIP.
This research studied the effect of strategic innovation management on firm innovation performance under five research hypotheses, representing how the implementation of strategic innovation management influences firm innovation performance. Figure 3 shows the SEM-PLS model developed in this research. Furthermore, Table 10 describes the model's interpretation in testing the hypotheses. The rules of thumb used in this research were a hypothesis rejected if its path coefficient value was higher than 1.96 and the significance level (p-value) was higher than 0.05.
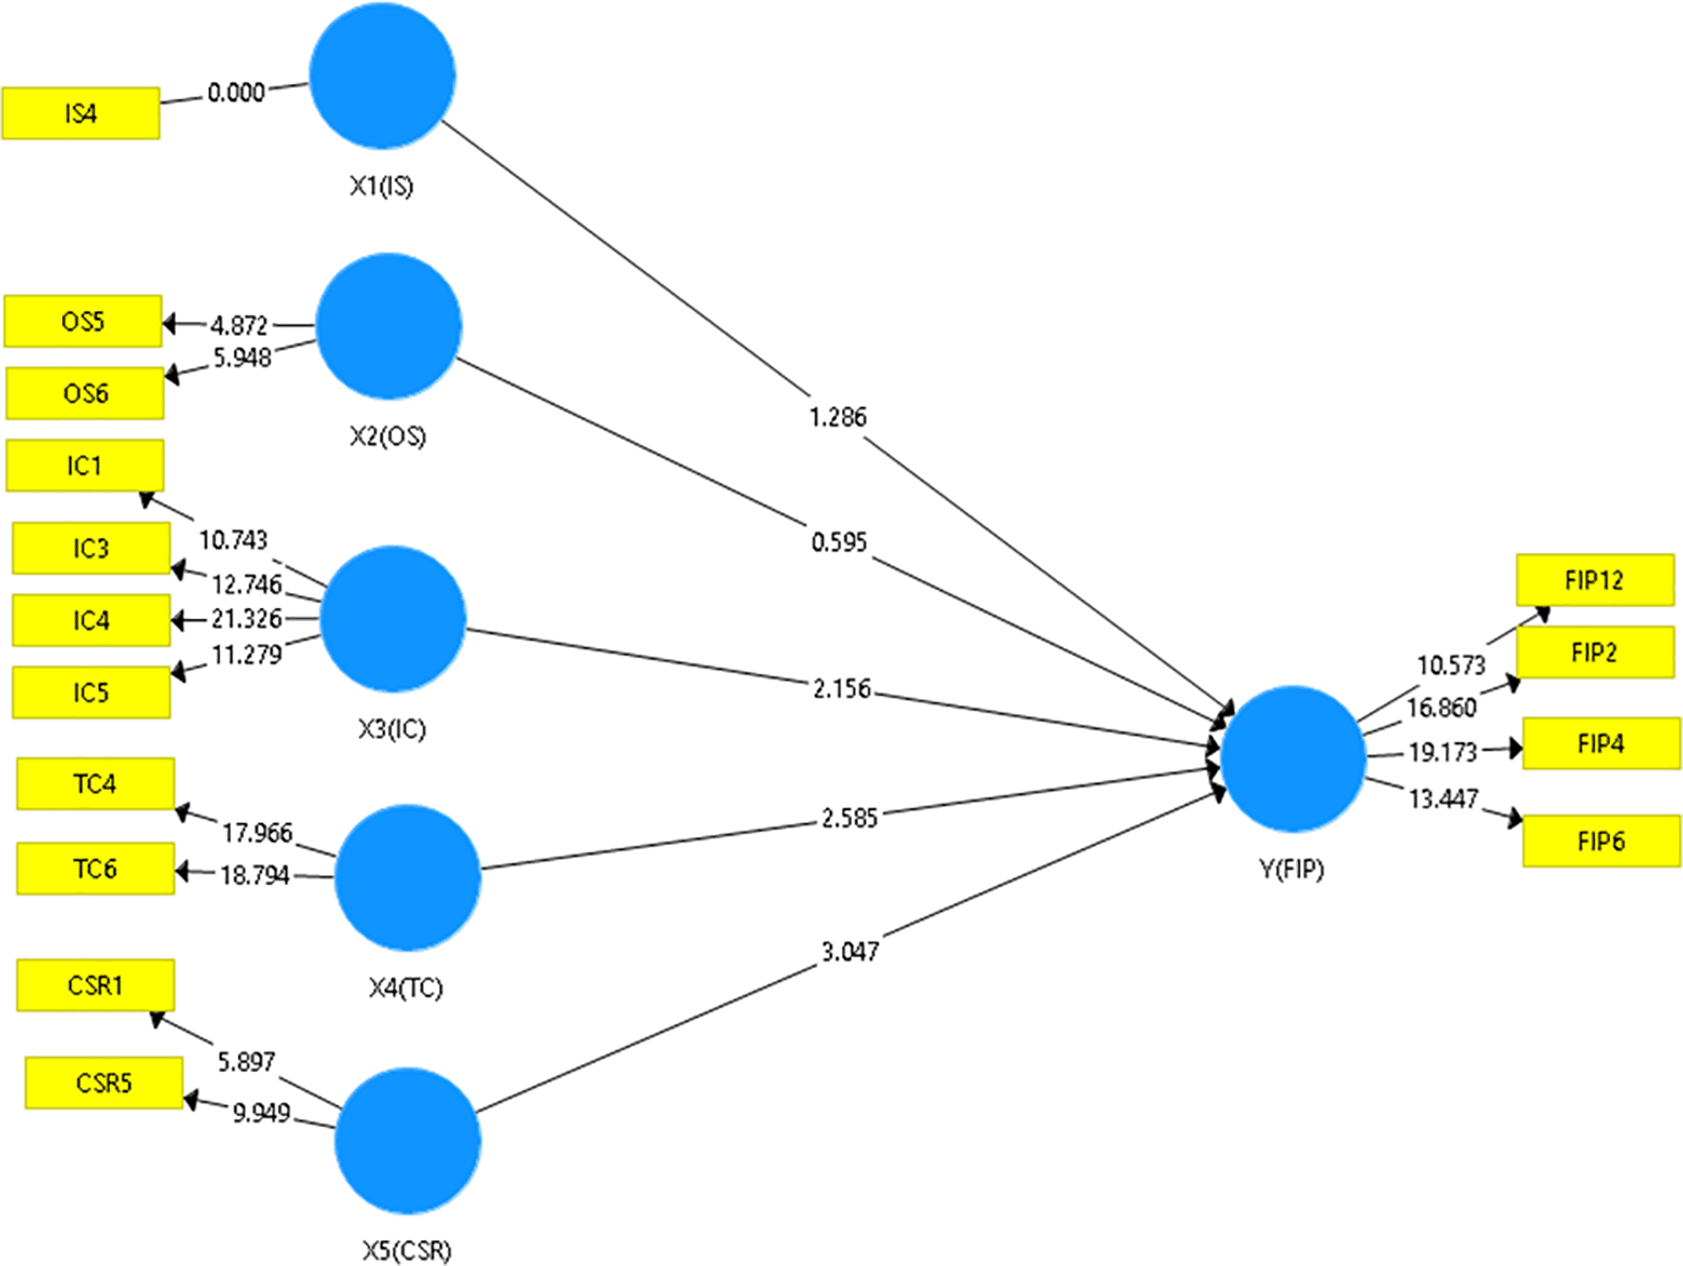
From the hypotheses test result presented in Table 10, we can conclude that innovation strategy as a research variable had no significant positive influence on firm innovation performance. Innovation strategy was the highest level of innovation practice that includes creating an innovative vision, business strategy alignment, strategy dissemination to entire organization levels, market tendency, technology, and competitor actions. Diving more into respondent characteristics, we could observe the probable cause of the test result. The absence of strategic implementation of innovation in the mid-size firms in the Indonesian telecommunication industry presumably became the source of our finding regarding the relationship between innovation strategy and firm innovation performance.
Next, the test results implied that organizational structure was not found to have a positive influence on firm innovation performance. Numerous firms within the Indonesian telecommunication industry were yet to have the capability of cross-functional responsibility. It was a novel capability to ensure strategic decision making, conflict resolution, and effective coordination in the innovation process.
On the other hand, a positive influence was implied from the test results between innovation culture towards firm innovation as research variables. The main concept of innovation in culture is creativity, openness, acceptance of new ideas, risk-taking attitude, and entrepreneurial mentality. Indonesian telecommunication firms promote risk-taking behavior, appreciate success, and are open to innovation by giving their employees a certain degree of independence to experiment.
The second accepted hypothesis was the positive influence of technological capability on firm innovation performance. Technological capability is defined as a firm's ability to conduct technical and business activities, including the efficient development of new products or processes, implying that the more firms develop their technological capability, the better they perform strategic innovation. Indonesian telecommunication firms have shown an excellent technological capability to answer customers’ needs. However, some could not maximize their capability due to their size and age.
Innovation drove firms to have a market-based perspective. Evaluating customers and suppliers as partners would allow firms to maximize efficiency in exploiting rare resources and developing current capabilities. Lastly, customer and supplier relationships were found to influence firm innovation performance positively. The Indonesian telecommunication industry is indicated to have shown excellent capability in managing their relationship with their customers and suppliers.
The implementation of strategic innovation management in the mid-size firms of the Indonesian telecommunication industry was high. In the overall response of 94 respondents it was found that they had been implementing strategic innovation management at almost 96%. The result of this research implies that the Indonesian telecommunication industry had the capability to compete strategically, by investigating their innovation strategy, organizational structure, innovation culture, technological capability, and customer and supplier relationship.
Telkom University Dataverse: The Influence of Strategic Innovation Management on Firm Innovation Performance in Indonesian Mid-Size Telecommunication Industry. https://doi.org/10.34820/FK2/CDBQPC.12
This project contains the following underlying data:
This project contains the following extended data:
- Blank Research Questionnaire.pdf (The blank version of the questionnaire distributed to respondents)
- Kuesioner Riset.pdf (The original Indonesian version of the questionnaire distributed to respondents)
Data are available under the terms of the Creative Commons Zero “No rights reserved” data waiver (CC0 1.0 Public domain dedication).
The authors declared that this work was approved by the Dean of School of Economic and Business Telkom University with letter No. 020/PNLT1/EB-DEK/2021.Written informed consent for publication of the participants’ details and/or their images was obtained from the participants.
Conceptualization, R.R., B.M., L.U.; methodology, R.R., B.M., L.U.; software, L.U.; data curation, R.R., L.U.; visualization, L.U.; validation, R.R., B.M.; analysis, R.R., B.M., L.U.; writing – original draft preparation, R.R., B.M.; writing – review & editing, R.R., B.M., L.U.; project administration, B.M.; supervision, R.R. All authors have read and agreed to the published version of the manuscript.
| Views | Downloads | |
|---|---|---|
| F1000Research | - | - |
|
PubMed Central
Data from PMC are received and updated monthly.
|
- | - |
Provide sufficient details of any financial or non-financial competing interests to enable users to assess whether your comments might lead a reasonable person to question your impartiality. Consider the following examples, but note that this is not an exhaustive list:
Sign up for content alerts and receive a weekly or monthly email with all newly published articles
Already registered? Sign in
The email address should be the one you originally registered with F1000.
You registered with F1000 via Google, so we cannot reset your password.
To sign in, please click here.
If you still need help with your Google account password, please click here.
You registered with F1000 via Facebook, so we cannot reset your password.
To sign in, please click here.
If you still need help with your Facebook account password, please click here.
If your email address is registered with us, we will email you instructions to reset your password.
If you think you should have received this email but it has not arrived, please check your spam filters and/or contact for further assistance.
Comments on this article Comments (0)