Keywords
Subsemble, scRNA-seq, machine learning, deep learning, supervised, classification, ensemble, cell-type annotation
This article is included in the Bioinformatics gateway.
This article is included in the Cell & Molecular Biology gateway.
This article is included in the Machine Learning in Genomics collection.
This article is included in the Single-Cell RNA-Sequencing collection.
Subsemble, scRNA-seq, machine learning, deep learning, supervised, classification, ensemble, cell-type annotation
Transcriptomic analyses are an increasingly important method to characterize biological processes, cell lineages, and the genetic profiles of cell states by quantifying all of the RNA in a cell population (Wirka et al., 2018). The advent of single-cell RNA sequencing (scRNA-seq) has increased the resolution to which analyses of cell type heterogeneity can be used to identify rare cell populations, reveal gene regulation networks, as well as trace cell lineages and map their fates (Hwang et al., 2018; VanHorn & Morris, 2021). Moreover, the growth in the number of scRNA-seq datasets and the resulting need to annotate cell type labels for each cell in these datasets remains a time and labor-intensive task. Automation of cell type annotation has previously been addressed using supervised (e.g. scPred (Alquicira-Hernandez et al., 2019), ACTINN (Ma & Pellegrini, 2019), LAmbDA (Johnson et al., 2019)), semi-supervised (e.g. CALLR (Wei & Zhang, 2021), semiRNet (Dong et al., 2022), scNym (Kimmel & Kelley, 2021)) and unsupervised (e.g. ScType (Ianevski et al., 2022), UNIFAN (Li et al., 2022), cellVGAE (Buterez et al., 2022)) machine learning methods.
Standalone machine learning classifiers and classical statistical methods used to annotate cell types may not be able to de-noise and fully leverage the complex parameter space from high-dimensional scRNA-seq datasets in order to make accurate, robust predictions (Asada et al., 2021). In comparison, deep learning classifiers are prone to overfit on training data, especially in cases where imbalanced classes lead to increased classification performance when tested on majority classes while trading for reduced classification performance when tested on minority classes (Oller-Moreno et al., 2021). Data augmentation using statistical techniques such as Synthetic Minority Oversampling Technique (SMOTE) (Chawla et al., 2002) and more complex generative adversarial network models (Marouf et al., 2020) can be used to generate realistic observations needed to correct for class imbalance that may lead to suboptimal machine learning classification performance (Krawczyk, 2016).
Ensemble learning involves aggregating predictions from multiple individual machine learning classifiers to improve overall classification performance (Dietterich, 2000). Moreover, ensemble classifiers can be optimized by weighting the contribution of individual classifiers to the final prediction based on their historical performance (Akhter et al., 2021). For instance, previous studies have shown that ensemble machine learning models outperform individual machine learning classifiers when tasked with detecting doublets (Xiong et al., 2022), predicting RNA velocity (Wang & Zheng, 2021), clustering cells (Geddes et al., 2019), and impute read counts of dropout events (Lu et al., 2021) using scRNA-seq data as input.
The Subsemble is a subset ensemble prediction method that has been proposed to be scalable to large datasets by training individual classifiers on data subsets in parallel, employs a multi-layer model architecture that re-weights the contribution of individual classifiers to optimize the final prediction, and has been shown to consistently outperform individual classifiers across multiple test datasets (Sapp et al., 2014). The Subsemble improves model fit to the training data by combining subset-specific fits from multiple individual classifiers into a single meta prediction (Sapp et al., 2014).
Here, we introduce a novel proof of concept of the Subsemble supervised classifier coupled with a feature normalization and upsampling pipeline to accurately predict cell type labels from single-cell gene expression data (RRID: SCR_022784). First, we identified a novel feature normalization and upsampling pre-processing pipeline that optimized classification performance of a baseline support vector classifier. Second, we compared the supervised classification performance of the proposed pre-processing pipeline and Subsemble classifier to predict cell type labels from gene expression data against nine other machine learning classifiers, deep learning classifiers, and an existing cell type annotation method using a 10-fold stratified cross-validation scheme and five classification performance metrics. Third, we tested if information loss from the training data when using five-fold, 10-fold and 20-fold stratified cross-validation schemes affected classifier performance. Fourth, we benchmarked classifier performance when trained on gene expression data associated with one subset of patients and trained on a second subset of patients using a leave-one-out cross-validation scheme within the same dataset.
Two scRNA-seq datasets with cell type labels were used to evaluate the classification performance of the proposed Subsemble classifier compared to existing machine learning-based classifiers. Each dataset was formatted as one cell by gene expression matrix and one table that mapped each cell to a known cell type label. The two datasets were downloaded using the TMExplorer tool (Christensen et al., 2022).
The first scRNA-seq dataset from Li et al. (2017) was sourced from 11 primary colorectal tumors. The dataset consisted of the read count matrix associated with 359 cells and 57,241 genes as well as the cell type label of each cell. Cells were labelled with one out of five possible cell type labels. This dataset was used to test if different data pre-processing steps of the model training dataset, such as log-transformation and Synthetic Minority Oversampling Technique (SMOTE) upsampling, would increase Subsemble classification performance compared to training the same model with the raw read counts.
The second dataset from van Galen et al. (2019) was sourced from 40 bone marrow aspirates of 16 acute myeloid leukemia patients. The dataset consisted of the read count matrix associated with 22,284 cells and 27,899 genes as well as the cell type label of each cell. Cells were labelled with one out of six possible cell type labels. First, this dataset was used to evaluate the 10-fold, stratified, cross-validated performance of the proposed Subsemble classifier across five different performance metrics compared to nine different machine learning and deep learning-based classifiers. Second, this dataset was also used to evaluate the leave-one-out cross-validated performance of the proposed Subsemble classifier when trained on a dataset subset associated with all but one patient and tested on a dataset associated with the hold-out patient.
Each of the two scRNA-seq expression datasets was reduced to 100 principal components using principal component analysis, log-transformed, and upsampled using SMOTE to generate balanced classes based on cell type labels.
The proposed Subsemble model is a supervised ensemble-based classifier that partitions the training scRNA-seq expression dataset into 10 subsets, outputs the probability that each cell belongs to a known cell type class assigned by one base layer of multiple different machine learning and deep learning classifiers on each subset, and fits one meta layer consisting of one machine learning classifier on the cell type class probabilities (Figure 1) (Chen & Shoostari 2022a). The base layer consists of one XGBoost classifier, one Random Forest classifier, one Multi-layer Perceptron classifier, and three Support Vector classifiers initialized with three different kernels (linear, third-degree polynomial, and radial base function). The meta layer consists of one Support Vector classifier initialized with the radial base function kernel. The trained Subsemble model can then be used to predict the cell type of an unknown cell from expression data (see Figure 1 for model architecture schematic). The Subsemble model does not predict class probabilities associated with each cell.
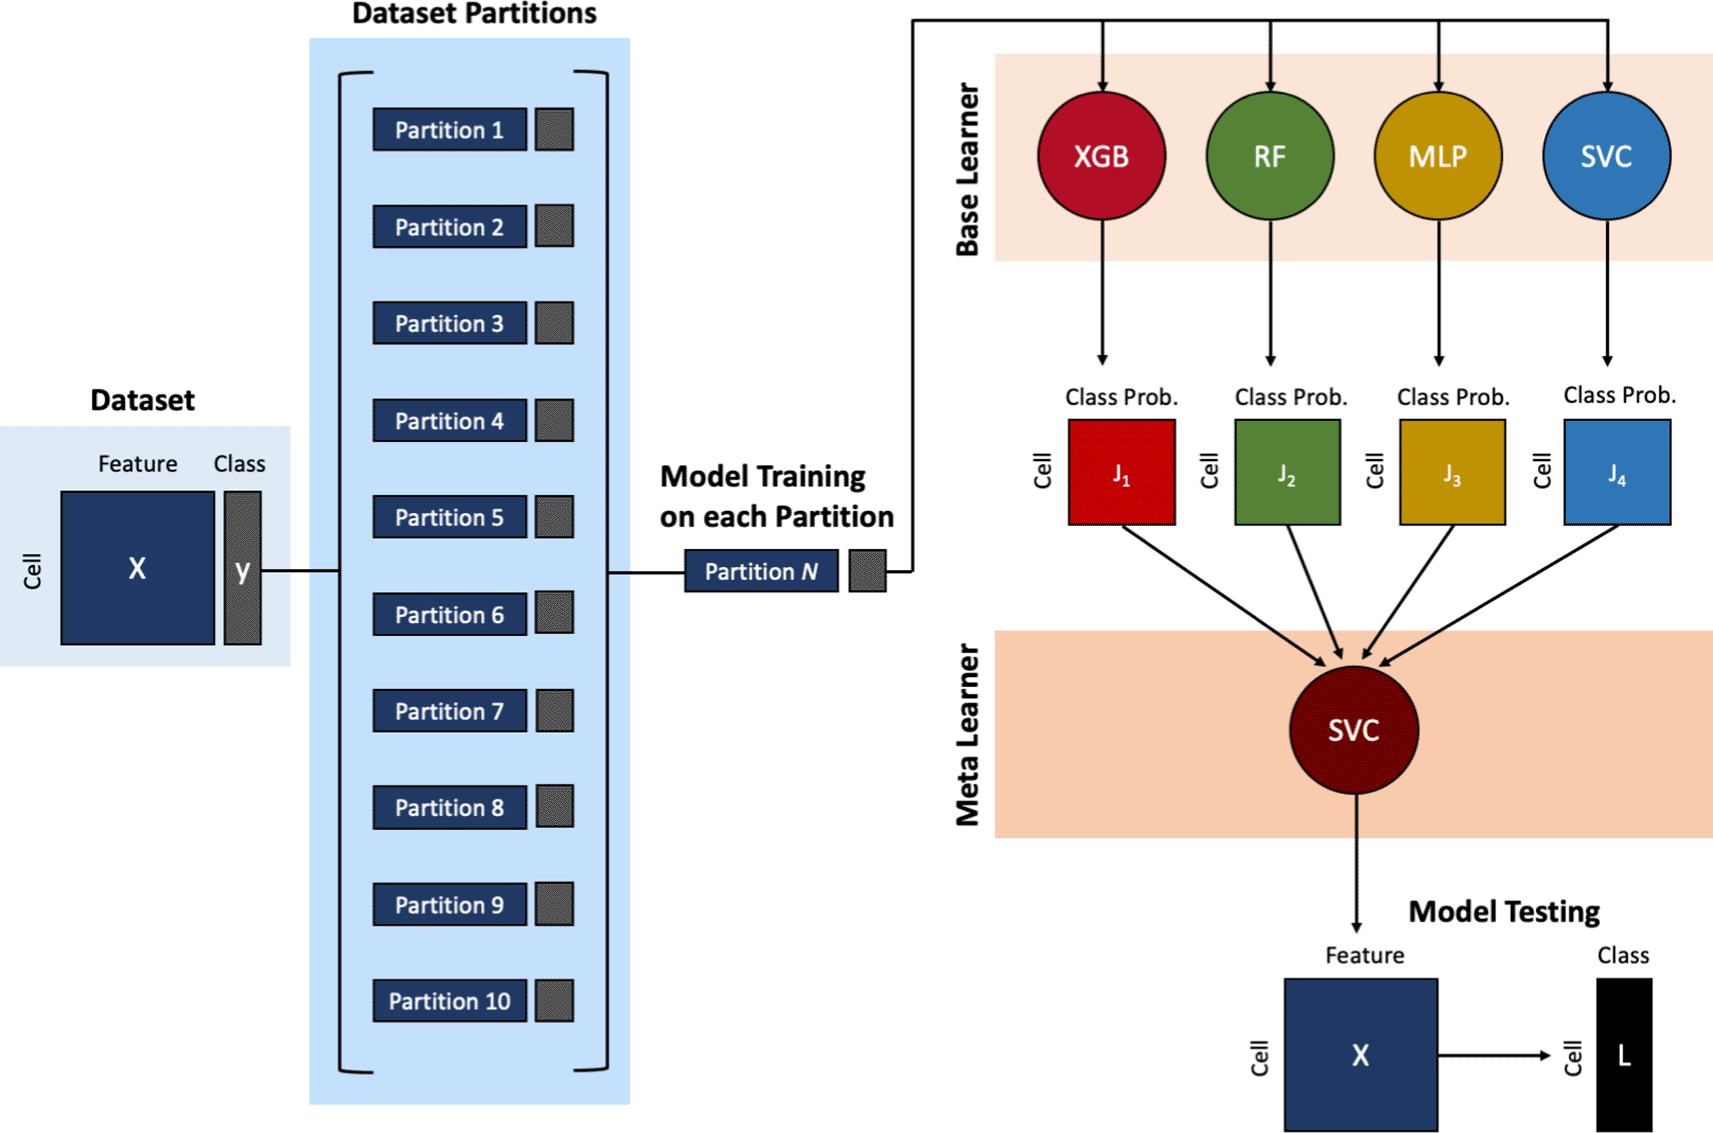
A single cell gene expression matrix with known cell type labels is used to train the Subsemble classifier. First, the training dataset is randomly partitioned into 10 random subsets. Second, the Subsemble classifier is trained individually on each subset and the predictions from each subset are pooled together to make a final cell type prediction when used to predict cell type from the testing dataset. Four types of base learners, including XGBoost (XGB), Random Forest (RF), Multi-layer Perceptron (MLP), and Support Vector Classifier (SVC), are trained on each subset of the training dataset. The output of each base machine learning classifier is the class probability that the cell belongs to each of the known cell type labels. Next, the meta learner Support Vector Classifier (SVC) is trained on the output class probabilities from the base learners for each cell across the 10 random subsets of the training dataset. Third, a single cell gene expression matrix without known cell type labels is used to test the Subsemble classifier. The Subsemble classifier will make a single prediction of a known cell type label observed in the training dataset.
Five performance metrics were used to evaluate the classification performance of the proposed Subsemble classifier compared to known machine learning classifiers such as Naïve Bayes (NB), AdaBoost (ADA), Decision Tree (DT), K-nearest Neighbors (KNN), Random Forest (RF), and Support Vector Classifier (SVC), an extreme gradient boosting classifier (XGBoost), a deep learning classifier (Multi-layer Perceptron), and a deep learning-based annotation method (ACTINN). Classification performance metrics associated with classifier were generated for each fold in the dataset cross-validation scheme and repeated five times. The same random seed was used to generate the same folds in each cross-validation scheme. The same dataset pre-processing steps were used to process the input data used to benchmark each classifier and ensure that the difference in classification performance can be attributed to the classifier used. Classification performance metrics are reported as the median value across all repeats and folds of the cross-validation scheme used.
‘Accuracy’ measured the number of correct predictions made by the classifier divided by the total number of predictions made. ‘Precision’ measured the number of true positives divided by the number of true positives and the number of false positives. ‘Recall’ measured the number of true positives divided by the number of true positives and the number of false negatives. ‘F1-score’ measured the product of precision and recall multiplied by two, then divided by the sum of precision and recall. Matthew’s Correlation Coefficient was used to measure classifier performance (Matthews, 1975) and is known to fairly represent classifier performance tested on imbalanced datasets (Chicco et al., 2021).
To rank the classification performance of the nine baseline classifiers and the proposed Subsemble classifier across the five classification performance metrics, we employed a rank normalized scoring approach previously used to benchmark the performance of machine learning classifiers when trained and tested on drug discovery (Korotcov et al., 2017) and raman spectroscopy datasets (Chen, 2021). Rank normalized scores for each classifier were calculated by first ranking each classifier by their performance in each metric, where a classifier with a lower rank represents relatively increased performance compared to a classifier with a higher rank. Next, the ranks for each metric were summed together for each classifier and ordered from lowest to highest based on the rank sum, where a classifier with a lower rank sum represents relatively increased performance across multiple performance metrics compared to a classifier with a higher rank sum.
To optimize the classification performance of the pre-processing steps used, we tested the effect of using raw read counts, upsampled read counts using SMOTE, to create balanced class distributions, log2-transformed read counts, and both log2-transformed and upsampled read counts from the Li et al. colorectal cancer dataset on five metrics used to measure the performance of the Subsemble. Using five repetitions of a 10-fold stratified cross-validation technique to train and test the Subsemble, we found that the median accuracy of 94.44% across all folds and repetitions was highest when training and testing the Subsemble using log-transformed and upsampled read counts (Figure 2). In comparison, the median accuracy when using log-transformed read counts was 93.44%, followed by a drop-off in accuracy when using upsampled read counts (88.89%) and raw read counts (88.57%). Likewise, the Subsemble performed best in precision (94.61%), recall (94.44%), F1 score (93.62%), and Matthew’s Correlation Coefficient (86.41%) when trained and tested using log-transformed and upsampled read counts compared to other read count pre-processing methods. Moreover, log-transformation and SMOTE upsampling of read counts generally resulted in decreased variance in classification performance across each of the five performance metrics compared to log-transformation alone or when using raw read counts. Rank normalized scores of Subsemble classification performance measured across five metrics and tested using four different pre-processing pipelines showed that the log2-transformation and SMOTE upsampling of raw read counts consistently ranked the highest among other pre-processing pipelines (Supplementary Table 1) (Chen & Shoostari, 2022b).
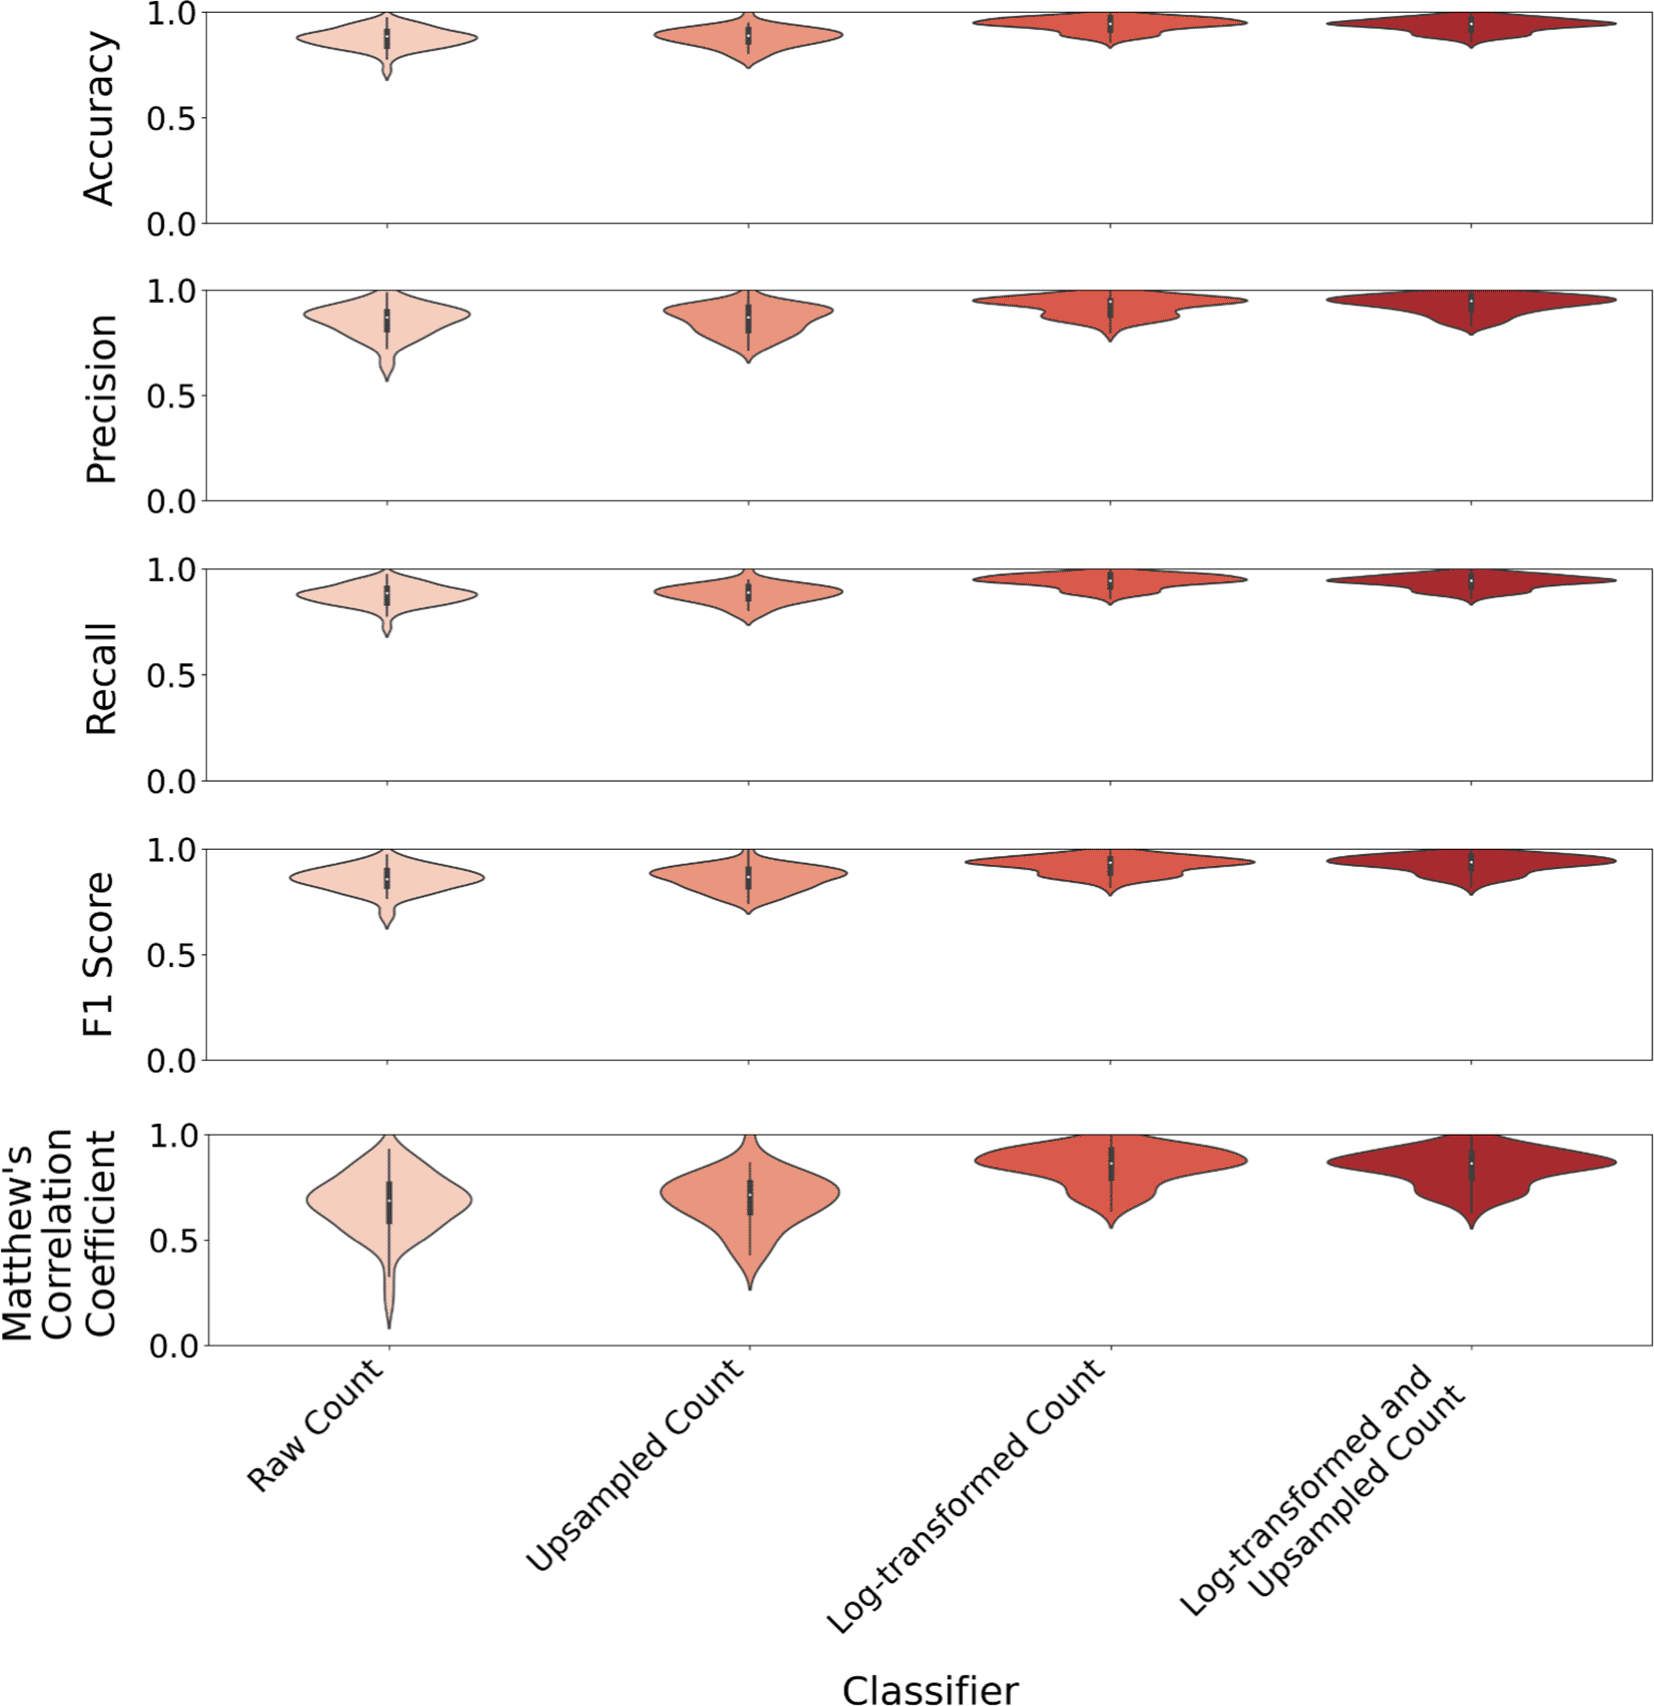
The Subsemble classifier shows higher classification performance when trained and tested on single cell expression data that has been pre-processed using log2-transformation for data normalization and SMOTE upsampling to generate balanced class proportions compared to pre-processing with each step alone and to no pre-processing conducted (raw read counts).
First, we benchmarked the classification performance of the proposed Subsemble classifier compared to nine machine learning classifiers, deep learning classifiers, and an existing cell type annotation method, using the van Galen et al. acute myeloid leukemia dataset and a ten-fold stratified cross-validation scheme for classifier training and testing. We used the log2- transformation for data normalization and SMOTE upsampling to generate balanced class distributions for the training datasets used to train each classifier in the cross-validation benchmarks using the van Galen et al. acute myeloid leukemia dataset.
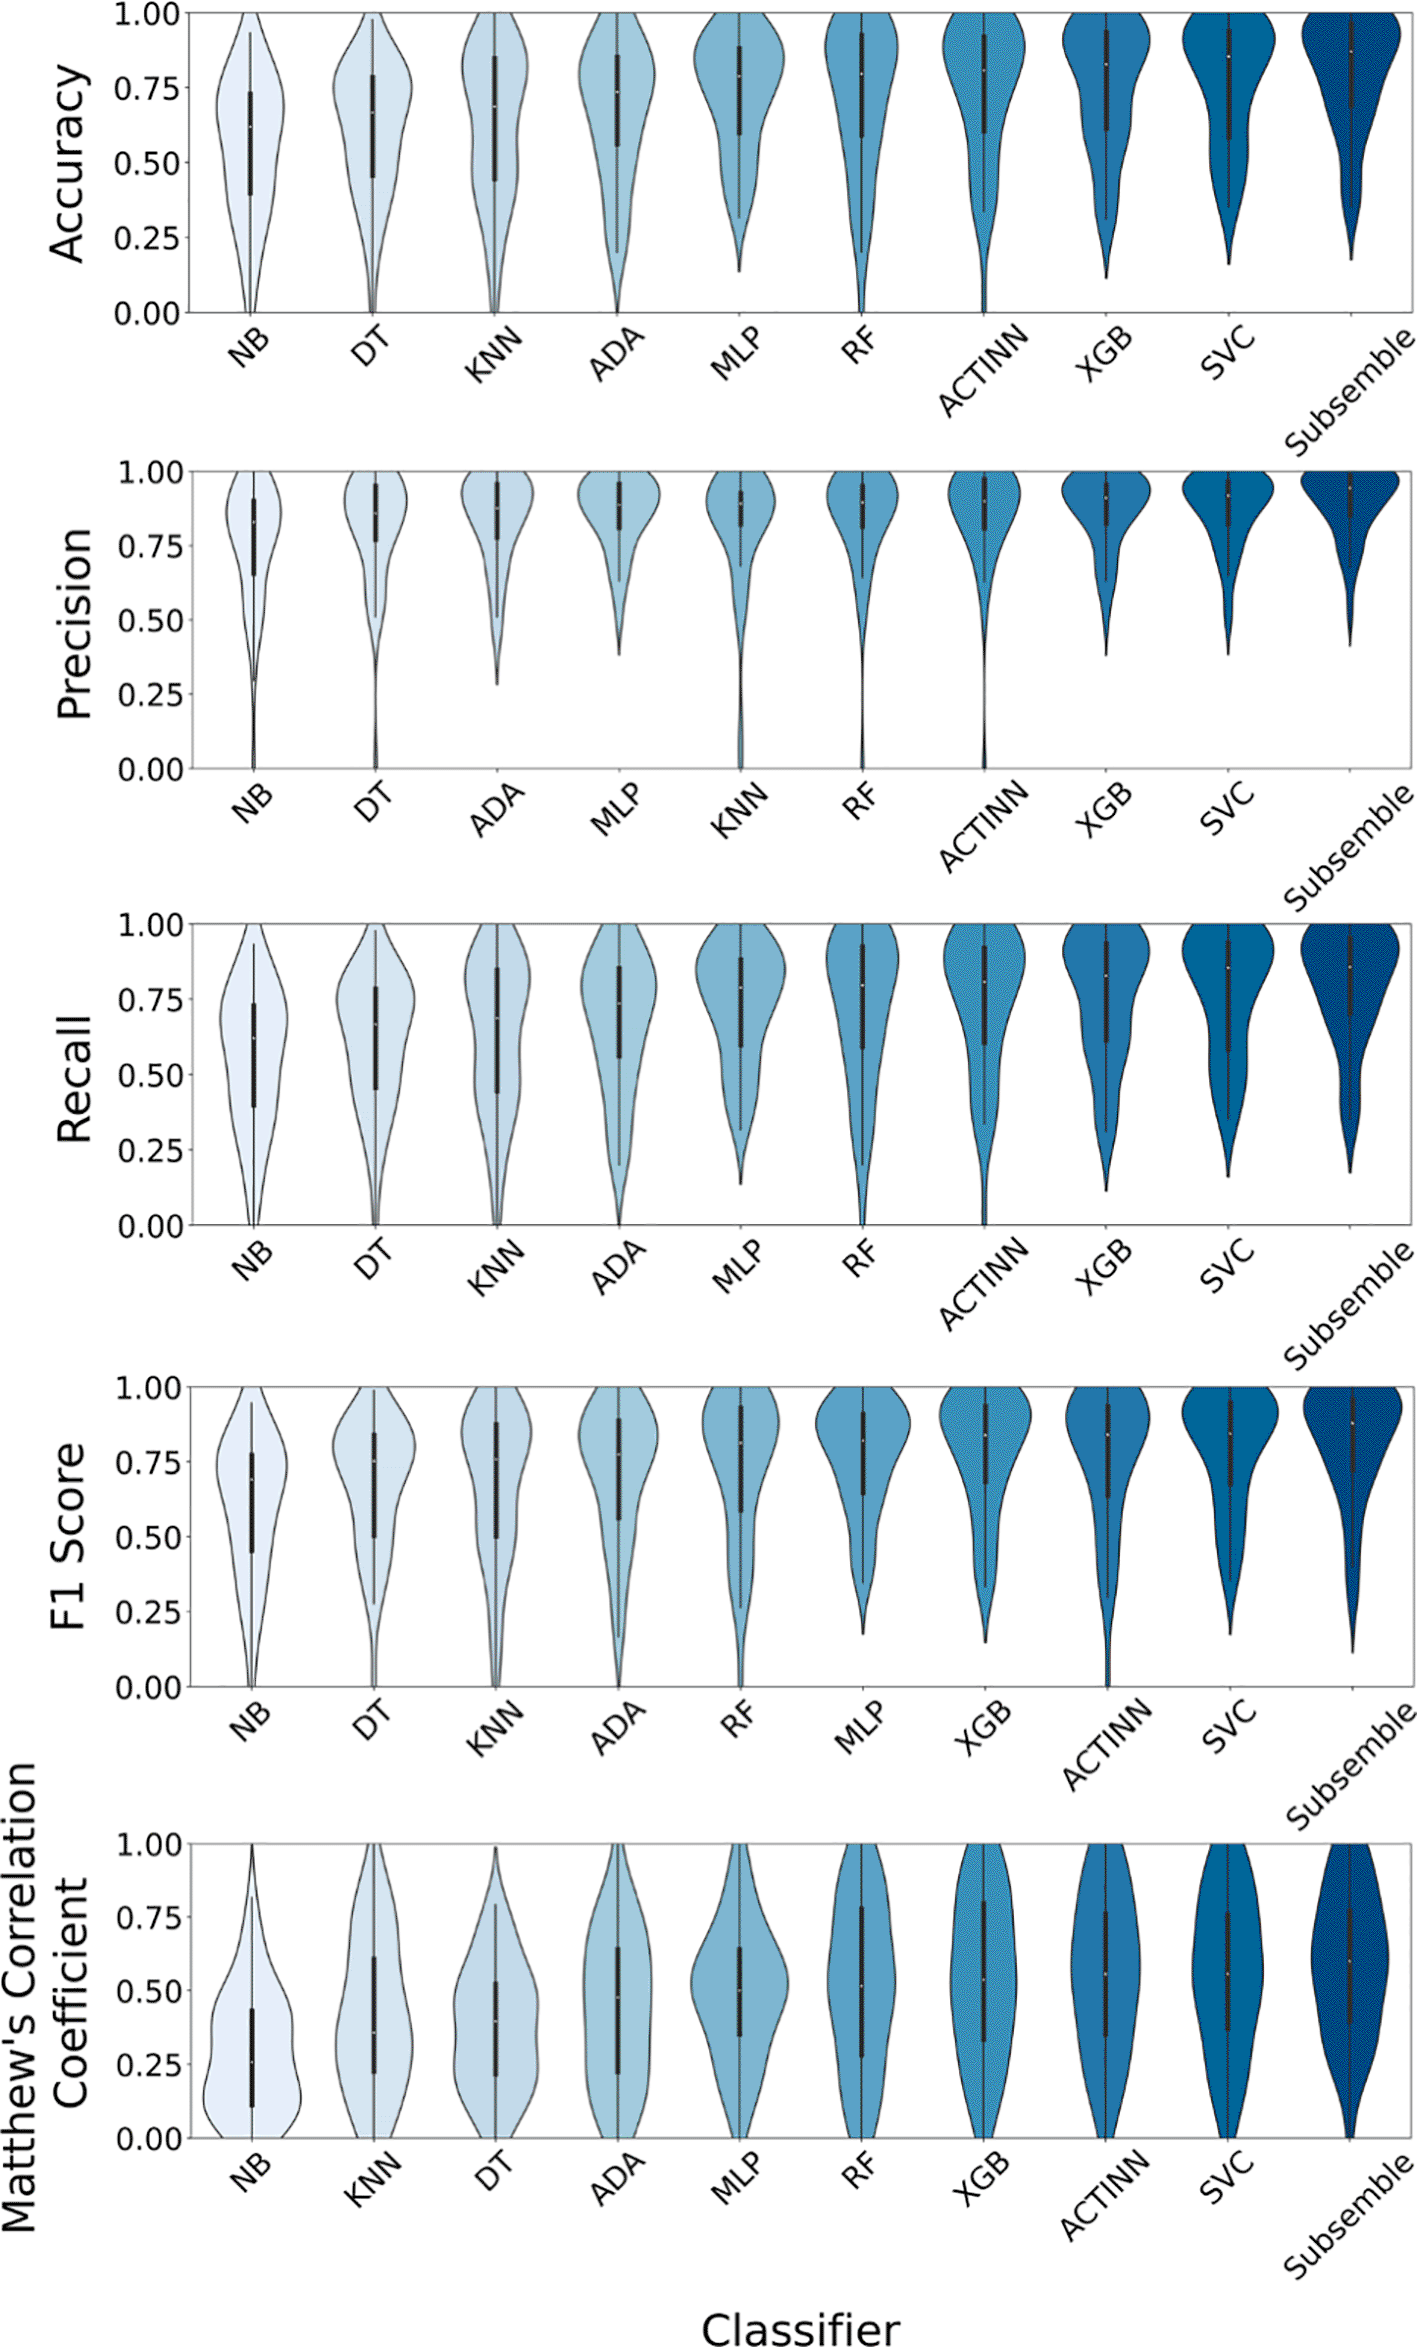
The Subsemble classifier consistently performed with the highest performance across all metrics, including median accuracy (88.65%), median precision (88.9%), median recall (88.65%), median F1 score (88.64%), and median Matthew’s Correlation Coefficient (85.81%) (Figure 3A). The ACTINN deep learning cell type annotation method was the second highest ranked classifier based on median performance across all five metrics, followed by the XGBoost classifier and Support Vector classifier. The variance of each metric measured from five repetitions of the cross-validation scheme and ten folds in each scheme was comparable between the Subsemble and other classifiers, with the exception of the AdaBoost classifier which showed a marked increase in performance variance across different folds.
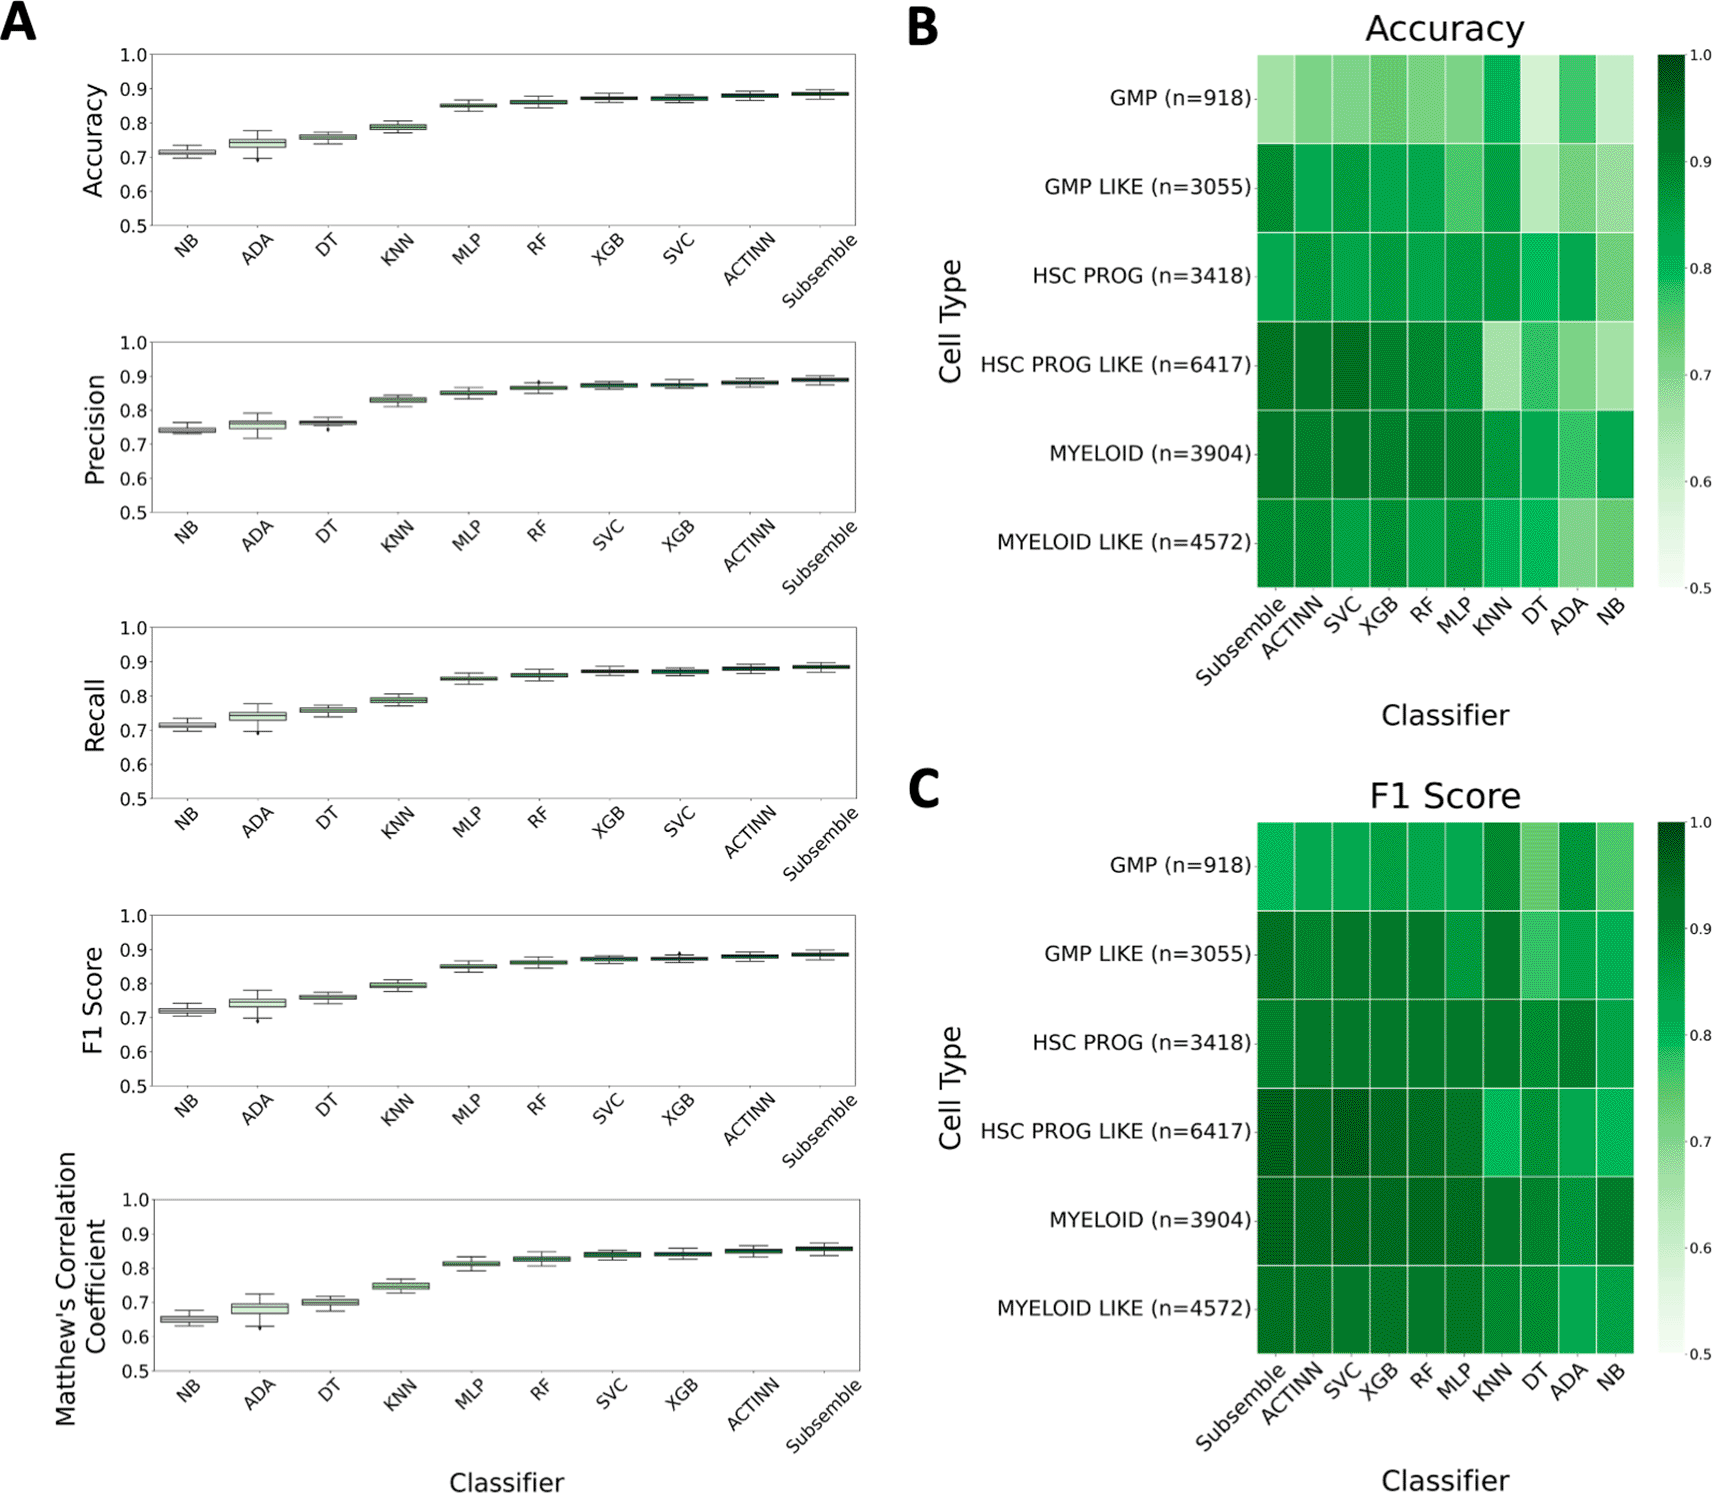
A) Classification performance measured using five metrics across all folds of the 10-fold cross-validation scheme. B) Median accuracy of cell type-specific predictions across all folds in the cross-validation scheme. C) Median F1 score of cell type-specific predictions across all folds in the cross-validation scheme.
Rank normalized scores ranked the Subsemble as the top performing cell type classifier, followed by the ACTINN deep learning annotation method, XGBoost classifier, and Support Vector Classifier (Supplementary Table 2) (Chen & Shoostari, 2022b). To test whether different classifiers showed biases in class-specific classification performance, we calculated the accuracy and F1 score metrics associated with each of the six cell type labels included in the van Galen et al. acute myeloid leukemia dataset (Figure 3B and C, respectively). We observed that the Granulocyte Monocyte Progenitor (GMP) cell type was a minority class and consistently showed relatively decreased median accuracy and median F1 score across all classifiers. Moreover, we noted that the Subsemble generally performed comparably or out-performed other classifiers when tasked with classification of all cell types except for the GMP cell type.
Second, we tested if the number of folds used for the stratified cross-validation scheme including five folds, 10 folds, and 20 folds, affected the median accuracy and F1 score performance of the proposed Subsemble classifier and nine other classifiers and annotation methods (Figure 4A and B, respectively). We expected that as the number of folds increased and a larger proportion of the entire dataset was used for training the classifiers, there would be an increase in the classification performance when tested on the hold-out fold of the dataset. We observed that as the number of folds in the stratified cross validation scheme increased from five-fold to 20-fold, there was a marked increase in the median accuracy and median F1 score for the Subsemble (+3.67% accuracy, +3.97% F1 Score), K-nearest neighbors (+5.97% accuracy, +5.21% F1 score), Naïve Bayes (+2.40% accuracy, +2.54% F1 Score) classifiers and AdaBoost (+2.57% accuracy, +2.19% F1 score) classifiers.
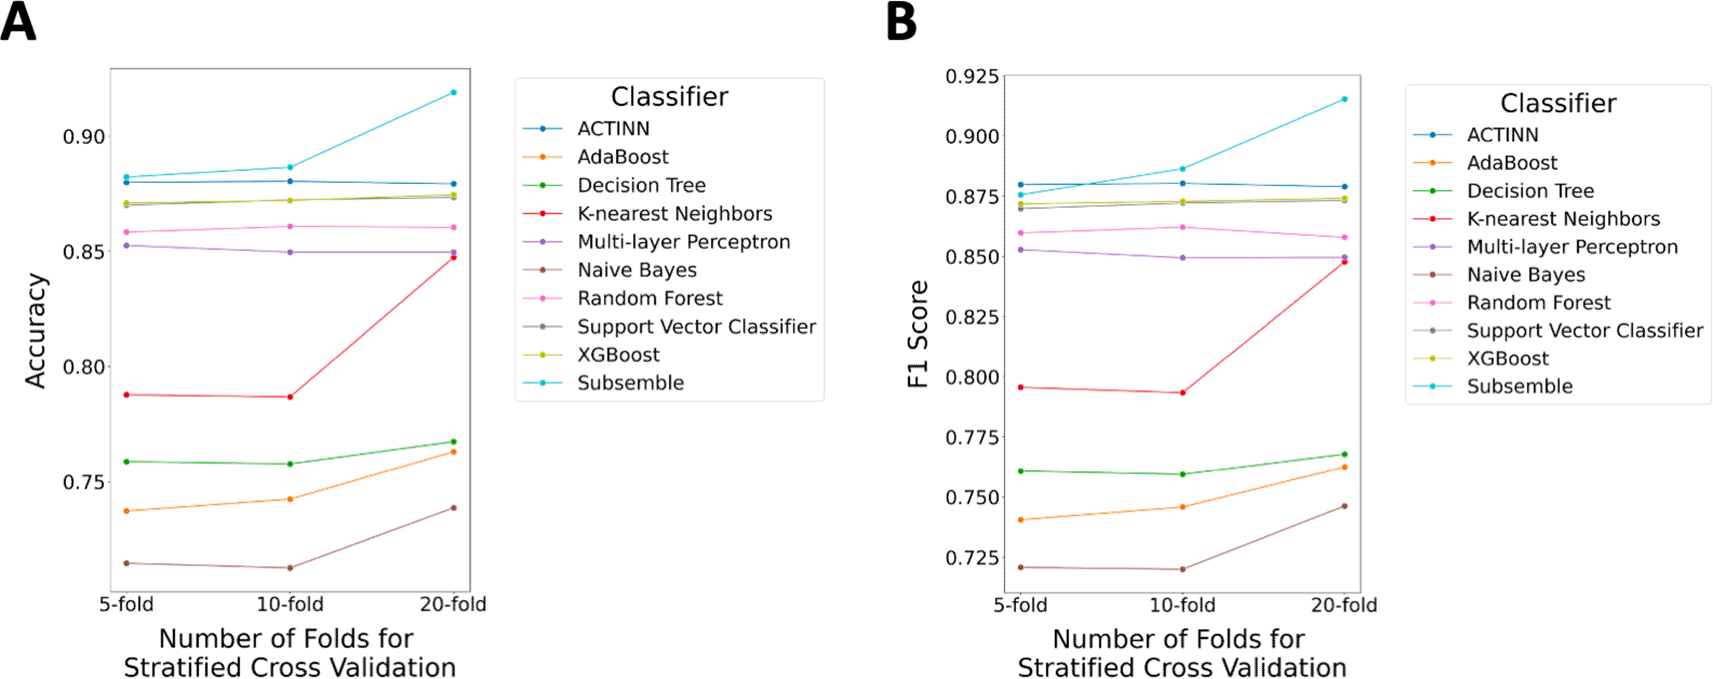
A) Median accuracy performance across all folds of the five-fold, 10-fold, and 20-fold cross-validation scheme. B) Median F1- core performance across all folds of the five-fold, 10-fold, and 20-fold cross-validation scheme.
Rank normalized scores of median accuracy, aggregated across accuracy benchmarks using a five-fold, 10-fold, and 20-fold stratified cross-validation scheme, showed that the Subsemble was the top performing cell type classifier when trained and tested using five, 10, or 20 folds, followed by ACTINN, XGBoost, and SVC (Supplementary Table 3) (Chen & Shoostari, 2022b). We noted that ACTINN was the top performing cell type classifier based on median F1 score when tested using a five-fold stratified cross-validation scheme, while the Subsemble was the top performing cell type classifier based on median F1 score when tested using a 10-fold and 20-fold stratified cross-validation scheme. This shows that the ACTINN neural network based classifier may perform well in scenarios where large training datasets are not available, but the Subsemble continues to outperform individual classifiers as the training dataset size increases. Rank normalized scores of median F1 score showed that the Subsemble was the top performing cell type classifier, followed by ACTINN, XGBoost, and Support Vector Classifier (Supplementary Table 4) (Chen & Shoostari, 2022b).
Third, we compared the classification performance of the Subsemble classifier to the nine other classifiers and annotation methods when trained on the van Galen et al. acute myeloid leukemia data associated with all but one patient and tested on data associated with the hold-out patient using a leave-one-out cross-validation scheme based on patient. The Subsemble classifier reported the highest median accuracy (87.00%), median precision (94.27%), median recall (85.72%), median F1 score (87.79%), and median Matthew’s Correlation Coefficient (59.97%) (Figure 5). We noted that Subsemble generally showed the least variance in each performance metric across different folds as well as the smallest range compared to the nine other classifiers and annotation methods. Rank normalized scores aggregated across all five performance metrics for each classifier showed that the Subsemble was the top-ranked cell type classifier, followed by Support Vector Classifier, XGBoost, and ACTINN (Supplementary Table 5) (Chen & Shoostari, 2022b).
Single cell RNA sequencing is a powerful method to analyze the transcriptome of a tumor sample at single cell resolution, providing an overview of cellular heterogeneity based on cell type and cell state. To automate the time and labor-intensive task of manual cell type annotation, we employed the Subsemble ensemble classifier trained on known cell types to accurately classify cells based on single cell gene expression data as a novel application of the Subsemble. In our proof-of-concept study, we showed that the log-transformation and SMOTE-upsampling pre-processing pipeline coupled with the Subsemble classifier consistently performed as the top-ranked classifier across five classification performance metrics, two different validation datasets, and two different cross-validation schemes.
Data normalization using log-transformation (Lytal et al., 2020) and upsampling of RNA sequencing data using SMOTE (Yap et al., 2021) have previously been reported to individually improve performance in classification tasks. This study uniquely applied both pre-processing steps to transform gene expression data from single cell RNA sequencing and showed that using both pre-processing steps increased Subsemble classification performance compared to each standalone step or using raw read counts as the training dataset input. The improvement of each of the five classification performance metrics when using both pre-processing steps to transform the Li et al. colorectal cancer dataset suggests that log-transformation and SMOTE upsampling may be useful for scaling and generating balanced class proportions recommended for training machine learning classifiers (Johnson & Khoshgoftaar, 2019).
Previous studies have shown that ensemble methods were superior in overall classification performance and tend to perform at least comparably if not better than individual machine learning classifiers (Dietterich, 2000; Zhao et al., 2020). The higher overall classification performance and lower variance of each performance metric suggest that the Subsemble is more consistent in its predictions across the entire test dataset. Moreover, as we increased the number of folds in the stratified cross-validation scheme, we observed that the Subsemble increased in median accuracy and F1 score which suggests that Subsemble performance can be further improved with larger training datasets. Finally, the accurate cell type predictions made by the Subsemble when trained on gene expression data and cell type labels associated with all patients but one and tested on the hold-out patient suggest that the Subsemble can be applied to cell type prediction of unlabelled gene expression data when trained on data generated from the same experiment and technical conditions.
Across the different performance benchmark tests, we noted that the individual Support Vector machine learning classifier and XGBoost boosting classifier were generally top-performing cell type classifiers across each of the performance metrics. The Support Vector machine learning classifier is computationally efficient and generalizable to a variety of classification tasks, including high-dimensional single cell RNA sequencing datasets (Karamizadeh et al., 2014). The XGBoost classifier is an ensemble gradient boosting model that is faster in training time than other implementations of gradient boosting and uses an iterative approach to continuously refine classification predictions (Santhanam et al., 2017). By incorporating both the Support Vector and XGBoost classifier as base learners in the Subsemble, our proposed model takes advantage of both classifiers’ strengths to optimize the final cell type prediction.
The performance of supervised machine learning-based cell type classifiers depends on the number of cell type observations and diversity of cell types within the training dataset. The poor performance of the Subsemble in the classification of the minority GMP cell type in the van Galen et al. acute myeloid leukemia dataset, alike to the other classifiers, requires a larger number of cell type observations with balanced class proportions in the training dataset. Thus, future work will aim to develop a Subsemble classifier pre-trained on an integrated gene expression dataset of multiple different reference cell types, including rare cell types, and sequenced using different technologies (Korsunsky et al., 2019), different tissue subtypes (Travaglini et al., 2020), and different patient clinical conditions to improve classification sensitivity (Mereu et al., 2020). Moreover, further classification performance benchmark studies of SMOTE upsampling compared to random undersampling when applied to high-dimensional data such as scRNA-seq gene expression datasets should be conducted to validate the pre-processing steps used to transform the training datasets for cell type machine learning classifiers (Blagus & Lusa, 2013).
Ensemble methods require multiple individual machine learning classifiers to be trained independently which increases the computational resources and time required to train the ensemble model compared to training standalone classifiers or using statistical methods for cell type classification. We plan to improve the Subsemble classifier by training individual classifiers using multiple different training subsets in parallel and conducting a hyperparameter grid search to optimize both classification performance and training time. Nevertheless, our proof-of-concept study showed that the Subsemble classifier trained on two validation single cell gene expression datasets is an accurate classifier of cell type labels compared to individual machine learning classifiers, deep learning classifiers, and ACTINN. Further benchmark tests comparing the Subsemble classifier to other supervised and unsupervised cell type annotation methods will be conducted.
In conclusion, our proof-of-concept study is a novel application of the Subsemble ensemble classifier to supervised classification of scRNA-seq gene expression data. Data normalization and upsampling coupled with the Subsemble classifier showed overall improved classification performance compared to nine other cell type classification methods when tested using five-fold, 10-fold, and 20-fold stratified cross-validation schemes. The Subsemble classifier also showed superior performance when tested using a patient-based leave-one-out cross-validation scheme. The superior classification performance of the Subsemble classifier across two different scRNA-seq gene expression datasets, two cross-validation schemes, and five performance metrics motivates future development of ultra-fast and accurate ensemble cell type classifiers and larger-scale systematic benchmark tests compared to other cell type annotation methods.
The Li et al. and van Galen et al. single cell RNA sequencing gene expression datasets and respective cell type labels used to train and test the Subsemble cell type supervised classifier can be accessed on Gene Expression Omnibus at accessions GSE81861 and GSE116256 respectively.
Figshare: Figure Data. https://doi.org/10.6084/m9.figshare.20484153.v1 (Chen & Shoostari, 2022a).
This project contains the following underlying data:
- Figure_2 (Folder containing all benchmark metrics calculated after testing the performance of the Subsemble Cell type for figure 2)
- Figure_3 (Folder containing all benchmark metrics calculated after testing the performance of the Subsemble Cell type for figure 3)
- Figure_4AB (Folder containing all benchmark metrics calculated after testing the performance of the Subsemble Cell type for figure 4a and 4b)
- Figure_4C (Folder containing all benchmark metrics calculated after testing the performance of the Subsemble Cell type for figure 4c)
Figshare: Supplementary Table 1-5. https://doi.org/10.6084/m9.figshare.20484144.v1 (Chen & Shoostari, 2022b).
This project contains the following extended data:
- ST1. Pre-processing_Pipeline_Rank_Normalized_Scores.csv
- ST2. Ten-Fold_CV_Rank_Normalized_Scores.csv
- ST3. CV_Fold_Accuracy_Rank_Normalized_Scores.csv
- ST4. CV_Fold_F1_Score_Rank_Normalized_Scores.csv
- ST5. Patient_LOOCV_Rank_Normalized_Scores.csv
Data are available under the terms of the Creative Commons Attribution 4.0 International Public License (CC-By 4.0).
Software available from SciCrunch: RRID: SCR_022784
Source code available from: https://github.com/shooshtarilab/Subsemble_Cell_Type_Classifier
Archived source code at the time of publication: https://doi.org/10.5281/zenodo.7702391 (Chen, 2023)
License: CC0
| Views | Downloads | |
|---|---|---|
| F1000Research | - | - |
|
PubMed Central
Data from PMC are received and updated monthly.
|
- | - |
Is the work clearly and accurately presented and does it cite the current literature?
Partly
Is the study design appropriate and is the work technically sound?
Partly
Are sufficient details of methods and analysis provided to allow replication by others?
Partly
If applicable, is the statistical analysis and its interpretation appropriate?
Partly
Are all the source data underlying the results available to ensure full reproducibility?
Partly
Are the conclusions drawn adequately supported by the results?
Partly
Competing Interests: No competing interests were disclosed.
Reviewer Expertise: deep learning, bioinformatics, single cell RNA sequencing data analysis, drug discovery
Is the work clearly and accurately presented and does it cite the current literature?
Yes
Is the study design appropriate and is the work technically sound?
Partly
Are sufficient details of methods and analysis provided to allow replication by others?
Yes
If applicable, is the statistical analysis and its interpretation appropriate?
Yes
Are all the source data underlying the results available to ensure full reproducibility?
Yes
Are the conclusions drawn adequately supported by the results?
Partly
Competing Interests: No competing interests were disclosed.
Reviewer Expertise: single-cell, spatial omics
Is the work clearly and accurately presented and does it cite the current literature?
Yes
Is the study design appropriate and is the work technically sound?
Yes
Are sufficient details of methods and analysis provided to allow replication by others?
Partly
If applicable, is the statistical analysis and its interpretation appropriate?
Yes
Are all the source data underlying the results available to ensure full reproducibility?
Partly
Are the conclusions drawn adequately supported by the results?
Yes
Competing Interests: No competing interests were disclosed.
Reviewer Expertise: Single cell and spatial transcriptomics
Alongside their report, reviewers assign a status to the article:
| Invited Reviewers | |||
|---|---|---|---|
| 1 | 2 | 3 | |
|
Version 1 14 Apr 23 |
read | read | read |
Provide sufficient details of any financial or non-financial competing interests to enable users to assess whether your comments might lead a reasonable person to question your impartiality. Consider the following examples, but note that this is not an exhaustive list:
Sign up for content alerts and receive a weekly or monthly email with all newly published articles
Already registered? Sign in
The email address should be the one you originally registered with F1000.
You registered with F1000 via Google, so we cannot reset your password.
To sign in, please click here.
If you still need help with your Google account password, please click here.
You registered with F1000 via Facebook, so we cannot reset your password.
To sign in, please click here.
If you still need help with your Facebook account password, please click here.
If your email address is registered with us, we will email you instructions to reset your password.
If you think you should have received this email but it has not arrived, please check your spam filters and/or contact for further assistance.
Comments on this article Comments (0)