Keywords
renal cell carcinoma; gut microbiota; 16S rRNA sequencing; microbial biomarkers; dysbiosis; gut–kidney axis

This article is included in the Cell & Molecular Biology gateway.
This article is included in the Single-Cell RNA-Sequencing collection.
renal cell carcinoma; gut microbiota; 16S rRNA sequencing; microbial biomarkers; dysbiosis; gut–kidney axis
RCC represents the most common form of malignant kidney tumor, accounting for approximately 90% of adult renal cancers.1 Despite remarkable advances in diagnostic imaging and surgical techniques over recent decades, both the global incidence and mortality rates of RCC continue to rise.2 Surgical resection remains the primary curative approach for localized disease and typically yields favorable outcomes.3 however, nearly 30% of patients present with metastatic disease at diagnosis, and up to one-third of those who undergo radical nephrectomy ultimately experience recurrence or disease progression.4 Current systemic therapies—including targeted tyrosine kinase inhibitors and immune checkpoint inhibitors—offer limited long-term efficacy,5 underscoring the urgent need for novel biomarkers and mechanistic insights to improve early detection, prognostication, and therapeutic strategies.
The pathogenesis of RCC has traditionally been attributed to genetic and epigenetic alterations, particularly mutations in VHL, PBRM1, and SETD2, as well as dysregulation of the hypoxia-inducible factor (HIF) signaling pathway.6,7 Although these intrinsic molecular changes are critical drivers of RCC, accumulating evidence indicates that tumorigenesis is also profoundly influenced by extrinsic factors, including environmental exposures and the host-associated microbiome.8,9 The human gut microbiota, composed of trillions of microorganisms such as bacteria, viruses, and fungi, plays an essential role in maintaining immune homeostasis, metabolism, and epithelial barrier integrity.10 Perturbations in this complex microbial ecosystem—known as dysbiosis—have been increasingly recognized as key contributors to the initiation and progression of various malignancies, including colorectal,11 prostate,12 and endometrial cancers.13
Recent advances have revealed that gut microbes can modulate carcinogenesis through diverse mechanisms, such as the production of carcinogenic metabolites, regulation of immune responses, and modulation of systemic inflammatory signaling.14 Metabolites derived from the microbiota, including short-chain fatty acids (SCFAs), secondary bile acids, and microbial toxins, can directly affect cell proliferation, apoptosis, and differentiation.15 Notably, SCFAs such as butyrate have been shown to exert potent immunomodulatory effects by inhibiting histone deacetylase (HDAC) activity and promoting anti-inflammatory cytokine production.16 These findings highlight the gut microbiota not only as a local regulator of intestinal physiology but also as a systemic modulator of cancer-related pathways in distant organs.
Although numerous studies have clarified the association between intestinal microbiota imbalance and various diseases,17–20 the relationship between it and renal cell carcinoma remains insufficiently understood. Emerging studies suggest that specific bacterial taxa—including Streptococcus, Blautia, and Romboutsia—are enriched in the gut microbiota of RCC patients,21 whereas beneficial commensals such as Faecalibacterium and Oscillospira, known for their anti-inflammatory and anti-tumor activities, are significantly depleted.22 Such alterations in microbial composition and function may play a pivotal role in RCC initiation and progression by influencing host immunity and systemic metabolism.
In this study, we aim to comprehensively characterize the gut microbiota profiles of patients with RCC using 16S rRNA gene sequencing and to compare them with those of healthy individuals. By analyzing microbial diversity, community structure, and key differential taxa, we seek to identify specific microorganisms associated with RCC development and progression. Elucidating these microbial changes will provide novel insights into the pathophysiological mechanisms of renal carcinogenesis and may facilitate the development of microbiota-based biomarkers for early detection, prognosis, and potential therapeutic interventions.
This was a case–control study designed to investigate differences in gut microbiota composition between patients with RCC and healthy individuals. All procedures were conducted in accordance with the Declaration of Helsinki and approved by the Ethics Committee of Shanghai Huiyuan Hospital (Approval No. 2023–0528). Written informed consent was obtained from all participants prior to enrollment.
All patients in the RCC group were pathologically confirmed to have RCC following surgical resection. Healthy controls were recruited from Shanghai Huiyuan Hospital between July 2024 and March 2025. Demographic and clinical data, including age, sex, comorbidities, radiological findings, and postoperative histopathological results, were collected for all participants. All subjects were of Han Chinese ethnicity to minimize confounding effects related to diet and lifestyle.
Inclusion Criteria
Participants were eligible if they:(1) were aged ≥18 years;(2) had a confirmed postoperative histopathological diagnosis of RCC (case group) or no evidence of RCC or other diseases (control group);(3) had no infectious, neurological, or upper gastrointestinal diseases, renal dysfunction, or other active malignancies; and(4) had not used antibiotics, probiotics, vitamins, minerals, nonsteroidal anti-inflammatory drugs, hormones, or gastric acid–related medications (including bismuth, H2 receptor antagonists, omeprazole, sulfasalazine, or misoprostol) within four weeks prior to enrollment. Participants with a history of gastric or duodenal ulcers or major gastrointestinal surgery were excluded.
Exclusion criteria included: Participants were excluded if they(1) had gastrointestinal discomfort (e.g., acid reflux, nausea), diabetes, or severe systemic disease;(2) had HIV infection or hepatitis B surface antigen positivity;(3) had heart failure, unstable angina, or recent myocardial infarction (within 6 months);(4) had a history of organ transplantation, radiotherapy, or chemotherapy; (5) were lactation; (6) had a chronic diarrhea or constipation; (7) had a inflammatory bowel disease;(8) had prior gastrointestinal surgery; (9) had gastrointestinal endoscopy within the past year; and(10) had irritable bowel syndrome.
Sample size was estimated using the formula n = [(Uα + U2β)s/δ], where α and β represent Type I and Type II error probabilities, respectively, and Uα, U2α, and U2β are the corresponding t-values. Based on preliminary pilot data, a minimum of 41 participants per group was required. Ultimately, 47 fecal samples from RCC patients and 51 from healthy controls were included. Baseline characteristics of both groups are summarized in.
Fresh fecal samples (approximately 500 mg) were collected from each subject using sterile collection tubes. Participants were instructed to avoid contamination from urine or toilet water. Samples were immediately frozen on dry ice, transported to the laboratory within 2 hours, and stored at −80 °C until DNA extraction. All samples were processed under aseptic conditions to minimize environmental contamination.
Microbial genomic DNA was extracted using the DNeasy PowerSoil Pro Kit (Qiagen, USA) following the manufacturer’s protocol. DNA concentration and purity were assessed using a NanoDrop 2000 spectrophotometer (Thermo Fisher, USA), and integrity was verified by 1% agarose gel electrophoresis. High-quality DNA samples were stored at −20 °C for downstream analysis.
The V3–V4 hypervariable regions of the bacterial 16S rRNA gene were amplified using specific primers (341F: 5′-CCTACGGGNGGCTGCAG-3′; 805R: 5′-GACTACHVGGGTATCTAATCC-3′). PCR was performed in a 25 μL reaction mixture containing 25 ng of template DNA, 5× Phusion Buffer, 2 mM dNTPs, 0.5 U Phusion DNA polymerase, and 1 μM of each primer. The cycling conditions were: initial denaturation at 95 °C for 3 min; 27 cycles of 95 °C for 30 s, 55 °C for 30 s, 72 °C for 45 s; and a final extension at 72 °C for 5 min. PCR products were purified using magnetic beads, and sequencing libraries were prepared with dual-index adapters according to Illumina protocols. Library quality and fragment size were verified using a Qubit 4.0 fluorometer (Thermo Fisher) and agarose gel electrophoresis.
Sequencing was performed on the Illumina MiSeq PE300 platform (Illumina, USA). Raw paired-end reads were subjected to quality control using fastp to trim low-quality bases and remove ambiguous reads. High-quality paired reads were merged using FLASH with a minimum overlap of 10 bp. Chimeric sequences were detected and removed using UCHIME, and valid reads were clustered into operational taxonomic units (OTUs) at 97% similarity using Vsearch. Representative sequences from each OTU were taxonomically classified against the SILVA 138 database using the RDP classifier with a confidence threshold of 0.7.
Alpha-diversity indices (Chao1, Shannon, Simpson, and Goods coverage) were calculated to assess microbial richness and evenness. Beta-diversity was analyzed using Principal Coordinates Analysis (PCoA) and Non-metric Multidimensional Scaling (NMDS) based on Bray–Curtis distances. Differences in community composition between groups were assessed using PERMANOVA. Differential taxa were identified using Linear Discriminant Analysis Effect Size (LEfSe), and key microbial markers were screened using random-forest modeling. Statistical analyses were conducted in R (v4.3.1), and a p-value <0.05 was considered statistically significant.
A total of 98 participants were enrolled, including 47 patients with RCC and 51 healthy controls. No significant differences were observed between the two groups in terms of age, sex, body mass index (BMI), or renal function parameters (p > 0.05), indicating comparability of baseline characteristics. Detailed demographic and clinical data are summarized in Table 1.
To assess the within-sample diversity (α-diversity) of the gut microbiota, five indices were calculated: the Chao1, Simpson, Shannon, Goods_coverage, and Observed_species indices ( Figure 1A–E). Overall, RCC patients exhibited significantly reduced microbial diversity and richness compared with healthy controls. The Chao1 index, reflecting species richness, was markedly lower in the RCC group than in the control group (***P < 0.001), indicating a substantial reduction in the number of bacterial taxa. Similarly, the Shannon index, which accounts for both richness and evenness, was significantly decreased in RCC patients (**P < 0.05), suggesting reduced diversity and compositional complexity. In contrast, the Simpson index, which inversely reflects diversity, was significantly higher in RCC patients (*P < 0.01), consistent with decreased microbial evenness and dominance of a limited number of taxa. Although the Observed_species index showed a decreasing trend in the RCC group, the difference was not statistically significant (P > 0.05). The Goods_coverage index was slightly higher in the RCC group (***P < 0.001), confirming sufficient sequencing depth and coverage for all samples.
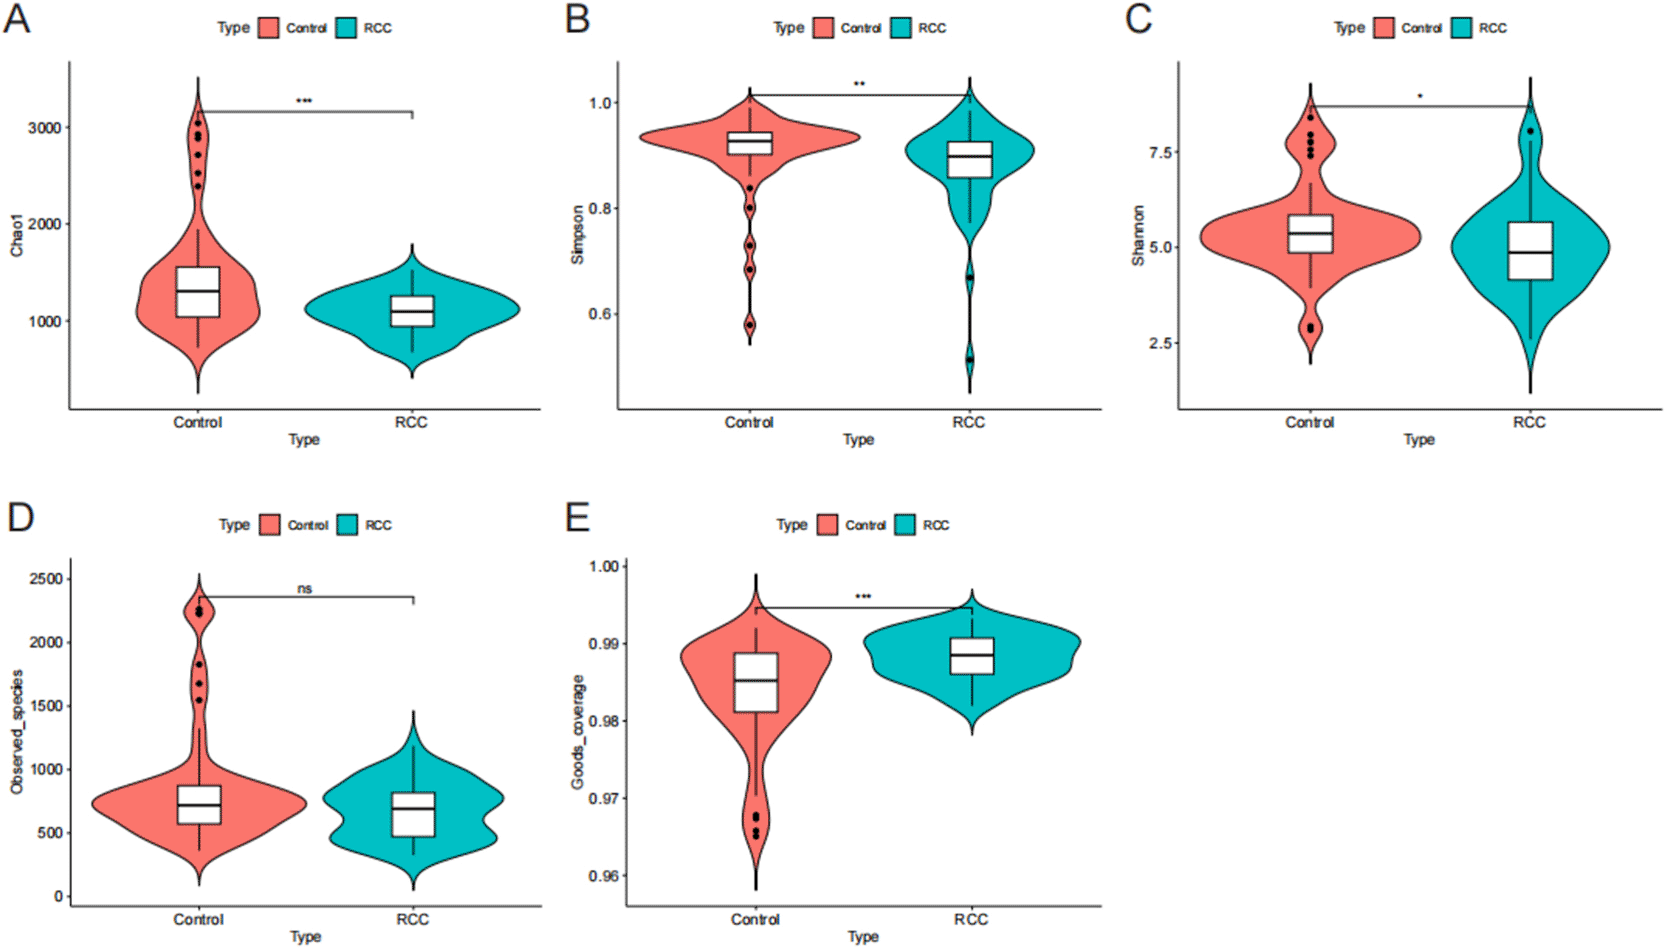
** > Violin plots showing differences in α-diversity indices between the RCC (blue) and control (red) groups: (A) Chao1, (B) Simpson, (C) Shannon, (D) Observed species, and (E) Goods coverage indices. Statistical significance was determined using the Wilcoxon rank-sum test. ns, not significant; P < 0.05 (*), P < 0.01 (**), P < 0.001 (***). The results indicate a significant reduction in microbial richness and diversity in RCC patients, suggesting gut microbial dysbiosis associated with disease development.
Collectively, these findings demonstrate that the gut microbiota of RCC patients displays significantly lower species richness and diversity compared with healthy individuals, indicating a state of microbial dysbiosis potentially associated with RCC development.
To investigate differences in overall gut microbial community structure between patients with RCC and healthy controls, β-diversity was assessed using Principal Coordinates Analysis (PCoA) and Non-metric Multidimensional Scaling (NMDS) based on Bray–Curtis dissimilarity ( Figure 2A, 2B). Both analyses provide a visual representation of compositional variation among samples, where closer proximity of data points indicates greater microbial similarity.
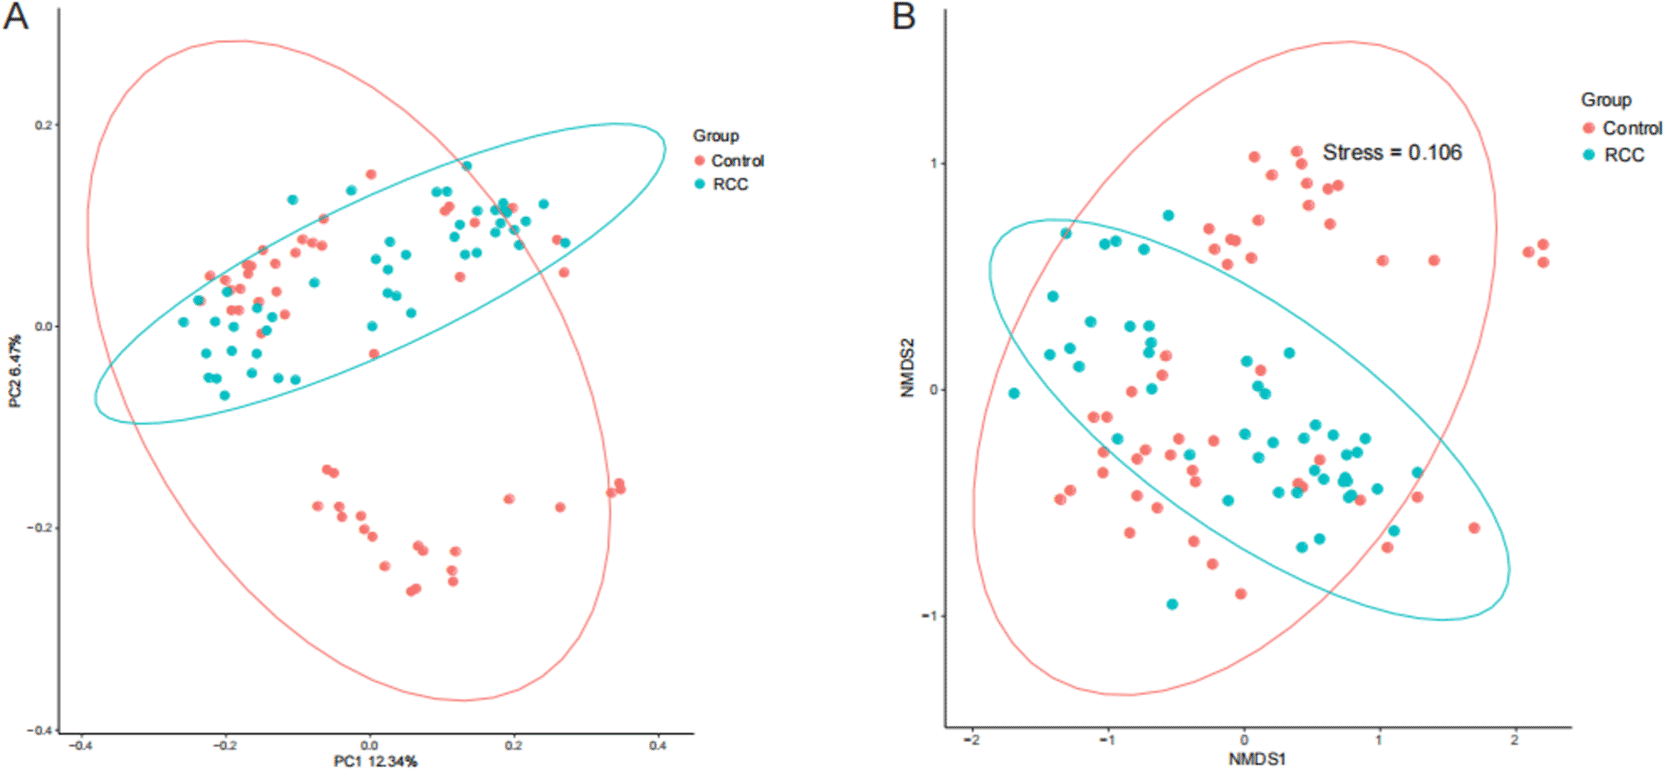
(A) Principal Coordinate Analysis (PCoA) based on Bray–Curtis distance shows distinct clustering between RCC (blue) and control (red) groups, indicating significant differences in overall microbial community composition. (B) Non-metric Multidimensional Scaling (NMDS) analysis further demonstrates the separation between the two groups (Stress = 0.106), confirming alterations in β-diversity. Each point represents one sample; ellipses denote 95% confidence intervals for each group. The results indicate that RCC patients harbor distinct gut microbial community structures compared with healthy individuals.
The PCoA plot revealed distinct clustering of the RCC and control samples along the principal coordinates, suggesting a clear separation in microbial community composition between the two groups. Similarly, NMDS analysis produced consistent results, with samples forming two independent clusters corresponding to RCC and healthy individuals (Stress = 0.106), indicating an acceptable model fit (Stress <0.2).
In summary,these β-diversity analyses demonstrate that the gut microbial community structure of RCC patients differs significantly from that of healthy controls, reflecting a marked alteration in microbial composition and confirming the presence of disease-associated dysbiosis.
To further characterize differences in gut microbial composition between RCC patients and healthy controls, we compared the relative abundances of bacterial taxa at both the phylum and genus levels.
At the phylum level, the four dominant phyla in both groups were Bacteroidetes, Firmicutes, Proteobacteria, and Actinobacteria ( Figure 3A). However, the relative abundance of several less dominant phyla differed significantly between groups ( Figure 3B). Specifically, the abundances of Spirochaetes, Fibrobacteres, Zixibacteria, and WPS-2 were significantly higher in the RCC group (P < 0.05), whereas Verrucomicrobia, Firmicutes, Chloroflexi, and Elusimicrobia were significantly reduced compared with the control group (P < 0.05).
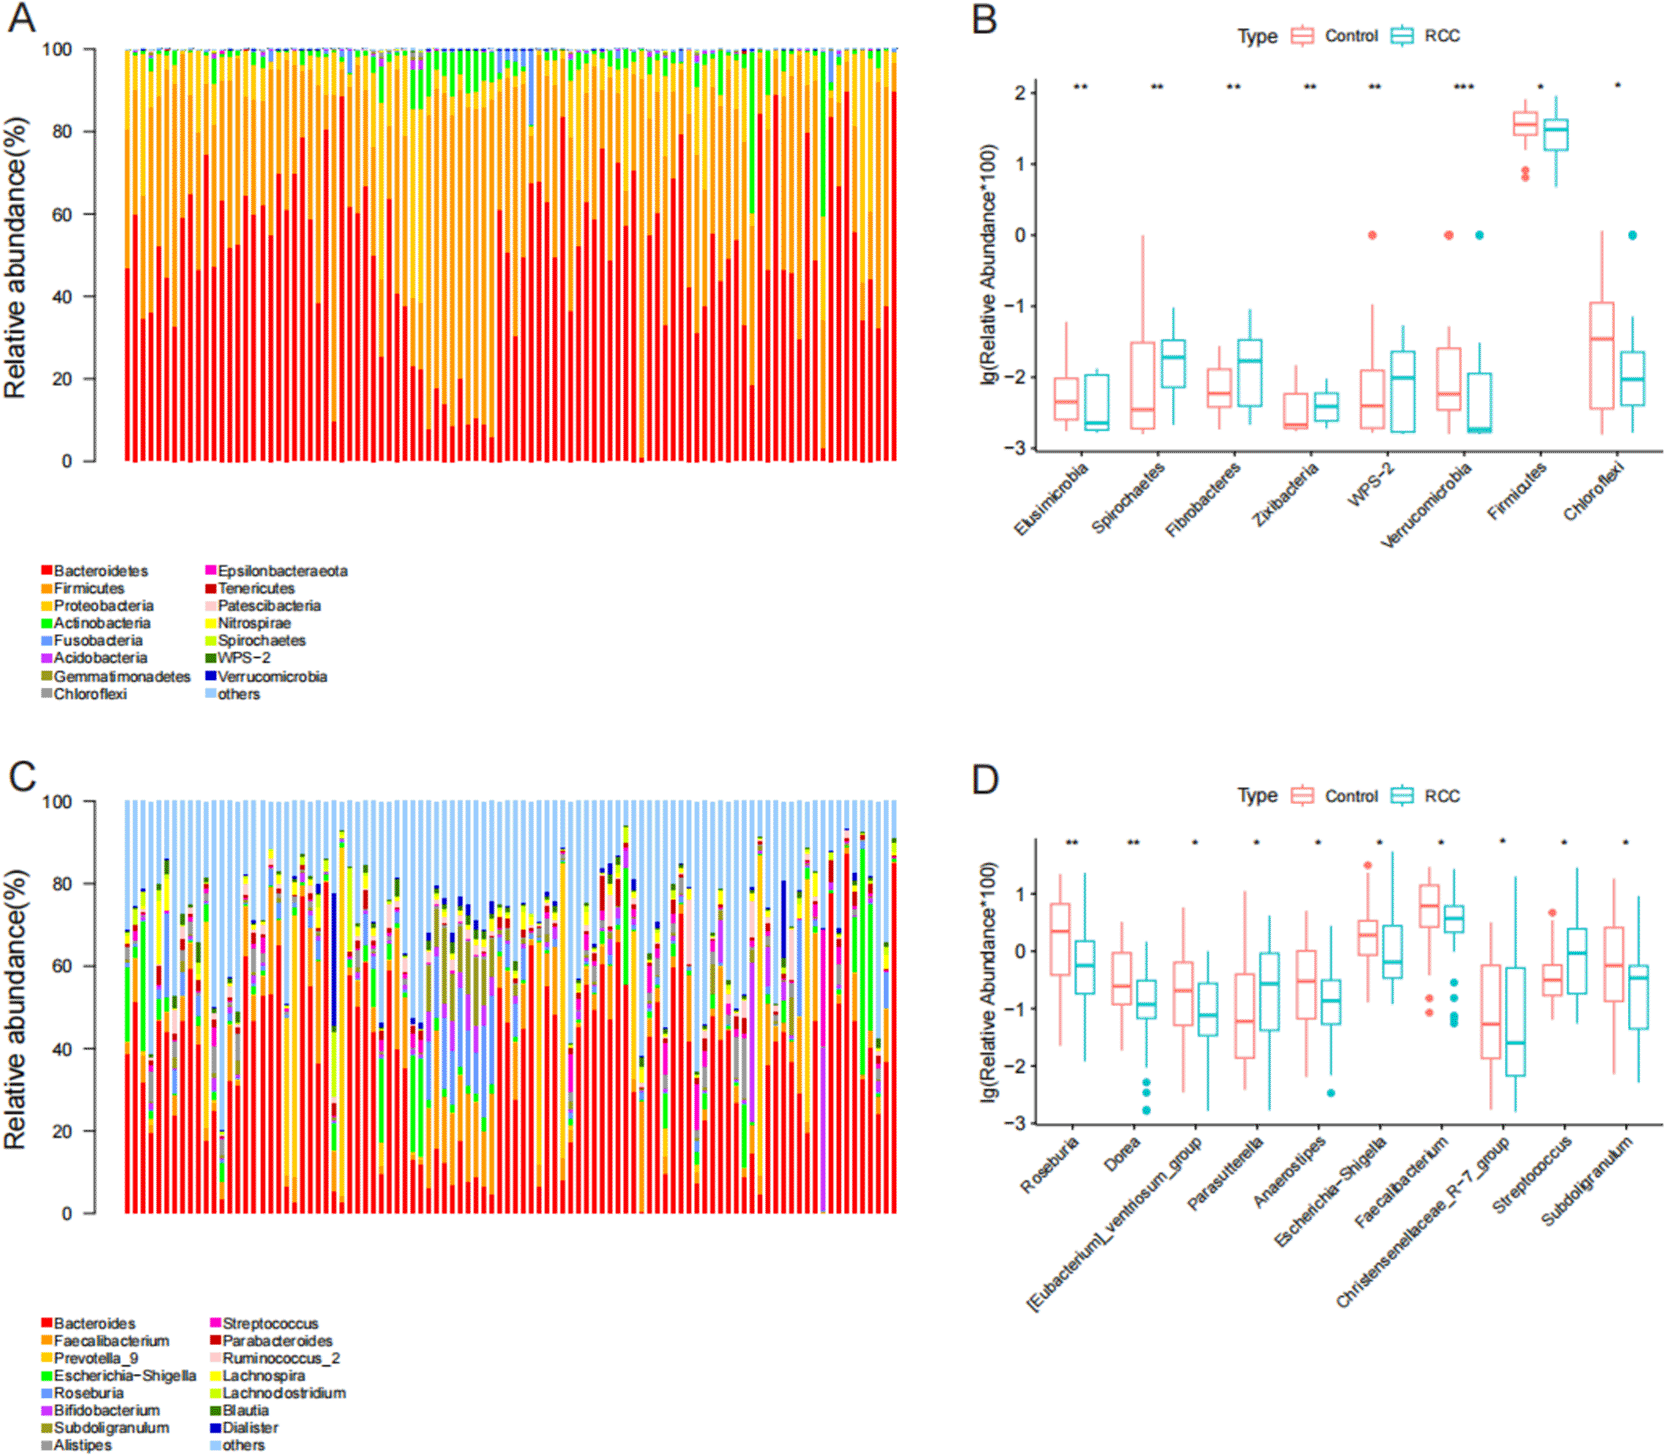
(A) Stacked bar chart showing relative abundances of bacterial taxa at the phylum level in RCC (blue) and control (red) groups. (B) Box plots comparing major phyla between groups, showing significant differences in Firmicutes, Bacteroidetes, Verrucomicrobia, and Chloroflexi. (C) Relative abundance of major bacterial genera across the two groups, indicating distinct compositional profiles. (D) Differential analysis of predominant genera reveals decreased Faecalibacterium, Roseburia, and Blautia, and increased Streptococcus, Escherichia–Shigella, and Parabacteroides in RCC patients. Statistical significance was assessed using the Wilcoxon rank-sum test. P < 0.05 (*), P < 0.01 (**), P < 0.001 (***). These findings indicate significant alterations in gut microbial composition and the loss of beneficial commensal bacteria in RCC patients, consistent with disease-associated microbial dysbiosis.
At the genus level, both groups shared the same top four dominant genera—Bacteroides, Faecalibacterium, Prevotella_9, and Escherichia–Shigella ( Figure 3C). Among the top ten most abundant genera, Streptococcus and Parasutterella were significantly enriched in RCC patients, while beneficial genera such as Faecalibacterium, Roseburia, Blautia, and others were markedly decreased (P < 0.05; Figure 3D).
Overall,these findings demonstrate pronounced alterations in gut microbial composition in RCC patients, characterized by a loss of short-chain fatty acid–producing commensals and an increase in potential pathogenic or pro-inflammatory taxa. Such shifts in microbial structure are indicative of gut dysbiosis associated with renal cell carcinoma.
To identify bacterial taxa that significantly contributed to the compositional differences between groups, Linear Discriminant Analysis Effect Size (LEfSe) analysis was performed ( Figure 4A, 4B). This method detects taxa with statistically significant differences in relative abundance across groups and estimates their effect size using Linear Discriminant Analysis (LDA).
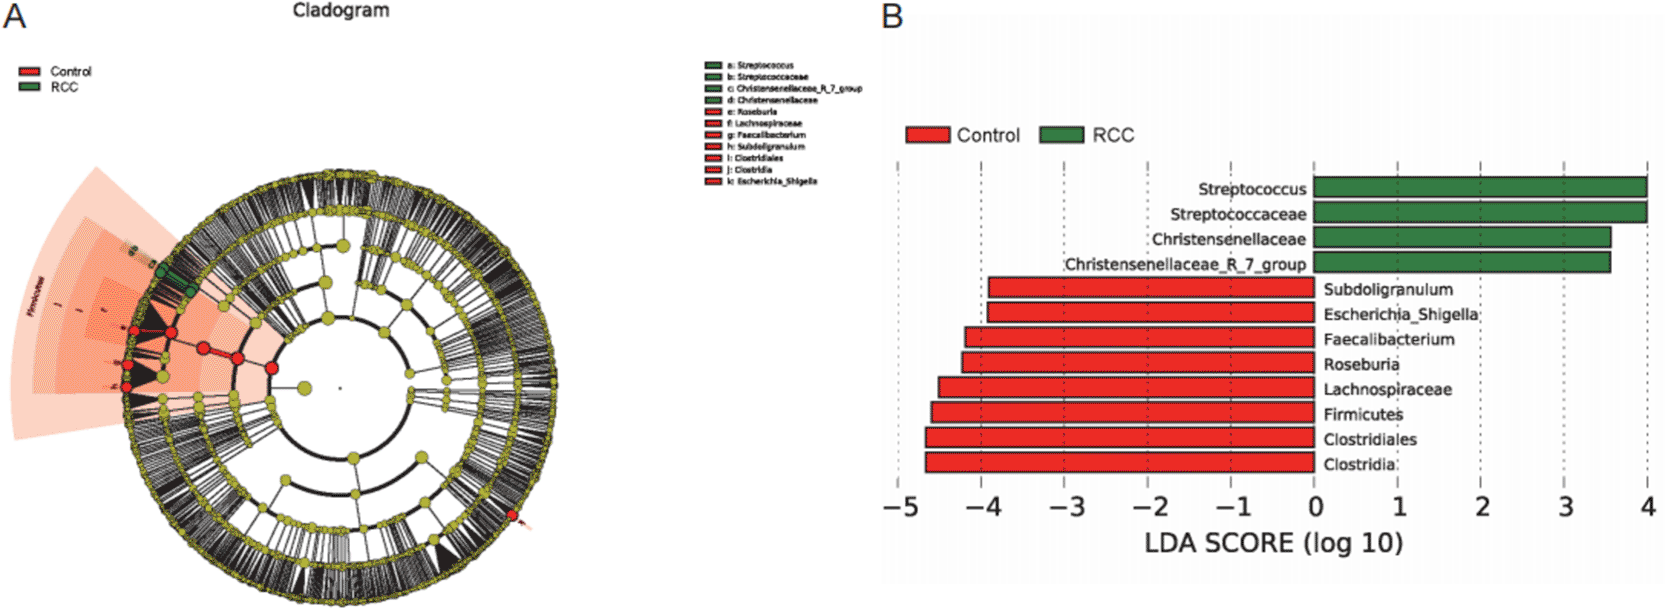
(A) LEfSe-generated cladogram showing taxa with significantly different abundances between the RCC (green) and control (red) groups. Each circle represents a taxonomic level from phylum (outer ring) to genus (inner ring); the diameter of each circle is proportional to its relative abundance. (B) Histogram of linear discriminant analysis (LDA) scores (log10) for taxa with significant differences (LDA > 2.0, P < 0.05). Green bars indicate taxa enriched in RCC, while red bars indicate taxa enriched in healthy controls. The RCC group exhibited enrichment of Streptococcus, Streptococcaceae, and Christensenellaceae, whereas the control group showed higher abundances of Faecalibacterium, Roseburia, Lachnospiraceae, and Clostridia. These results highlight distinct microbial biomarkers that discriminate RCC patients from healthy individuals and suggest a loss of beneficial commensal bacteria associated with renal cell carcinoma–related gut dysbiosis.
The cladogram generated by LEfSe revealed distinct taxonomic distributions between the RCC and control groups ( Figure 4A). At various taxonomic levels, Streptococcus, Streptococcaceae, Christensenellaceae, and Christensenellaceae_R-7_group were significantly enriched in the RCC group. In contrast, the control group exhibited higher relative abundances of Subdoligranulum, Escherichia–Shigella, Faecalibacterium, Roseburia, Lachnospiraceae, Firmicutes, Clostridiales, and Clostridia (LDA score > 2.0, P < 0.05).
The LDA bar chart further quantified these differences, demonstrating that taxa enriched in healthy controls predominantly belonged to the phylum Firmicutes, particularly the families Lachnospiraceae and Clostridiaceae, which are known producers of short-chain fatty acids (SCFAs) involved in maintaining intestinal and systemic immune homeostasis. Conversely, enrichment of Streptococcus and Christensenellaceae in RCC patients may indicate a shift toward pro-inflammatory or metabolically altered microbial populations.
Cumulatively, these results highlight distinct bacterial biomarkers that differentiate RCC patients from healthy individuals, characterized by a loss of beneficial commensal SCFA-producing bacteria and an increase in opportunistic or inflammation-associated taxa, supporting the presence of RCC-related gut dysbiosis.
To explore interrelationships among dominant bacterial genera and identify potential microbial biomarkers for RCC, we performed correlation analysis, indicator species analysis, and random forest modeling using the top 30 most abundant genera.
The Spearman correlation heatmap revealed strong positive correlations among several short-chain fatty acid (SCFA)-producing genera, including Blautia, Subdoligranulum, Anaerostipes, Roseburia, Faecalibacterium, and Fusicatenibacter ( Figure 5A). Similarly, a strong co-occurrence pattern was observed among Barnesiella, Ruminococcaceae_UCG − 014, [Eubacterium]_coprostanoligenes_group, Alistipes, and Ruminococcaceae_UCG − 002, whereas Bifidobacterium, Haemophilus, and Streptococcus also showed positive associations. These findings indicate that beneficial commensals tend to coexist and may be jointly depleted in RCC-associated dysbiosis, while potentially pathogenic taxa cluster together.
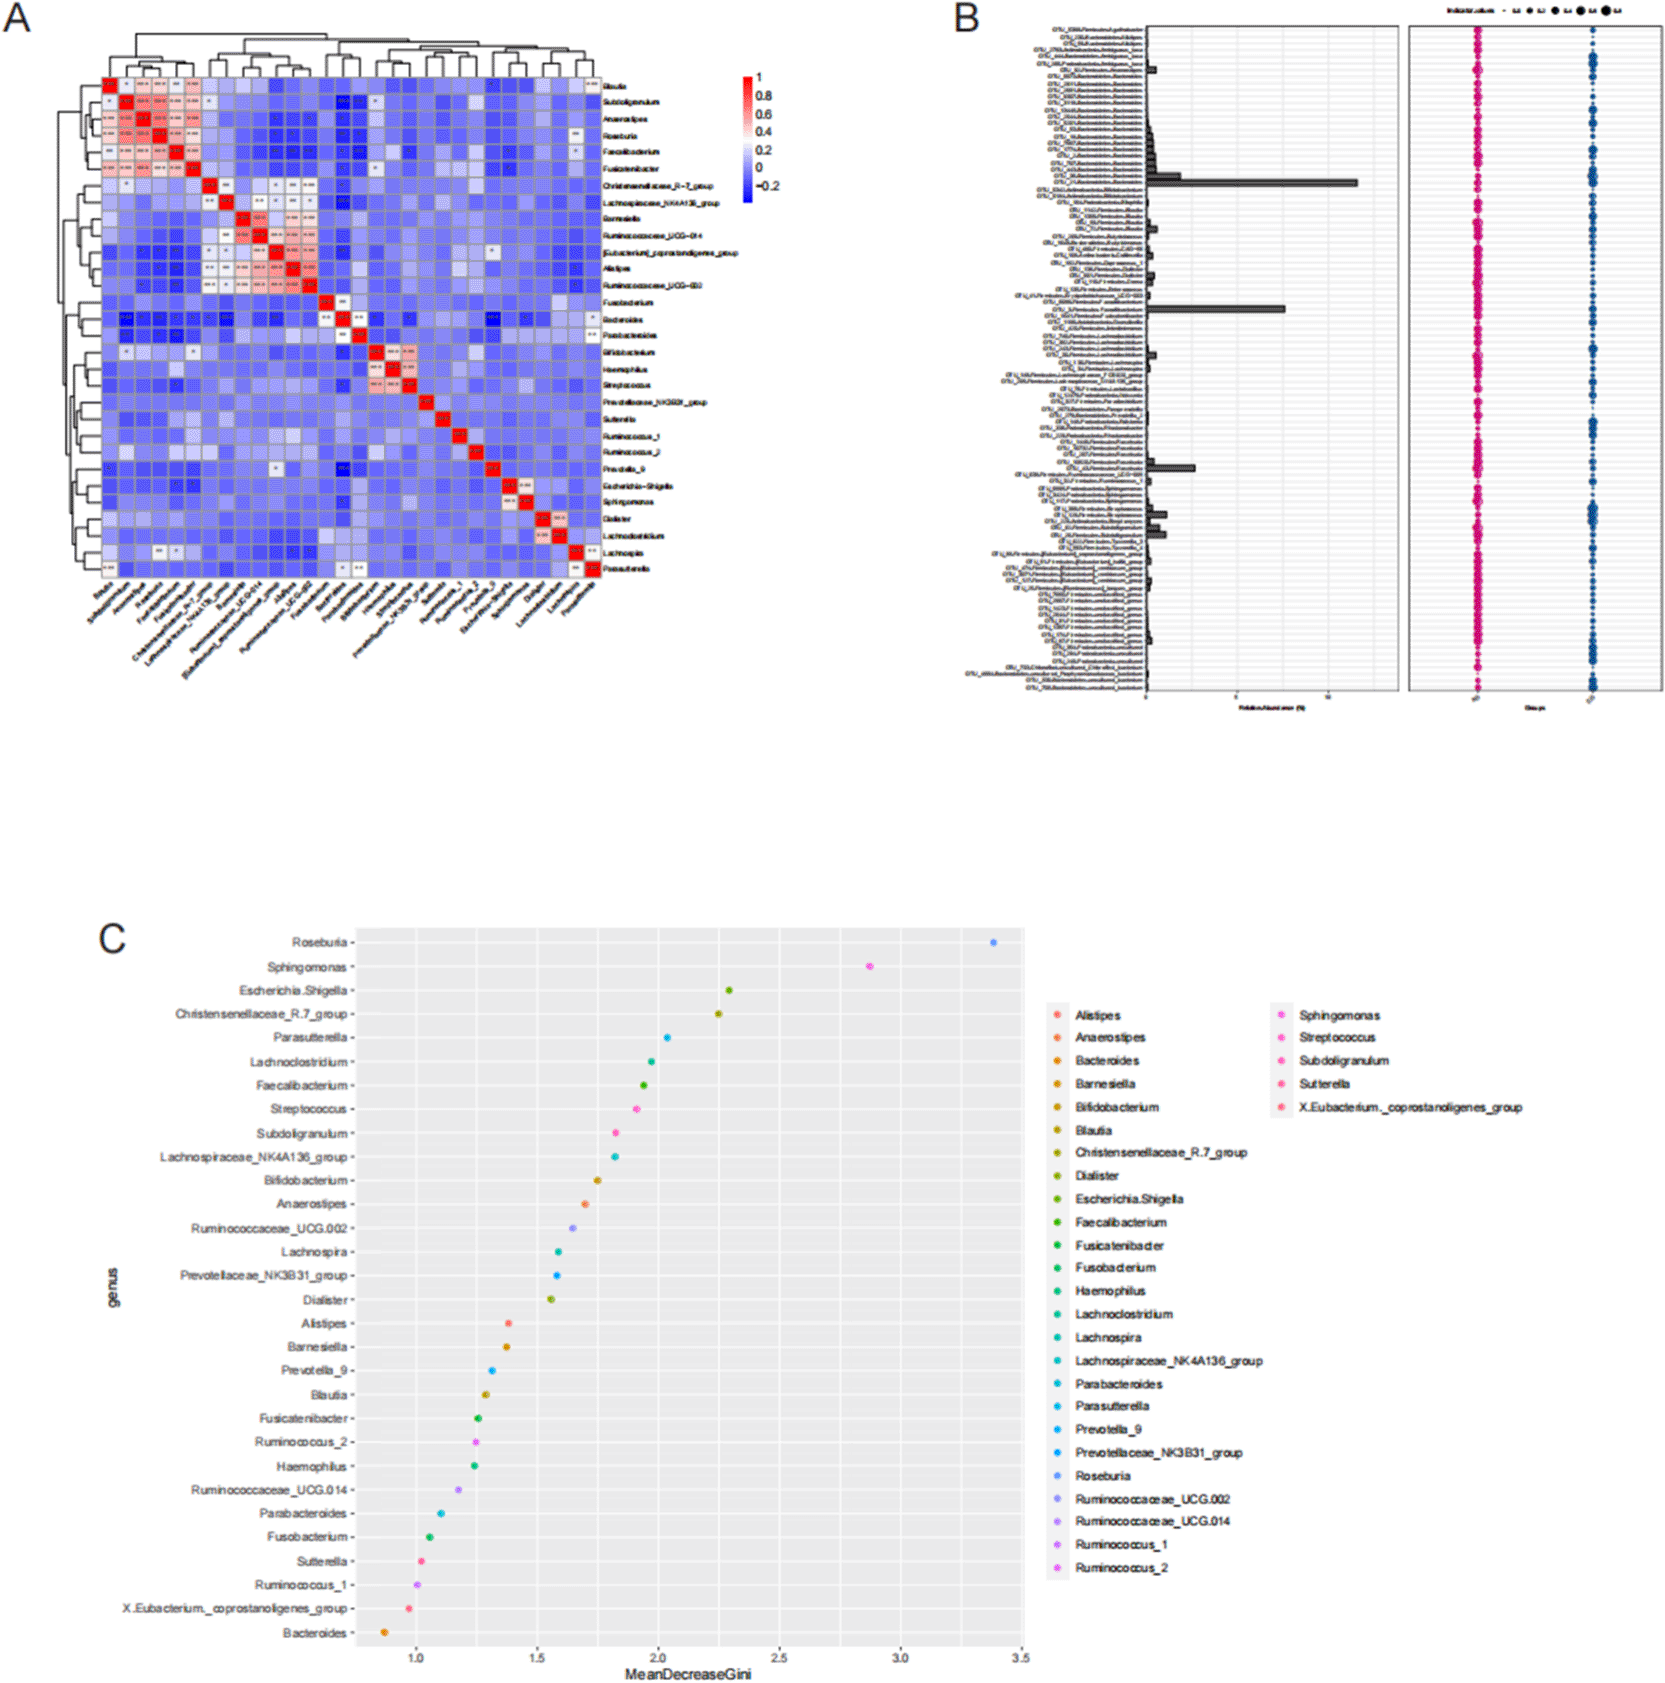
(A) Spearman correlation heatmap of the top 30 bacterial genera. Red indicates positive correlations, and blue indicates negative correlations. SCFA-producing genera (Faecalibacterium, Roseburia, Blautia) were positively correlated with each other but negatively correlated with potential pathogens such as Streptococcus and Escherichia–Shigella. (B) Comparative bar and dot plots showing differential abundance of major genera between RCC (blue) and control (red) groups. (C) Random forest analysis identifying the top discriminatory bacterial genera ranked by Mean Decrease Gini value, with Roseburia, Sphingomonas, and Escherichia–Shigella emerging as key taxa differentiating RCC from healthy controls. Collectively, these findings reveal distinct co-occurrence patterns and identify specific bacterial taxa that may serve as noninvasive biomarkers for RCC-associated gut dysbiosis.
Indicator species analysis identified Faecalibacterium and Roseburia (both belonging to Firmicutes) as genera significantly enriched in healthy controls, suggesting their role as potential protective taxa. In contrast, Bacteroides (phylum Bacteroidetes) was found at higher relative abundance in the RCC group and could serve as a disease-associated indicator genus ( Figure 5B).
Random forest analysis further identified the top five genera contributing most to group discrimination, with Roseburia, Sphingomonas, Escherichia–Shigella, Christensenellaceae_R-7_group, and Parasutterella showing the highest Mean Decrease Gini values (> 2.0) ( Figure 5C). These taxa exhibited strong discriminatory power between RCC patients and healthy controls, suggesting their potential as noninvasive microbial biomarkers for RCC detection.
Taken together, these analyses reveal distinct microbial co-occurrence patterns and highlight specific bacterial genera that may serve as diagnostic or prognostic indicators of RCC-associated gut microbiota dysbiosis.
RCC, commonly referred to as kidney cancer, is one of the most prevalent malignancies of the urogenital system and ranks among the top ten cancers worldwide.23 RCC comprises several pathological subtypes, including clear cell, papillary, and chromophobe carcinomas, with clear cell RCC accounting for 65–70% of all cases. Owing to the widespread use of computed tomography (CT), many patients are incidentally diagnosed, often without obvious symptoms. Over half of these cases are localized at diagnosis; however, approximately 30% present with metastasis.24–26 The five-year survival rate for early-stage RCC after surgery exceeds 60%, while that for advanced disease remains below 10%. For patients with large, metastatic, or vessel-invasive tumors, surgery is often infeasible.24–26 Although immunotherapy, targeted therapy, and immune checkpoint inhibitors (ICIs) have improved outcomes for some patients, their efficacy remains limited. Targeted agents such as sorafenib and sunitinib can inhibit tumor growth but often cause adverse effects and resistance, while cytokine therapy (e.g., IL-2) is toxic and of low efficacy.27 Moreover, ICIs are costly, with overall response rates of only 20–30% across cancers.27 Hence, elucidating the underlying mechanisms of RCC pathogenesis is crucial for developing novel therapeutic strategies and improving prognosis.
Mounting evidence suggests that the gut microbiota plays a pivotal role in tumor immune modulation, metabolism, and inflammation. Dysbiosis—a disruption of microbial balance—can influence tumorigenesis, progression, and treatment response. Although the kidneys are anatomically distant from the gut, advances in 16S rRNA and metagenomic sequencing have revealed notable associations between gut microbial composition and RCC. Increasing evidence indicates that tumorigenesis is shaped not only by host genetics but also by the dynamic equilibrium of the “host–microbiota” system.
Gut microbial dysbiosis has been implicated in multiple malignancies. Helicobacter pylori is a well-established Group 1 carcinogen. Studies by Arthur et al. demonstrated that Escherichia coli NC101 promotes colorectal cancer in mice treated with methylazoxymethanol acetate, while Streptococcus gallolyticus, Enterococcus faecalis, Bacteroides fragilis, and Clostridium spp. have also shown carcinogenic potential in animal models. Microbes can exert distal oncogenic effects, as Helicobacter hepaticus infection increases the incidence of breast, prostate, and liver cancers in mice. These effects are often mediated by microbial metabolites such as bile acids, hormones, and toxins that disrupt mucosal barriers and induce inflammatory cytokines (e.g., IL-6, IL-11, IL-23, IL-17, IL-22).
Mechanistically, gut microbes influence tumorigenesis through direct toxin production (e.g., H. pylori CagA, Shigella flexneri VirA and IpgD), immune modulation, and metabolic alterations. Dysbiosis may drive inflammation, genomic instability, and drug resistance by disrupting metabolite homeostasis. Certain gut-derived metabolites exhibit carcinogenic or antitumor effects. Ruminococcaceae can increase estrogen reabsorption and breast cancer risk; and a high-fat diet–induced microbial imbalance can stimulate prostate and colorectal tumorigenesis through metabolic signaling.
In this study, we analyzed fecal microbiota from 47 RCC patients and 51 healthy controls using 16S rRNA sequencing. The dominant phyla in both groups were Bacteroidetes, Firmicutes, Proteobacteria, and Actinobacteria, consistent with previous findings, confirming sequencing reliability. The gut microbiota functions as a complex symbiotic ecosystem critical for host metabolism, immunity, and cancer regulation. Disruption of this equilibrium by genetic or environmental factors can lead to dysbiosis and disease.
Our results revealed that RCC patients exhibited significantly reduced microbial diversity and distinct community structures compared with healthy individuals. At the genus level, Streptococcus and Parasutterella were enriched in RCC, with Parasutterella emerging as a potential biomarker in random forest analysis. Parasutterella has been associated with intrahepatic cholangiocarcinoma28 and promotes sarcoma proliferation in vitro.29 Streptococcus has been identified as an early marker of gastric and colorectal cancers.30,31 Conversely, Faecalibacterium and Roseburia were more abundant in healthy controls, consistent with their known anti-cancer roles. Roseburia produces butyrate, enhancing cytotoxic CD8+ T-cell activation and sensitizing tumors to PD-1 blockade and radiotherapy via the butyrate/OR51E1/RALB axis.32,33 Similarly, Clostridium spp. have shown anti-tumor effects in colorectal cancer models through CD8+ T-cell activation.34 Faecalibacterium, known for its anti-inflammatory activity, correlates with favorable treatment responses across several cancers.35
Correlation analyses revealed strong positive associations among Blautia, Subdoligranulum, Anaerostipes, Roseburia, Faecalibacterium, and Fusicatenibacter, as well as among Barnesiella, Ruminococcaceae_UCG − 014, [Eubacterium]_coprostanoligenes_group, Alistipes, and Ruminococcaceae_UCG − 002. Additionally, Bifidobacterium, Haemophilus, and Streptococcus displayed positive correlations. These complex microbial interactions may collectively influence carcinogenic or anticarcinogenic processes. Notably, the positive correlation between Roseburia and Faecalibacterium supports their synergistic protective roles in tumor suppression, whereas elevated Streptococcus and Bifidobacterium levels in RCC are consistent with their reported tumor-promoting properties.
This study provides comprehensive evidence that gut microbiota dysbiosis is closely associated with renal cell carcinoma (RCC). Using 16S rRNA high-throughput sequencing, we demonstrated that RCC patients exhibit significantly reduced microbial richness and diversity, distinct alterations in community composition, and a clear imbalance between beneficial and pathogenic taxa. Specifically, enrichment of Streptococcus and Parasutterella alongside depletion of Roseburia and Faecalibacterium suggests a shift toward a pro-inflammatory and tumor-promoting microbial environment. These findings support the hypothesis that the gut–kidney axis plays a crucial role in RCC pathogenesis through immune modulation, metabolic reprogramming, and epithelial–microbial interactions.
Furthermore, the identification of key discriminatory taxa by LEfSe and random forest analyses highlights the potential of gut microbial signatures as non-invasive biomarkers for RCC detection and prognosis. Future research integrating metagenomic, metabolomic, and immunologic analyses will be essential to elucidate the functional mechanisms underlying these associations and to evaluate microbiota-targeted interventions, such as probiotics, dietary modification, or fecal microbiota transplantation (FMT), as adjunctive therapeutic strategies. Overall, our findings not only enhance understanding of the complex interplay between the gut microbiome and renal carcinogenesis but also open new avenues for microbiota-based precision diagnostics and treatment in RCC.
The key reagents, materials, and their specifications used in this study are listed below:
1. DNA Extraction Kit:
2. 16S rRNA Gene PCR Primers:
3. High-Fidelity DNA Polymerase for Library Amplification:
4. DNA Quantification and Quality Control Instruments:
○ Spectrophotometer: NanoDrop 2000.
○ Supplier: Thermo Fisher Scientific.
○ Purpose: Assessment of DNA concentration and purity (A260/A280, A260/A230 ratios).
○ Fluorometer: Qubit 4.0 Fluorometer.
○ Supplier: Thermo Fisher Scientific.
○ Assay Kit: Qubit dsDNA HS Assay Kit (Catalogue No.: Q32851).
○ Purpose: Accurate quantification of DNA library concentration.
○ Bioanalyzer: Agilent 2100 Bioanalyzer.
○ Supplier: Agilent Technologies.
○ Chip: Agilent High Sensitivity DNA Kit (Catalogue No.: 5067–4626).
○ Purpose: Assessment of final library fragment size distribution and quality.
5. Sequencing Platform and Reagents:
| Views | Downloads | |
|---|---|---|
| F1000Research | - | - |
|
PubMed Central
Data from PMC are received and updated monthly.
|
- | - |
Provide sufficient details of any financial or non-financial competing interests to enable users to assess whether your comments might lead a reasonable person to question your impartiality. Consider the following examples, but note that this is not an exhaustive list:
Sign up for content alerts and receive a weekly or monthly email with all newly published articles
Already registered? Sign in
The email address should be the one you originally registered with F1000.
You registered with F1000 via Google, so we cannot reset your password.
To sign in, please click here.
If you still need help with your Google account password, please click here.
You registered with F1000 via Facebook, so we cannot reset your password.
To sign in, please click here.
If you still need help with your Facebook account password, please click here.
If your email address is registered with us, we will email you instructions to reset your password.
If you think you should have received this email but it has not arrived, please check your spam filters and/or contact for further assistance.

Comments on this article Comments (0)