Keywords
scRNA-seq, Scanpy, workflow, Quality Control, Normalization, Clustering, Database, Cell-Type Annotation, Visualization
This article is included in the Bioinformatics gateway.
This article is included in the Single-Cell RNA-Sequencing collection.
scRNA-seq, Scanpy, workflow, Quality Control, Normalization, Clustering, Database, Cell-Type Annotation, Visualization
Single-cell RNA sequencing (scRNA-seq) has significantly advanced our ability to profile and characterize cellular heterogeneity within biological systems. Its analytical landscape remains burdened by an excess of redundant computational tools that complicate reproducibility and hinder methodological clarity. Many workflows rely on extensive data reshaping through integration, imputation, or variance-stabilization procedures that lack validated noise models and are often applied to compensate for suboptimal hyperparameter tuning. Clustering strategies further disregard the hierarchical structure of cellular organization, obscuring lineage relationships and biologically meaningful subpopulations.
The field is characterized by an overwhelming expansion of computational tools,1 many of which duplicate existing functionality rather than advancing methodology, resulting in a fragmented ecosystem that hinders comparability and reproducibility. Integration across samples, batches, studies, or datasets should be attempted only after hyperparameters have been systematically evaluated to minimize technical variation across datasets. When strong batch effects persist, their underlying sources must be identified and quantified. Variation introduced by library preparation, sequencing chemistry, or cell handling should be addressed both experimentally and analytically rather than corrected algorithmically. Imputation and noise-reduction methods can suppress apparent noise but often distort the original signal. The statistical nature of scRNA-seq noise remains poorly defined2 and current approaches lack validated models to separate technical from biological variation.3 Recent studies show that the perceived improvement in signal quality may instead reflect amplified noise.3,4 The limited understanding of the statistical properties of scRNA-seq data is also evident in simulation frameworks. Benchmarking studies typically measure similarity between real and simulated data, but not their differences,5 leading to evaluations that favor methods reproducing feature-extracted, algorithmic reconstructions of the input, rather than generating biologically meaningful variation.
Many clustering strategies often ignore the hierarchical structure of cellular organization. Major lineages should first be separated at coarse resolution, followed by finer subdivision to resolve transcriptionally distinct subpopulations. Because Leiden, the standard method for single-cell RNA-seq clustering, operates at fixed granularity,6 without sequential subclustering, cells from distinct lineages are compared against each other in one-versus-rest differential analyses, obscuring lineage relationships and confounding interpretation.
Inferring genomic alterations from RNA-based data is conceptually fragile, as transcriptional variation reflects regulation and noise rather than true genomic state. Reference-free methods such as CopyKAT7 and SCEVAN8 were published without evaluation on healthy tissue, inevitably leading to false-positive CNV calls.9 Reference-based tools such as InferCNV (https://github.com/broadinstitute/infercnv) and sciCNV10 must include standardized, well-characterized reference panels validated across multiple tissues to ensure reproducibility and reduce context-dependent bias in CNV detection. Reliable downstream analyses require high-quality data (https://kb.10xgenomics.com/hc/en-us/articles/ 115002022743-What-is-the-recommended-sequencing-depth-for-Single-Cell-3-and-5-Gene-Expression-libraries ) typically exceeding 50,000 reads per cell, with >80% sequencing saturation, a standard rarely met in routine single-cell experiments such as Human Tonsil Atlas atlas.11
Trajectory inference and RNA velocity analyses are particularly unstable. Preprocessing differences and quantification inconsistencies can produce divergent or even contradictory trajectories, and structure may emerge even from randomized data,12 turning technical noise into biological narratives and underscoring the need for standardized preprocessing and validation.
All user-defined settings, including filtering thresholds and model hyperparameters that directly affect interpretation, are treated as hyperparameters because they determine analytical outcomes and reproducibility. Hyperparameter tuning is frequently underestimated, and many studies fail to document how these values are selected or adjusted.13 These choices have a direct impact on normalization, integration, and clustering, yet are often applied ad hoc without systematic evaluation. Transparent and reproducible parameter management is essential to ensure that results reflect biological reality rather than computational or technical artifacts. Improper configurations can generate false biomarkers and misguide clinical decisions with potentially harmful consequences.
To overcome these limitations, we introduce ScToolkit, a consolidated framework that expands the capabilities of Scanpy14 without fragmenting the ecosystem further. It provides a coherent structure linking all major analysis steps, from quality control and normalization to clustering and downstream interpretation. All analytical choices are stored in a unified configuration within the AnnData object, ensuring transparent, comparable, and reproducible workflows. The framework integrates external biological reference resources and supports vectorization, JIT (Just-In-Time) compilation, and GPU acceleration for efficient large-scale analysis. Together, these features create a unified environment that strengthens analytical precision, preserves biological interpretability, and upholds good scientific practice.
Data initialization with setup_adata
In contrast to default Scanpy, where preprocessing parameters must be specified at each call and not centrally stored, ScToolkit introduces a standardized initialization step via the setup_adata function. This augments the AnnData object with:
1. Configuration dictionary (adata.uns[“config”])
A unified registry covering quality control, normalization, clustering, plotting, and downstream analyses parameters. It encodes both Scanpy arguments with proper defaults and project-specific arguments, including curated marker-gene handling, organism-specific geneset handling, and file output policies. GPU acceleration is integrated into the config, enabling automatic switching between CPU and GPU backends for PCA, nearest-neighbor search, and clustering.
2. Statistics registry (adata.uns[“stats”])
A bookkeeping structure recording which preprocessing steps have been executed, preventing redundant or conflicting operations across the pipeline.
Existing configurations and statistics are preserved unless explicitly overwritten, facilitating reproducibility and iterative refinement of analyses. By consolidating the config, state-tracking, and GPU initialization into a single entry point, setup_adata transforms a raw AnnData object into a fully contextualized analysis container. This contrasts with unmodified Scanpy, where users must manually manage parameters, track preprocessing steps, and configure hardware acceleration. From now on if config is stated, it refers to adata.uns[‘config’].
Quality control preprocessing with all_qc_preprocessing
After initialization, ScToolkit provides a dedicated entry point for systematic quality control via the all_qc_preprocessing function. This standardizes QC annotation, reduces defective cell likelihood, and ensures reproducibility and interoparability across datasets.
Key operations include:
• Gene family annotation using curated organism-specific definitions for mitochondrial, ribosomal, hemoglobins, pseudogenes, and immunoglobulin/T-cell receptor loci. Gene families are projected into adata.var as boolean flags for downstream filtering and visualization. Databases bundled with the package (Ensembl-GTF-derived,15 HGNC/MGI16,17) curated categories, and housekeeping gene sets18) extend Scanpy’s defaults by systematically tracking additional biologically relevant gene families.
• QC metric calculation adapts Scanpy’s standard metrics by removing redundant keys, simplifying names, and casting percentages to reduced precision (float16) for memory efficiency. All QC keys are tracked in the config for consistent reuse across analyses and reproducibility.
• Custom metrics provide additional sensitivity, including n_unique (spread of expression values per cell), max_count, and top-ratio scores (top_5_ratio, top_10_ratio) to detect overexpression bias. These capture low-quality transcriptomes that would pass default thresholds.
• Filtering and tagging apply thresholds specified in the config (pp.filter_qc_var_obs, pp.filter_qc_var_var). Failures can be flagged or removed, with counts and percentages summarized in adata.uns[“stats”]. Plots include threshold overlays and clipping of extreme outliers, improving robustness compared to Scanpy defaults.
• Config tracking ensures reproducibility by centralizing all QC-related keys, thresholds, and gene family definitions in adata.uns[“config”]. This provides transparency and reproducibility absent from default Scanpy, where QC keys are scattered and not formally registered.
Pre-clustering normalization with Run_all_prep_steps_clustering
Following QC, Run_all_prep_steps_clustering provides centralized preprocessing and normalization. This integrates normalization, log transformation, scaling, and gene selection into a reproducible pipeline controlled entirely by the config.
Extensions beyond Scanpy include:
• Mixture of Regex-based and gene-list gene exclusion and centralized control of preprocessing steps.
• Modular storage of intermediate states in adata.layers, enabling reproducibility and GPU/CPU branching.
• Explicit logging of executed preprocessors in adata.uns[“stats”][“preprocessors_ran”], ensuring idempotence and transparency.
By consolidating these steps, the function guarantees consistent inputs for clustering, avoiding redundant calls and user errors.
Clustering orchestration with cluster_SC_scanpy_like
cluster_SC_scanpy_like structures PCA, neighborhood graph construction, Leiden clustering, and UMAP embedding in a single highly configurable function, providing a failsafe and streamlined workflow beyond Scanpy’s separate steps. Each step can be perfomed on a CPU or GPU.
Enhancements include:
• PCA with variance-based selection of informative components, capped by data rank, to estimate the appropriate number of components, n_pcs.
• Neighbor graph construction using the selected n_pcs, aligned with explained variance contribution, avoiding arbitrary choices such as manual elbow selection.
• search_for_leiden_resolution and search_for_neighbor_params systematically vary resolution, n_pcs, and n_neighbors to identify parameter sets that yield stable and biologically meaningful cluster separation, returning the corresponding UMAPs with marker overlays, density plots, and separation metrics.
This ensures reproducible and biologically meaningful clustering without manual trial-and-error.
Downstream analysis and visualization
run_downstream integrates core post-clustering functionality:
• Differential expression (DEG) with parallelized Wilcoxon tests (standard z-score approximation and JIT-compiled permutation-based variants), and group-specific DEG handling.
• Accurate log-fold change calculation per group. Unlike the simplified approach implemented in Scanpy, this method ensures formal correctness without compromising performance.
• Export utilities generating per-cluster, per-direction CSVs with both filtered and unfiltered genes, annotated against MSigDB modules and user-defined gene sets.
• Marker and gene set handling with bi-directional conversion between dictionaries and DataFrames, autosplitting of large sets for plotting, and prioritized ranking by highly variable gene (HVG) status.
• Automated visualization conditioned on the config and saved into structured folder hierarchies, covering UMAP overlays in discrete and continuos, dotplots, violin plots, heatmaps, and ranked gene plots.
These downstream steps extend Scanpy’s minimal plotting and DEG support into a comprehensive, automated framework for reproducible structured interpretation.
ScToolkit is distributed as a Docker container bundling both Python and R environments to ensure reproducibility and straightforward deployment across platforms as far as possible for GPU usage. For users preferring local installation, the GitHub repository provides multiple conda environment definitions (.yml files) tailored to different use cases:
• Default environment: GPU-enabled with RAPIDS and CUDA libraries preconfigured.
• No-GPU environment: Fallback for systems without CUDA support, such as recent macOS devices or machines limited to onboard GPUs.
• Complete maintainer environment for development and continuous integration and documentation updating.
Documentation is generated with Sphinx and kept synchronized with the source code, ensuring that both API references and tutorials remain current. The repository includes extensive Jupyter notebooks that demonstrate full end-to-end analyses, from raw data initialization to clustering and downstream interpretation. Additional notebooks showcase advanced features such as curated gene family handling, GPU acceleration, and automated DEG export.
This dual strategy, providing both containerized execution and conda-based environments, ensures accessibility for beginners while maintaining flexibility for advanced users and developers. Together with reproducible notebooks, this structure guarantees that ScToolkit can be deployed consistently in diverse computational settings, from laptops to GPU clusters.
For use case analysis, we accessed publicly available single-cell RNA sequencing (scRNA-seq) resources. Specifically, we retrieved datasets from the DISCO database (https://disco.bii.a-star.edu.sg/)19 including scRNA-seq profiles from human tonsil (n = 92,114 cells) and peripheral blood (n = 169,686 cells). In addition, we obtained a tonsil scRNA-seq dataset from the Tonsil Atlas database11 encopassing 462,352 cells. The full use-case analysis described below is available in the Supplementary Data as a PDF export of the corresponding Jupyter Notebooks.
Next, we applied a rigorous quality control workflow to isolate high-quality single-cell transcriptomes and used violin plots to assess data quality across conditions and tissues (Figure 1A). Cells were excluded if they expressed fewer than 500 genes, fewer than 700 total counts, or more than 18,000 counts. To minimize the inclusion of low-complexity libraries, cells with fewer than 10 unique genes were removed. Similarly cells with more than 5,000 genes were removed to prevent doublets. Cells with >10% mitochondrial content were excluded to reduce bias from dying or stressed cells. In addition, cells with <1.5% ribosomal transcripts or >1% HGNC-annotated pseudogene expression were filtered out ( Figure 1A). At the gene level, only features expressed in at least 2,000 cells, with a minimum of seven unique counts, a minimum of 2,000 total counts, and at least 10 maximum counts across cells, were retained. Beyond the standard parameters (n_genes and n_counts), we included n_unique as a measure of distributional spread, providing a more general indicator of transcript diversity than mean- or variance-based metrics that assume normality. The percentages of housekeeping (pct_HK_gtex), intergenic (pct_GTF_IG_genes), and pseudogene (pct_HGNC_pseudogene) expression offer complementary insights into sample composition and annotation fidelity. The displayed metrics represent a selected subset of all available quality control measures, shown here to demonstrate the extended functionality and interpretability of the workflow. In Figure 1A, only the top 10% quantile range of each metric is displayed, emphasizing the high end of the distributions where duplicate or outlier cells typically accumulate. This focused view enables refined inspection of potential overrepresented or low-complexity transcriptomes that define the upper QC thresholds. The shown metrics represent a subset of all available QC measures, selected to demonstrate the workflow’s extended functionality and interpretability.
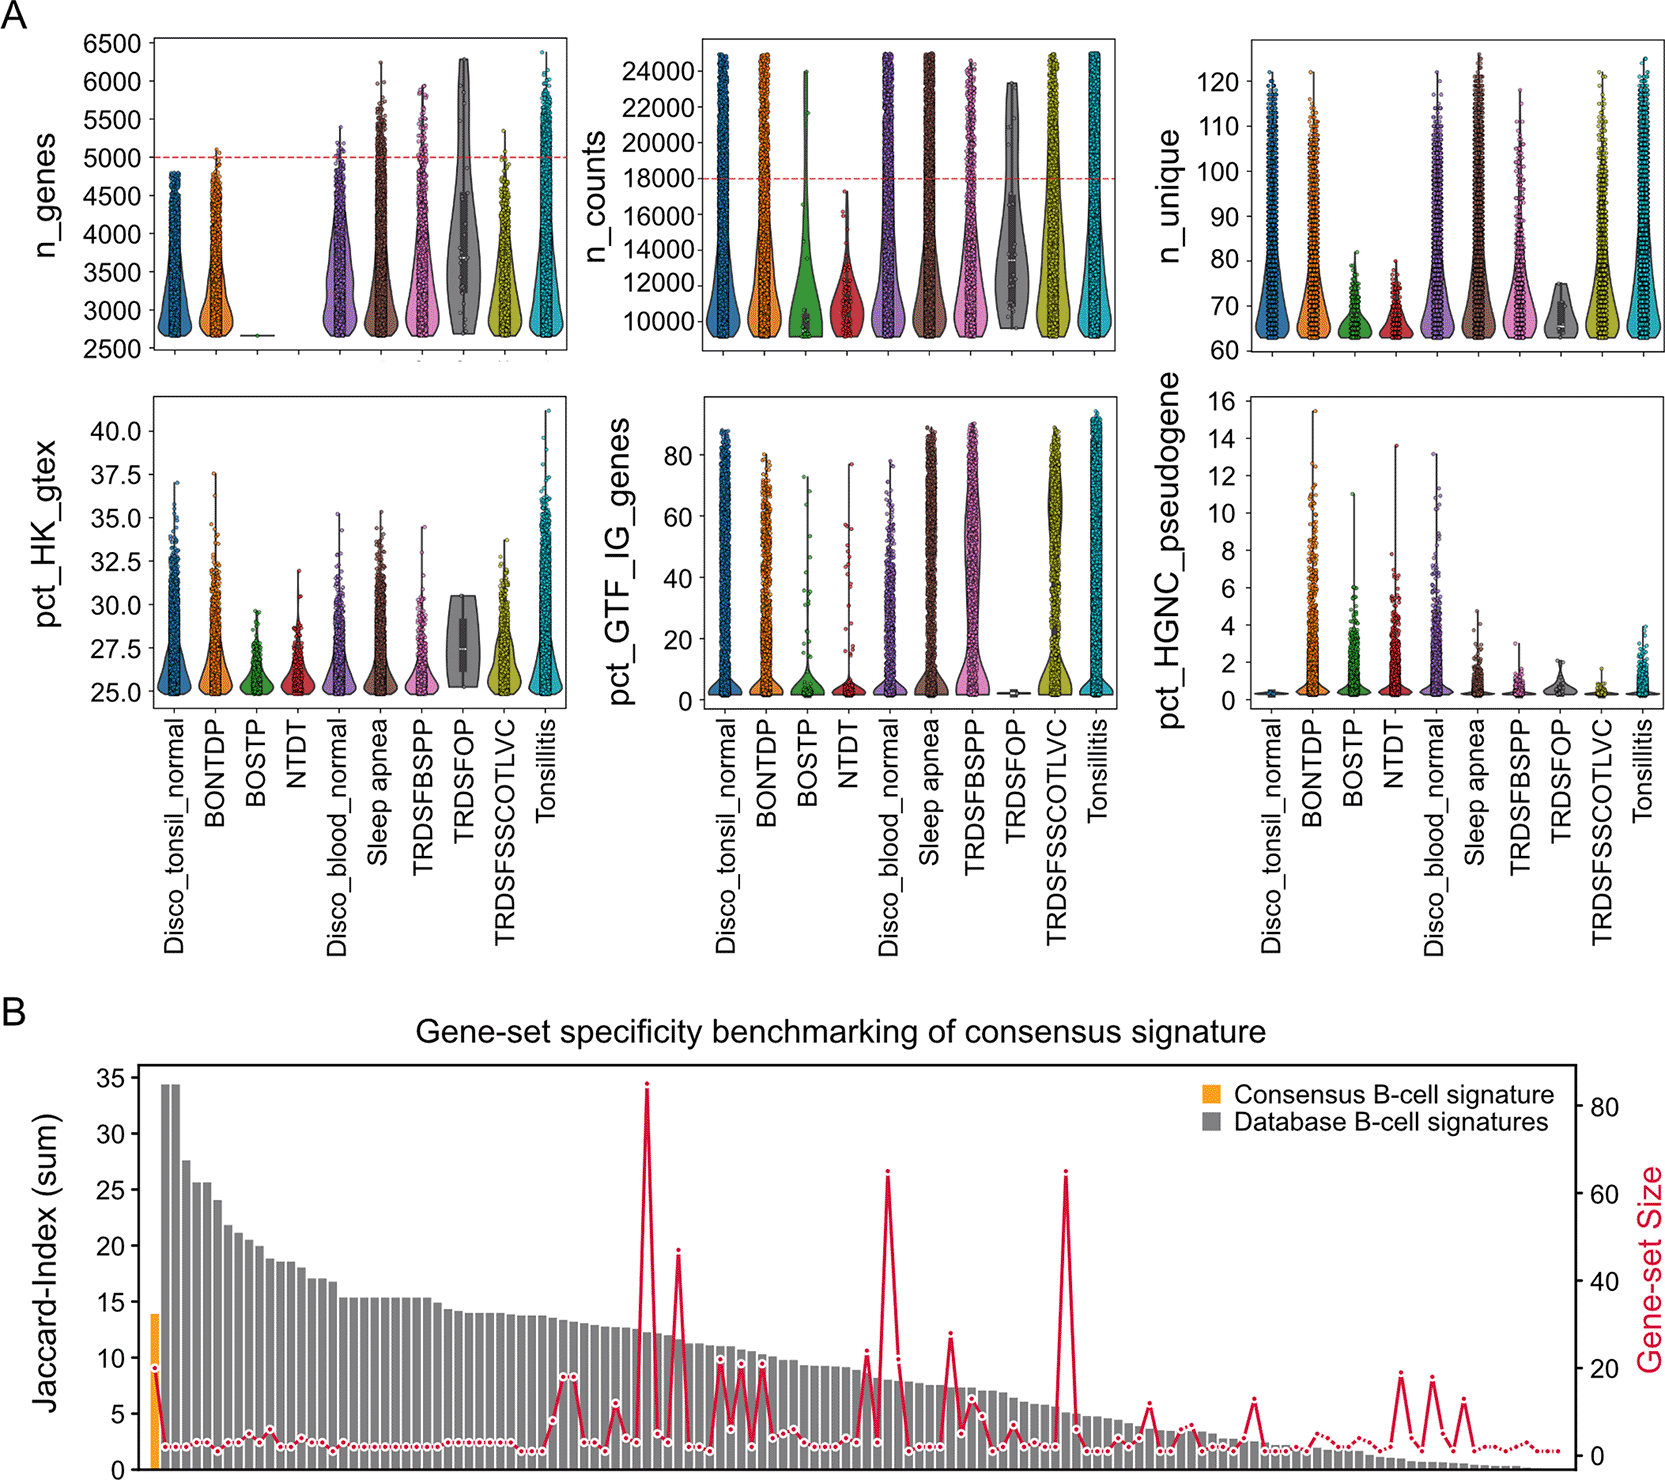
(A) Violin plots generated with plot_qc_violins, showing standard and extended quality control metrics across groups for setting up upper QC thresholds. Each violin represents the distribution of n_genes and n_counts per cell, alongside n_unique as a measure of transcript count spread. Additional panels display pct_HK_gtex (housekeeping genes from GTEx), (immunoglobulin genes from the Ensembl GTF), and pct_HGNC_pseudogene (pseudogenes from HGNC). The dashed red line marks the applied filtering threshold, and the function displays only the defined top quantile range (here, the top 10%) to provide a focused and precise view for setting refined upper thresholds.
(B) Bar plot summarizing cross-database overlap of B-cell gene sets against non B-cell gene-sets. The first bar represents our consensus B-cell signature derived from high-recurrence markers across databases, while the remaining bars correspond to the individual B-cell gene sets used in its construction. Bar heights indicate the summed Jaccard index of each gene set against all non–B-cell gene sets in the reference databases, quantifying cross-category similarity and shown on the left legend. Red dots, connected by a line, denote the total number of genes in each respective gene set, with the corresponding scale shown on the right legend.
The results reveal that parameters such as blood of solid tumor patient (BOSTP), non-tumor disease tissue (NTDT), and Tonsil removed during surgery for oropharyngeal papillomatosis (TRDSFOP) show generally lower levels across n_genes, n_counts, and n_unique, lowering the expectation of doublets within these samples. In contrast, the consistent percent of house-keeping genes (pct_HK_gtex) values across all conditions indicate viable and transcriptionally active cells, suggesting comparable baseline activity among cell types. The pct_GTF_IG_genes distributions show a distinct multimodal pattern, where the upper mode indicates the presence of plasma cells. Finally, elevated pct_HGNC_pseudogene values in BONTDP, BOSTP, NTDT, and Disco_blood_normal flag the presence of subsets of low-quality or degraded cells. The remaining groups display lower pseudogene percentages consistent with higher-quality transcriptomic profiles.
To explore the initial annotation of cell clusters, we utilized a curated library of cell type -specific gene signatures from four complementary resources: PanglaoDB,20 CellMarker,21 SCType,22 and CellTypist (v2).23 To increase tissue relevance, each database was then subset signatures associated with tonsil and blood, ensuring that the resulting markers reflected the diversity of resident immune cell populations within these compartments. This process demonstrates the database integration and refinement functionality of the workflow, we used three core functions: get_ref_db(), search_database(), and get_element_and_counts_with_positional_sum(). First, get_ref_db() collects all available cell type-specific genesets from the supported databases (PanglaoDB, CellTypist, CellMarker, and SCType). Next, search_database() extracts the subset of genesets matching a specified cell type, defined by the user using regular expression.
Notably, substantial heterogeneity was observed across gene-signatures for the same annotated cell type. To address this, we generated consensus signatures by integrating overlapping features. We calculated the frequency of occurrence of each gene across signatures for a given cell type, ranked genes by their frequency, and defined the top 20 most recurrent genes as the consensus signature ( Figure 1B). Specifically, we used get_element_and_counts_with_positional_sum() to rank all genes by their recurrence across the retrieved genesets, generating consensus signature by taking the top 20 genes. As an exampler, we retrieved cross-database overlap of B-cell gene sets and subsequently generated their consensus signature. For each B cell signature from the databases and the B cell consensus signature, the summed Jaccard index was calculated against all nonB cell gene sets in the reference databases. Results showed that our B cell consensus signature exhibits a minimum similarity (relatively low Jaccard index) to nonB cell signatures compared to the database redived B cell signatures ( Figure 1B). This prevents the selection of unspecific gene-set signature from many existing signature ressources. The refined scToolkit reference represents a consensus-based, high-confidence collection of cell-type-specific gene signatures, illustrating the workflow’s ability to generalize this procedure to any cell-type-specific refinement task.
Following quality control, we performed unsupervised clustering on the combined dataset using the Leiden algorithm. Cells were projected into UMAP space, where coloring by tissue origin revealed intermixed clustering of cells from Blood and Tonsil ( Figure 2A). The UMAP density distributions show a continuous embedding without visible batch effects between blood- and tonsil-derived cells. Cells from both tissues occupy overlapping yet structured regions, indicating comparable transcriptomic profiles and proper integration of datasets ( Figure 2A). To assign cell identities, we applied single-cell level gene set enrichment analysis using over-representation analysis algorithm (ORA) with our consensus gene signatures. Each cell was assigned the identity for which its transcriptome showed the maximum ORA enrichment score (Idxmax). The major cell types identified included B cells, dendritic cells (DCs), granulocytes, macrophages, NK cells, T cells, and plasma cells ( Figure 2B). To validate these annotations, we compared our results with reference annotations (referred to as ground-truth annotation from hereafter) provided by the DISCO and Tonsil Atlas databases ( Figure 2C). The idxmax ORA assignments align with the broad ground-truth annotation ( Figure 2C), demonstrating that clusters capture major immune and myeloid populations while maintaining distinct lineage boundaries. Notably, cell types of similar identity cluster in close proximity within the joint embedding. This confirms that the refinement and preprocessing preserve biological relationships rather than dataset origin. For instance, cells belonging to the same category (e.g., B cells or T cells) cluster together regardless of tissue origin. This highlights the robustness and reliability of our workflow, demonstrating its ability to successfully integrate datasets from different tissues without the need for specialized batch-correction algorithms ( Figure 2A-B).
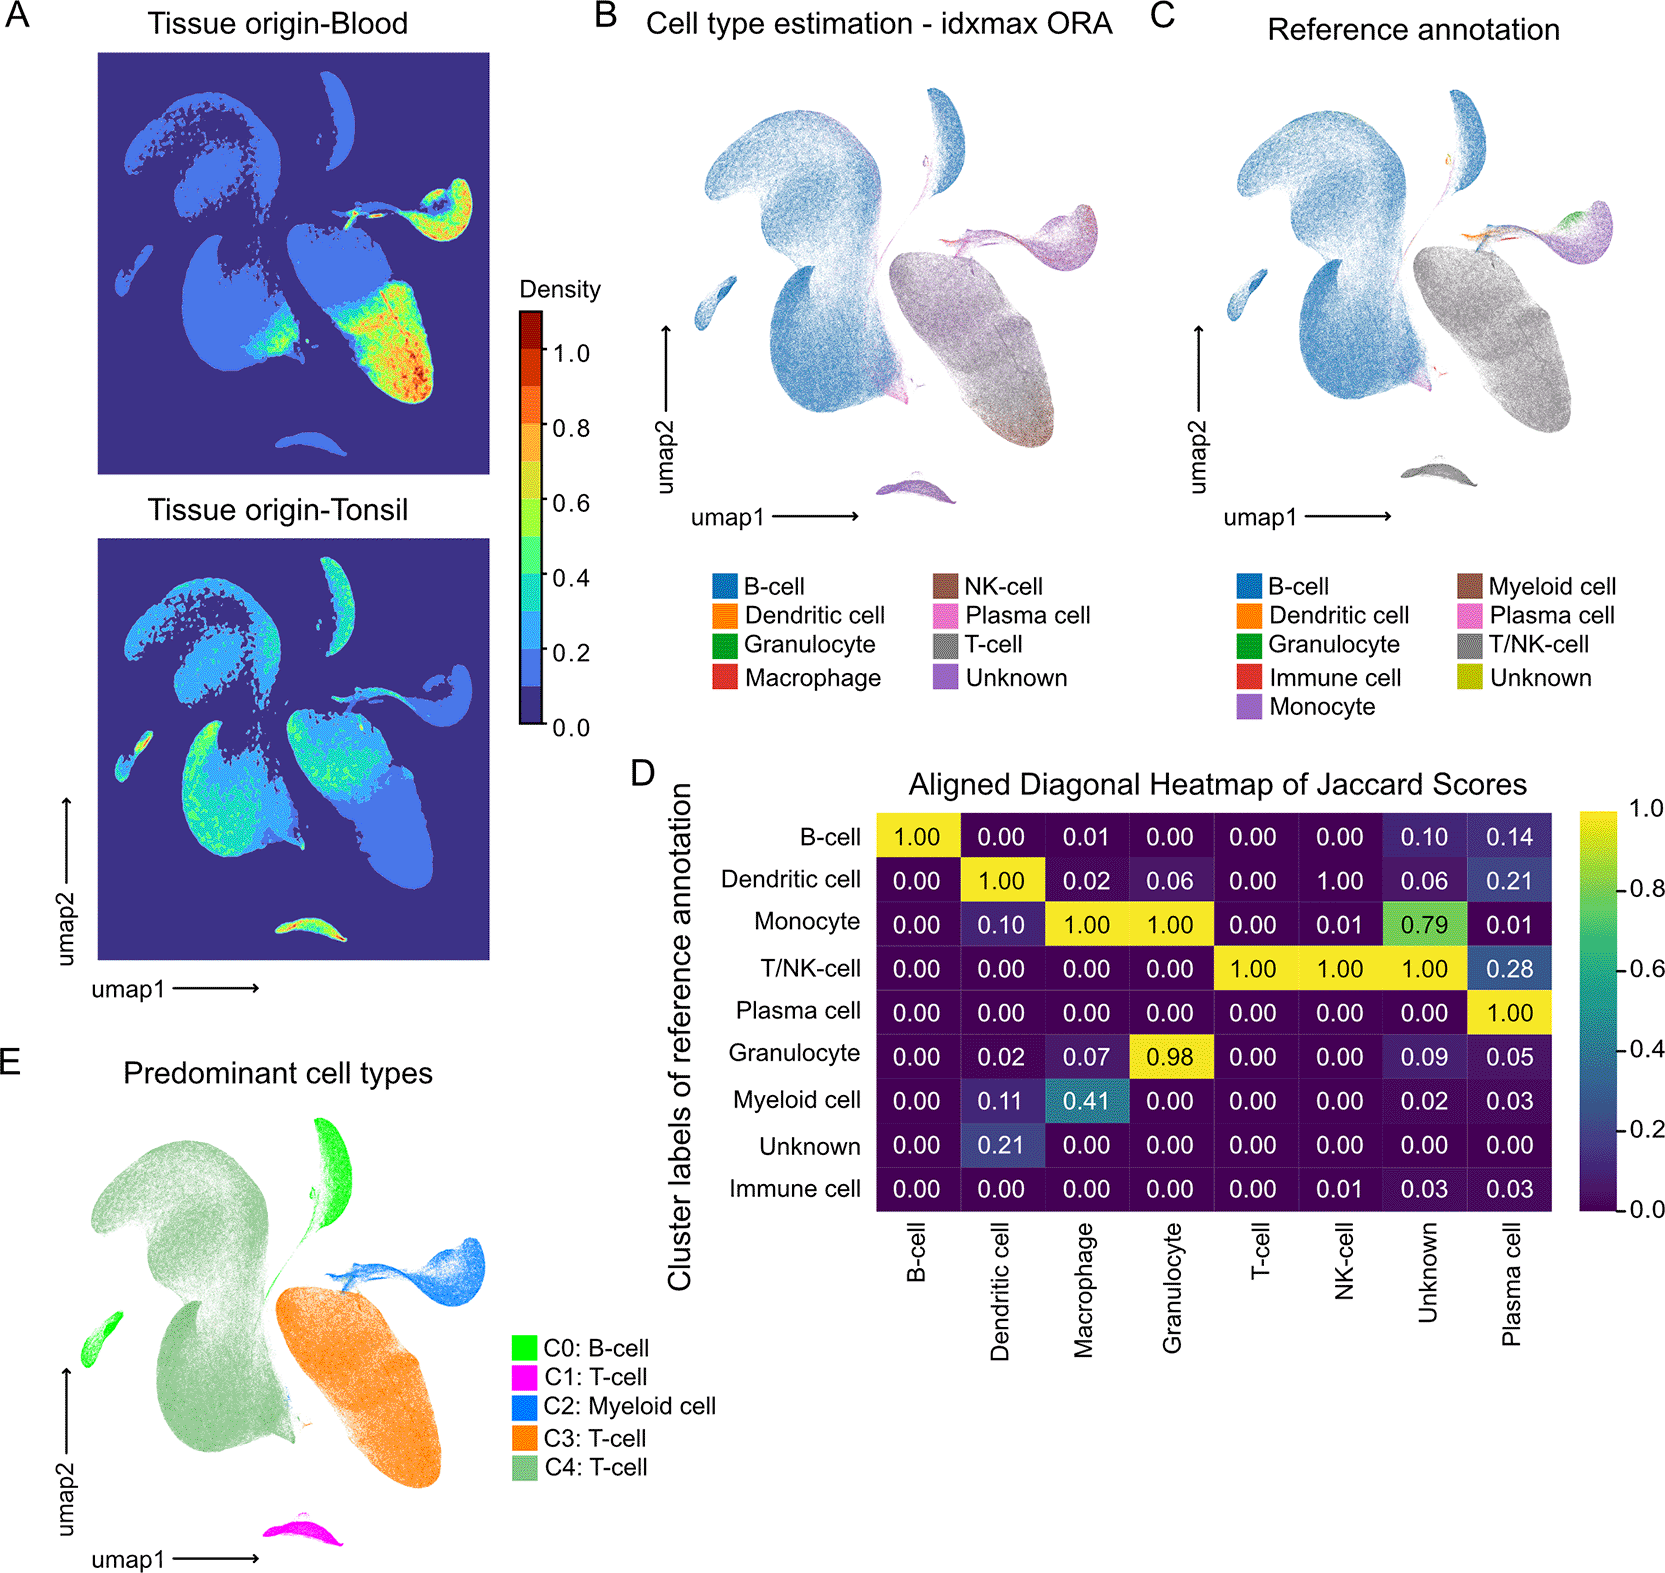
(A) UMAP density maps generated with plot_embedding_density(), showing 0–1 scaled cell densities estimated using FFT-based kernel density estimation (KDEpy). The upper panel represents cells of blood origin, the lower those from tonsil tissue.
(B) UMAP projection colored by the idxmax categories derived from over-representation analysis (ORA) of the cell type refinement gene sets. Each cell is assigned to the cell type with the highest enrichment score if the adjusted p-value is below the defined significance threshold, illustrating clear segregation of major immune populations and preservation of myeloid lineage relationships.
(C) Corresponding UMAP annotated with the broad reference cell type labels from DISCO and the Tonsil Atlas, where closely related subtypes (e.g., B-cell subclasses) were combined into generalized categories.
(D) Heatmap of Jaccard similarity scores between refined (idxmax ORA) and reference annotations, generated with plot_jaccard_heatmap_cluster_comparison(). Values are 0–1 scaled, with highest overlaps along the diagonal, reflecting accurate matching between methods. Cross-lineage similarities (e.g., Monocyte–Macrophage, Monocyte–Granulocyte) indicate biologically plausible relationships.
(E) UMAP displaying Leiden clusters annotated by their predominant reference-derived cell types, using only the ground truth labels.
To quantitatively validate/support our annotations, we computed the Jaccard similarity index between our ORA-based assignments and the reference (ground-truth) labels. The resulting heatmap ( Figure 2D) quantitatively supports this correspondence, with high overlap values between identical or closely related cell types and minor off-diagonal similarities reflecting lineage proximity. Concordance as reflected by the Jaccard index ( Figure 2D), demonstrated the strongest agreement (Jaccard index = 1) for the most abundant populations, including B cells, T/NK cells, granulocytes, plasma cells, DCs, and macrophages. Of note, in ground-truth annotation T and NK cells were combined into a single category, and kept separate in T and NK cells in Idxmax ORA annotations. Interestingly, cells classified as “unknown” within Idxmax ORA annotations, showed a distribution of Jaccard Scores across many ground-truth cell types with the highest score for T/NK cell categroy. To annotate the clusters we selected the predominant cell types of the ground truth ( Figure 2E). The Leiden clustering labeled with ground-truth cell types ( Figure 2E) further shows that clusters are composed of cells from both tissues and databases, confirming that integration was successful and not driven by dataset-specific biases.
To investigate the functional roles of the annotated cell types, we performed a pathway enrichment analysis based on differentially expressed genes (DEGs). DEGs were first identified by comparing each cell type specific cluster against all remaining clusters and stringently filtered to ensure robustness. DEGs were retained only if expressed in at least 15% of cells in one of the compared cell type resolved cluster, with an adjusted p-value < 0.0001 and an absolute log2 fold change ≥ 0.5. Following filtering, DEGs are intersected with hallmark gene sets from MSigDB. For each pathway, the z-scores of Wilcoxon rank-test u-statistics from overlapping genes are summed and scaled to –1 to 1. This analysis revealed distinct pathway overlap patterns across cell types. Myeloid cell cluster showed strong overlap of inflammatory signaling pathways, including inflammatory response, TNF-α signaling, and complement activation ( Figure 3A). Notably, differences also emerged between T-cell subclusters where the C3: T-cell cluster showed selective overlap of Allograft Rejection and TNF-α signaling genes, which were absent in C1: T-cell cluster, suggesting functional specialization among T-cell subtypes ( Figure 3A).
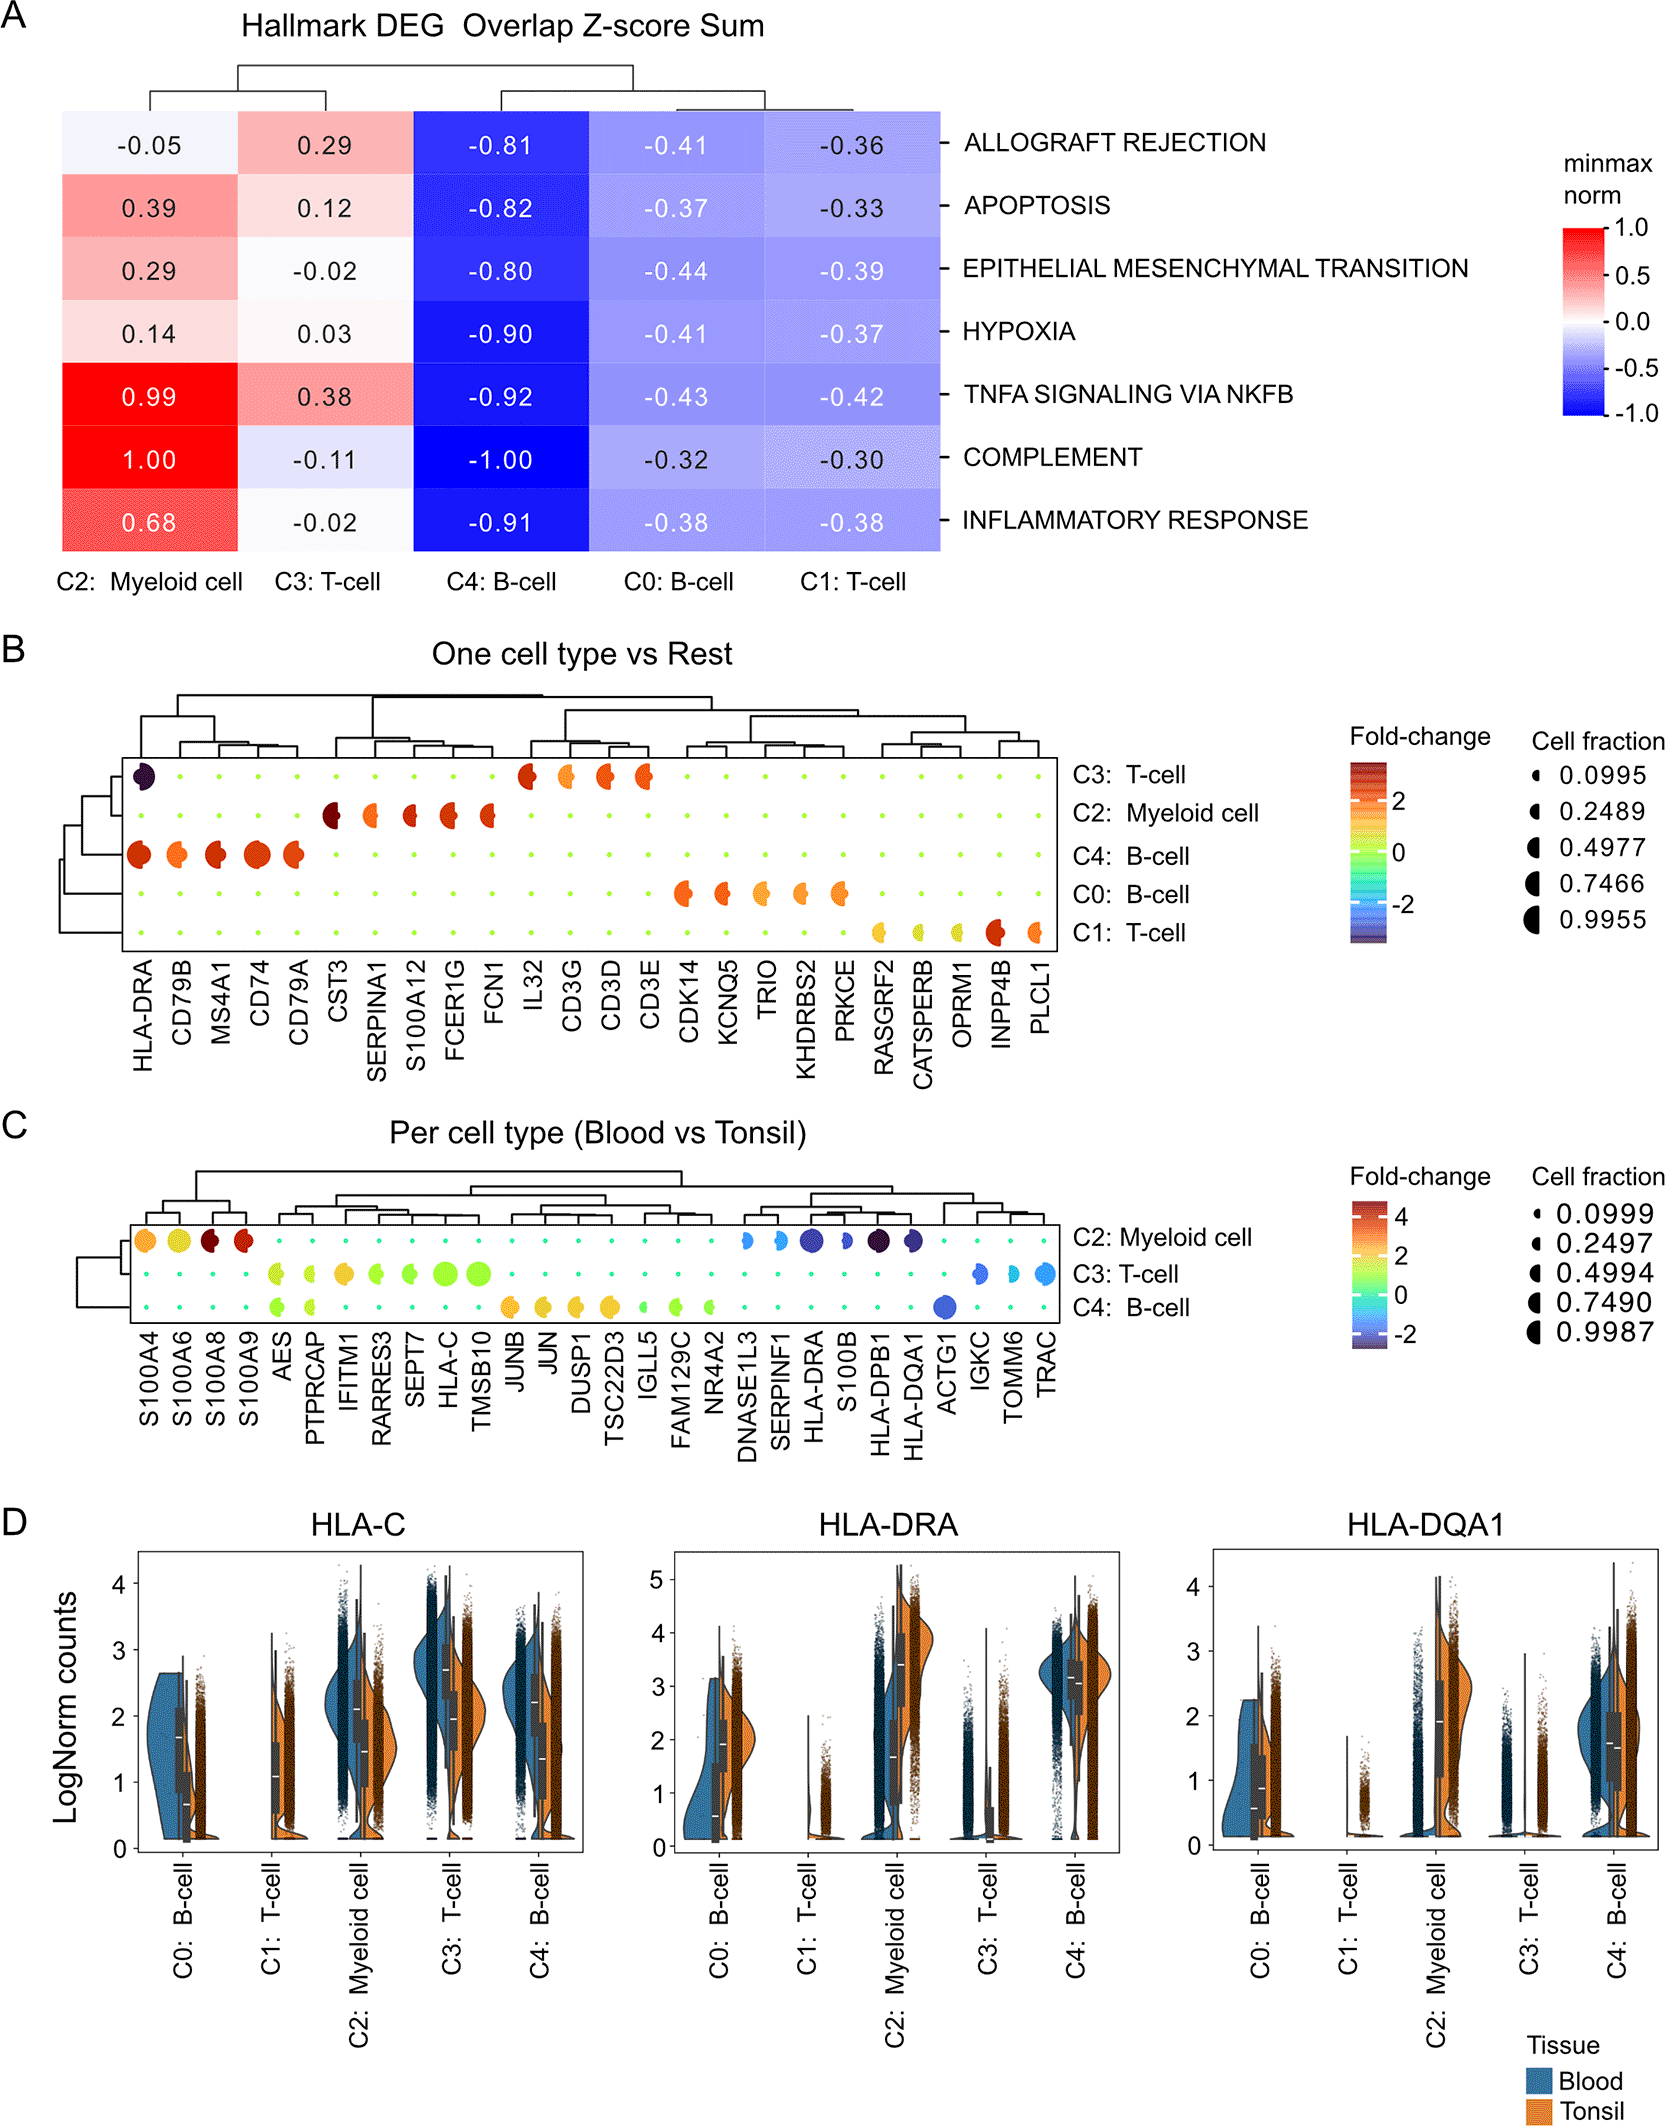
(A) Heatmap of hallmark pathway activity across cell type-annotated clusters, generated from differentially expressed genes (DEGs) meeting stringent thresholds (adjusted p < 10-4,|log2FC|> 0.5, ≥15% of cells expressing in either group). DEGs were mapped to hallmark gene sets from MSigDB, and Wilcoxon rank test u-statistics were aggregated as summed z-scores, normalized between –1 and 1. Only pathways or clusters with at least one normalized score exceeding ±0.5 are displayed, emphasizing those with the strongest pathway activity changes across clusters. The heatmap summarizes pathway activity across clusters, highlighting dominant biological programs.
(B) Split dot plot summarizing differential expression results across cell type–annotated clusters. Each row represents a cluster and each column one of the top five differentially expressed genes. Dot color encodes the log2 fold-change between the cluster and all remaining cells, while dot size reflects the fraction of expressing cells in test cell type (left) and in any other (right). Both axes are hierarchically clustered to highlight shared expression patterns and relationships among clusters and marker genes.
(C) Split dot plot comparing differential expression between blood- and tonsil-derived cells within each cell type–annotated cluster. Layout and scaling follow panel (B). Dot color encodes the log2 fold-change between Blood and Tonsil in a particular cluster, while dot size reflects the fraction of expressing cells in Blood (left) and Tonsil (right). Rows represent clusters whereas columns represent the top ten differentially expressed genes per comparison, hierarchically clustered to reveal shared condition-specific regulation across clusters.
(D) Split violin plots for selected genes (HLA-DRA , HLA-C , HLA-DQA1) across clusters, grouped by tissue of origin. Each violin is divided into halves representing blood (left) and tonsil (right) conditions; inner boxes mark medians and interquartile ranges, and points show individual cells.
Another visualization option is to show the top DEGs for each cluster as split dot plots, where the log2 fold change is color coded ( Figure 3B). The percent expression of DEGs is displayed as split circles, with the left half representing the expression of the cluster of interest and the right half representing expression of all other cells combined. Corroborating with earlier findings, DEG analysis revealed two transcriptionally distinct T cell populations. C3: T-cell cluster was characterized by high expression of canonical T cell receptor (TCR) components (CD3E, CD3D, CD3G) together with IL32, consistent with a population of conventional, activated T-cells ( Figure 3B). In contrast, the C1: T-cell cluster lacked strong expression of CD3 genes and was instead enriched for signaling-related transcripts, including INPP4B (PI3K/AKT signaling), RASGRF2 (Ras/MAPK activation), and PLCL1 (calcium signaling regulation), as well as CATSPERB and OPRM1, suggesting a specialized, non-classical functional state ( Figure 3B). The two Bcell clusters (C0: B-cell and C4: B-cell) also showed differential marker experssion. C4: B-cell cluster express genes characteristic of mature B-cells, including B-cell receptor (BCR) components (HLA-DRA , CD79B, CD79A), a B-cell surface antigen (MS4A1), and a molecule involved in antigen presentation that’s also expressed in B cells (CD74) ( Figure 3B). C0: B-cell cluster consists of genes related to B-cell activation, survival, and differentiation, with KHDRBS2 and TRIO involved in signaling, CDK14 and PRKCE playing roles in cell cycle and signaling respectively, and KCNQ5 being less specific to B-cells but also involved in cell processes ( Figure 3B).
Next, we investigated compartment-specific transcriptional differences within the same immune cell types. For this analysis, we selected clusters that contained a comparable number of cells from both blood and tonsil, including C2: Myeloid-cell, C3: T-cell, and C4: B-cell clusters. Differential expression analysis (DEG) was then performed between the two compartments (blood and tonsil) to identify genes driving tissue-specific adaptations within each cell type. DEG analysis revealed a distinct enrichment of genes associated with immune regulation and tissue adaptation in the tonsil ( Figure 3C). A comparative analysis of myeloid cell clusters from blood and tonsil revealed distinct transcriptional signatures. Blood myeloid cells were characterized by high expression of S100A4, S100A6, S100A8, and S100A9, genes, which are associated with inflammation, cytoskeletal dynamics, and acute immune activation ( Figure 3C). In contrast, tonsil myeloid cells showed elevated levels of HLA-DRA , HLA-DPB1, and HLA-DQA1, reflecting enhanced antigen-presenting capacity, together with increased expression of SERPINF1, and DNASE1L3, indicative of tissue adaptation and immune regulatory functions ( Figure 3C). Similarly, DEG analysis revealed distinct transcriptional features between blood and tonsillar T-cells. Compared with tonsillar T cells, blood-derived T cells showed higher expression of the interferon-stimulated genes IFITM1 and RARRES3, together with increased AES, PTPRCAP, and SEPT7, indicative of an interferon-responsive and activated circulating T-cell state ( Figure 3C). In contrast, tonsillar T cells exhibited elevated levels of TRAC and IGKC, reflecting active T-cell receptor signaling and local immune activation within the lymphoid tissue ( Figure 3C). Analysis of distinct transcriptional profiles between blood and tonsillar B-cells revealed that blood B-cells exhibited higher expression of JUN, JUNB, DUSP1, and TSC22D3, indicating activation of immediate-early response and stress-regulatory pathways characteristic of circulating immune cells ( Figure 3C). In contrast, tonsillar B-cells showed increased expression of ACTG1, consistent with enhanced cytoskeletal remodeling and local activation within the lymphoid microenvironment ( Figure 3C). Together, these results indicate that tonsil immune cells adopt a tissue-adapted, immunoregulatory phenotype that differs markedly from blood-derived immune populations.
Analysis of HLA gene expression revealed compartment-specific patterns across immune cell types ( Figure 3D). HLA-C , a class I molecule, showed elevated expression in blood myeloid, B-cells, and T-cells, reflecting stronger class I–mediated antigen presentation in circulating immune populations. In contrast, HLA-DRA and HLA-DQA1, both class II molecules, were highly expressed in tonsillar myeloid cells ( Figure 3D), consistent with enhanced antigen-presenting activity within the lymphoid tissue. These findings highlight differential regulation of antigen presentation pathways between blood and tonsil compartments.
Single-cell transcriptomics, a core component of the Method of the Year 2013,24 has become a cornerstone of modern molecular biology. It enables the unprecedented dissection of cellular heterogeneity, lineage relationships, and transcriptional dynamics across tissues and conditions.25 Yet, despite this technological progress, analytical workflows remain fragmented, inconsistently parameterized, and difficult to reproduce.
ScToolkit addresses these very limitations by unifying preprocessing, normalization, clustering, and visualization within a single reproducible framework. At its core, configuration and metadata tracking are embedded in the AnnData object, ensuring transparent provenance and consistent parameter management. This integration eliminates external bookkeeping and enables analyses to be reproduced or transferred across datasets without loss of information or interpretability.
The integration of immune cell transcriptomes from blood and tonsil demonstrates the value of this design. Consistent preprocessing preserved the biological signal without introducing artificial batch effects. Consensus marker-based annotation recovered canonical immune populations, and similarity analysis confirmed agreement with reference annotations. Differences in HLA class I and class II expression across tissues reflected genuine biological contrasts, showing that standardized preprocessing reveals true variation rather than computational artifacts.
The biological plausibility of our findings further supports the robustness of the framework. In our use case, blood-derived cells exhibited inflammatory and stress-responsive transcriptional signatures, while tonsillar cells were enriched for antigen presentation and immune regulation (as shown previously).11 These patterns emerged from careful parameter control rather than overfitting. Subclustering was intentionally avoided because the available sequencing depth of approximately 25,000 reads per cell did not support confident resolution of minor subpopulations.26
Although advances in computational methodology continue to expand the analytical toolkit for single-cell transcriptomics, no post hoc algorithm can replace a well-designed experiment. In datasets with limited sequencing depth or insufficient replication, complex denoising, imputation, trajectory, or copy number inference methods risk emphasizing structure that does not exist. These approaches often operate where signal and noise are inseparable, obscuring the boundary between enhancement and artifact generation. Until upstream protocols achieve higher RNA integrity, lower ambient contamination, and greater depth per cell, conservative and transparent analyses are preferable to speculative modeling. ScToolkit therefore deliberately omits such post hoc inference modules, prioritizing reproducibility and interpretability. As computational methods mature, they must be benchmarked on biologically diverse, non-simulated datasets generated across independent laboratories. Only under such conditions can new modules be integrated modularly without compromising scientific rigor.
Reliable downstream analysis requires data of sufficient quality. Sequencing depth, saturation, mapping rates, and base-calling accuracy directly determine the confidence of downstream inference. Even large-scale atlas datasets such as the Tonsil Atlas reflect the field’s tendency toward insufficient sequencing depth, allowing lineage resolution but limiting subpopulation analysis. We recommend that studies report sequencing depth, saturation, phred quality, mitochondrial and ribosomal fractions, and other key quality metrics to ensure reproducibility and comparability across laboratories.
We urge the field to reconsider certain analytical conventions. For example, neighborhood graphs may be more robust when computed directly on log-transformed data rather than PCA-reduced dimensions. Raw (non-normalized) counts can be used for differential expression, while log or log-normalized data should be avoided for Wilcoxon ranking, as numerical instabilities can introduce artificial ranks. While our implementation adheres to current good practices for compatibility, we advise these conventions should be revised to better reflect the properties of scRNA-seq data.
ScToolkit extends rather than replaces existing infrastructure. It provides a coherent environment that combines computational performance with transparent parameterization and curated biological annotation. In summary, it strengthens reproducibility and interpretability as cornerstones of rigorous scientific practice.
The complete source code for scToolkit is freely available at. Documentation and usage instructions are provided.
- Source code available from: https://github.com/AG-Boerries/scToolkit
- Archived software available from: https://doi.org/10.5281/zenodo.17876855
- License: BSD 3-Clause “New” or “Revised” License
Human Tonsil Cell Atlas v2: https://zenodo.org/records/837375611
Tonsil v1 (h5ad): https://zenodo.org/records/14196253/files/tonsil.h5ad19
Blood v1.1 (h5ad): https://zenodo.org/records/14196253/files/blood.h5ad19
ChatGPT (OpenAI, version 5.1) was used solely as a language-editing assistant to improve readability, correct typographical errors, and refine grammar. It was not used to generate, interpret, or modify scientific content, analyses, results, or conclusions. All scientific writing, data interpretation, and methodological descriptions were produced entirely by the authors.
| Views | Downloads | |
|---|---|---|
| F1000Research | - | - |
|
PubMed Central
Data from PMC are received and updated monthly.
|
- | - |
Provide sufficient details of any financial or non-financial competing interests to enable users to assess whether your comments might lead a reasonable person to question your impartiality. Consider the following examples, but note that this is not an exhaustive list:
Sign up for content alerts and receive a weekly or monthly email with all newly published articles
Already registered? Sign in
The email address should be the one you originally registered with F1000.
You registered with F1000 via Google, so we cannot reset your password.
To sign in, please click here.
If you still need help with your Google account password, please click here.
You registered with F1000 via Facebook, so we cannot reset your password.
To sign in, please click here.
If you still need help with your Facebook account password, please click here.
If your email address is registered with us, we will email you instructions to reset your password.
If you think you should have received this email but it has not arrived, please check your spam filters and/or contact for further assistance.
Comments on this article Comments (0)