Keywords
DNA precipitation, Dielectric constant, Ethanol optimization, Beer–Lambert Law, Coulombic interactions, Spectrophotometry, Molecular Biology Methods, Protocol Standardization
This article is included in the Cell & Molecular Biology gateway.
DNA precipitation, Dielectric constant, Ethanol optimization, Beer–Lambert Law, Coulombic interactions, Spectrophotometry, Molecular Biology Methods, Protocol Standardization
DNA precipitation is fundamental to biological laboratory work. Standard protocols rely on empirically determined ethanol-to-DNA ratios3,4,10 and therefore overestimate requirements, typically prescribing 70% ethanol.3 This proportion is independent of DNA concentration, ionic strength, or solvent dielectric constant, but depends on solution volume. Because DNA precipitation is among the most commonly used protocols, reducing the ethanol concentration to the minimum required for optimal precipitation is crucial for lowering laboratory waste. In aqueous environments, the dielectric constant of water (ε = 80.1) stabilizes the negatively charged phosphate groups of DNA.5,11 Adding ethanol to the solution (ε = 24.5) lowers the solution’s dielectric constant,8 determined by a weighted average,7,9 collapses hydration shells,1 and thereby causes DNA to aggregate, as demonstrated in this study. In principle, precipitation occurs not at a fixed volumetric ratio but at a threshold dielectric constant, at which electrostatic repulsion is sufficiently weakened to permit optimal nucleation and aggregation of DNA molecules.
Previous models relied on approximations and trial-and-error proportions.3 These approximations overestimate the volume of ethanol required for precipitation. Empirical determination disregards the electrostatic interactions that drive DNA aggregation. This leads to excessive reagent use, increased laboratory waste, and reproducibility issues in protocols, resulting in variable DNA concentrations. A quantitative framework grounded in the first principles of physical chemistry can provide a mechanistic alternative for accurately predicting ethanol requirements.
To address this gap, this study establishes a quantitative model, derived from first principles, that predicts the minimum ethanol concentration required to achieve sufficient DNA precipitation without compromising yield. By spectrophotometrically quantifying DNA6 and calculating the dielectric constant of each solution across a 54% to 90% ethanol concentration gradient, precipitation rates were empirically determined. Four DNA concentrations were evaluated in triplicate (n = 12 per ethanol condition) to validate the model and to demonstrate that the standard 70% ethanol protocol exceeds the required level.
Applying this dielectric framework yields reproducible results, identifying the optimal dielectric constant and the factor driving DNA precipitation. The framework reduces reagent consumption while supporting environmentally conscious workflows. Replacing volumetric heuristics with a standardized ethanol percentage determined by this model will improve reproducibility, reduce flammable waste across laboratories, and move genomics toward methodologically consistent precipitation protocols suitable for high-throughput applications.
• 96-well plate × 3
• 1 mL or 1.5 mL microcentrifuge tubes, or 15 mL centrifuge tubes × 500
• Centrifuge
• Incubator
• Spectrophotometer
• Qiagen kit for initial DNA purification
• Double-stranded DNA of any accessible form (lyophilized pellets or flakes of DNA preferred), ~5 g
• Nuclease-free water
• Sodium acetate (NaOAc), ~500 g
• Glycogen (20 mg/mL stock), ~100 μL per stock
Two controls were used in this protocol to verify that DNA precipitation is a function of ethanol dielectric effects:
Negative control: A tube containing nuclease-free water, sodium acetate, and glycogen (without DNA) was carried through the complete precipitation protocol at each ethanol concentration, including the incubation, centrifugation, wash, and resuspension steps. This control confirms that any recovered pellet mass is attributable to DNA rather than to co-precipitation of buffer components.
Spectrophotometer blank: A solution of nuclease-free water, sodium acetate, and glycogen at base concentrations was used to zero the spectrophotometer prior to all A260 measurements and for all A260 baseline samples. Unlike the negative control, this solution was not subjected to centrifugation or ethanol treatment.
Part 1: Empirical determination of the precipitation threshold
• Extract DNA samples from cell cultures. Because the extracted samples are more concentrated than the target concentrations, they were diluted with nuclease-free water to reach the target concentrations.
• Prepare the water/DNA/sodium acetate samples as detailed in Table 1.
• Arrange 240 tubes in a test-tube rack, each filled with 100 μL of nuclease-free water (60 per DNA concentration).
• Dissolve the mass of DNA corresponding to the target values in Table 1 in 100 μL of water. Prepare 20 samples for each concentration in triplicate (three iterations). All solutions were prepared with the spectrophotometer’s sensitivity in mind. The stock provided was 33.2 ng/μL for a purified dissolved DNA sample.
• Mix all samples of each concentration with the volumes of ethanol listed in Table 2, spanning the empirically determined concentration of 70%.4
• Calculate the dielectric constant of each solution using the volume-weighted formula
where, at SATP, and 2 This yields the precipitation threshold.
• Incubate at −20°C for 60 minutes.
• Centrifuge at 16,000 g and 4°C for 30 minutes.
• Pipette off the liquid supernatant that remains above the solid precipitated DNA pellet.
• Run a Qubit assay to quantify the residual DNA in the supernatant, recording this value. The total DNA equals the spectrophotometer-measured quantity in the final sample plus the residual DNA in the supernatant.
• Prepare 1000 μL of 70% ethanol wash per tube to dissolve residual salts and contaminants without redissolving the DNA pellet.
• Pipette 1 mL of wash into each sample and invert the tube to rinse gently.
• Centrifuge at 16,000 g and 4°C for 30 minutes.
• Remove the ethanol wash, then air-dry the pellet for 2–5 minutes in a tube with the cap loosely ajar to allow airflow, until the pellet loses its sheen. Once the shine has worn off, the pellet is ready for resuspension.
• Add 100 μL of nuclease-free water to each precipitated sample to dissolve the purified DNA pellet for use in the spectrophotometer.
• Prepare a nuclease-free water blank for the spectrophotometer.
• Measure A260 absorbance values to determine the DNA concentration.
• Use the initial and final DNA concentrations to determine the percentage of DNA precipitated. A value above 90% is considered successfully preserved. If no sample meets this criterion, a flaw is assumed to have occurred during the experiment.
Part 2: Validation of the model
• Prepare samples as in Part 1 (without ethanol), with the DNA mass in each sample as listed in Table 1.
• Measure the A260 value of each sample, blanking for water, glycogen, and sodium acetate.
• Using , the DNA mass, and the A260 absorbance value, determine, using the model alone, the volume of ethanol required for precipitation.
• Add ethanol at the volumes listed in Table 2.
• Incubate at −20°C for 45–60 minutes (flexible; samples are generally stable for days).
• Centrifuge at 16,000 g and 4°C for 30 minutes.
• Assess the precipitated DNA in each sample to determine which ethanol percentage and volume met the previously determined precipitation threshold. If a band of values is observed, precipitation may be gradual; the lowest value of the band is used for this assessment.
• Evaluate the validity of the predictions and thereby determine whether the model is valid (threshold values should match the model within an error margin of 2% of the threshold value).
This derivation applies the Beer–Lambert law to convert spectrophotometric absorbance ( ) into the concentration of double-stranded DNA. The resulting concentration serves as the input for subsequent electrostatic and dielectric modelling of ethanol-mediated precipitation.
Beer–Lambert substitution. As per the Beer–Lambert law,12
Volumetric conversion. Let the solute mass be
Coulomb’s law. The volume of the DNA solution is now defined as a function of absorbance and mass. The model can be extended to the electrostatic interactions that govern ethanol-mediated DNA precipitation. The dielectric constant, as characterized by Coulomb’s law,5 quantifies the effect of the solvent on the strength of interactions between ions:
Precipitation onset. The threshold dielectric constant of a water–ethanol mixture before precipitation can be estimated through an approximation based on the volume fractions of ethanol and water. Based on the experimental data, this occurs when ethanol constitutes more than 64% of the solution volume. Forming a weighted average,
This weighting rule is only a rough approximation and is intended as a general guideline. In practice, the dielectric constant ranges between 30 and 40. For simplicity, this value is not carried as a variable in the subsequent equations and is instead treated as a constant, .
Volumetric calculation. The dielectric constant is directly correlated with the solubility of ionic compounds: a lower dielectric constant means weaker interference with electrostatic forces, allowing ions to attract one another and precipitate. The dielectric constant is related to the volumes of ethanol and water through their weighted average:
Using the expression for from Equation (5),
Result and limitations. Equation (14) therefore gives the volume of ethanol required to precipitate DNA from an aqueous solution as a function of the dsDNA mass and the solution absorbance. The principal limitations of this derivation are that it applies only to dsDNA, and that is treated as a constant, as described above. The remaining methodology follows a two-part approach: first, determining the dielectric constant, and second, validating the theoretical model for ethanol-based DNA precipitation.
DNA precipitation was quantified across the ethanol concentration gradient to characterize sample purity, recovery efficiency, and mass-balance behaviour. DNA recovery was measured using Qubit fluorescence assays across replicate samples at each concentration. Sample purity was assessed using the A260/A280 ratio. Residual DNA was quantified to evaluate mass balance across conditions. The results below characterize ethanol-dependent changes in precipitation yield, purity across concentrations, replicate variability, and system-level mass-balance trends.
DNA precipitation yield increases sharply with ethanol concentration up to a defined threshold, beyond which recovery plateaus ( Figure 1). Across all initial DNA concentrations, minimal recovery is observed below 58% ethanol, followed by a steep increase in yield between 58% and 65%. Beyond this transitional region, recovery exceeds 90% and remains stable as ethanol concentration increases. Sigmoidal curve fitting shows this behaviour consistently across all DNA concentrations and replicates, with a high goodness of fit (R2 = 0.999).
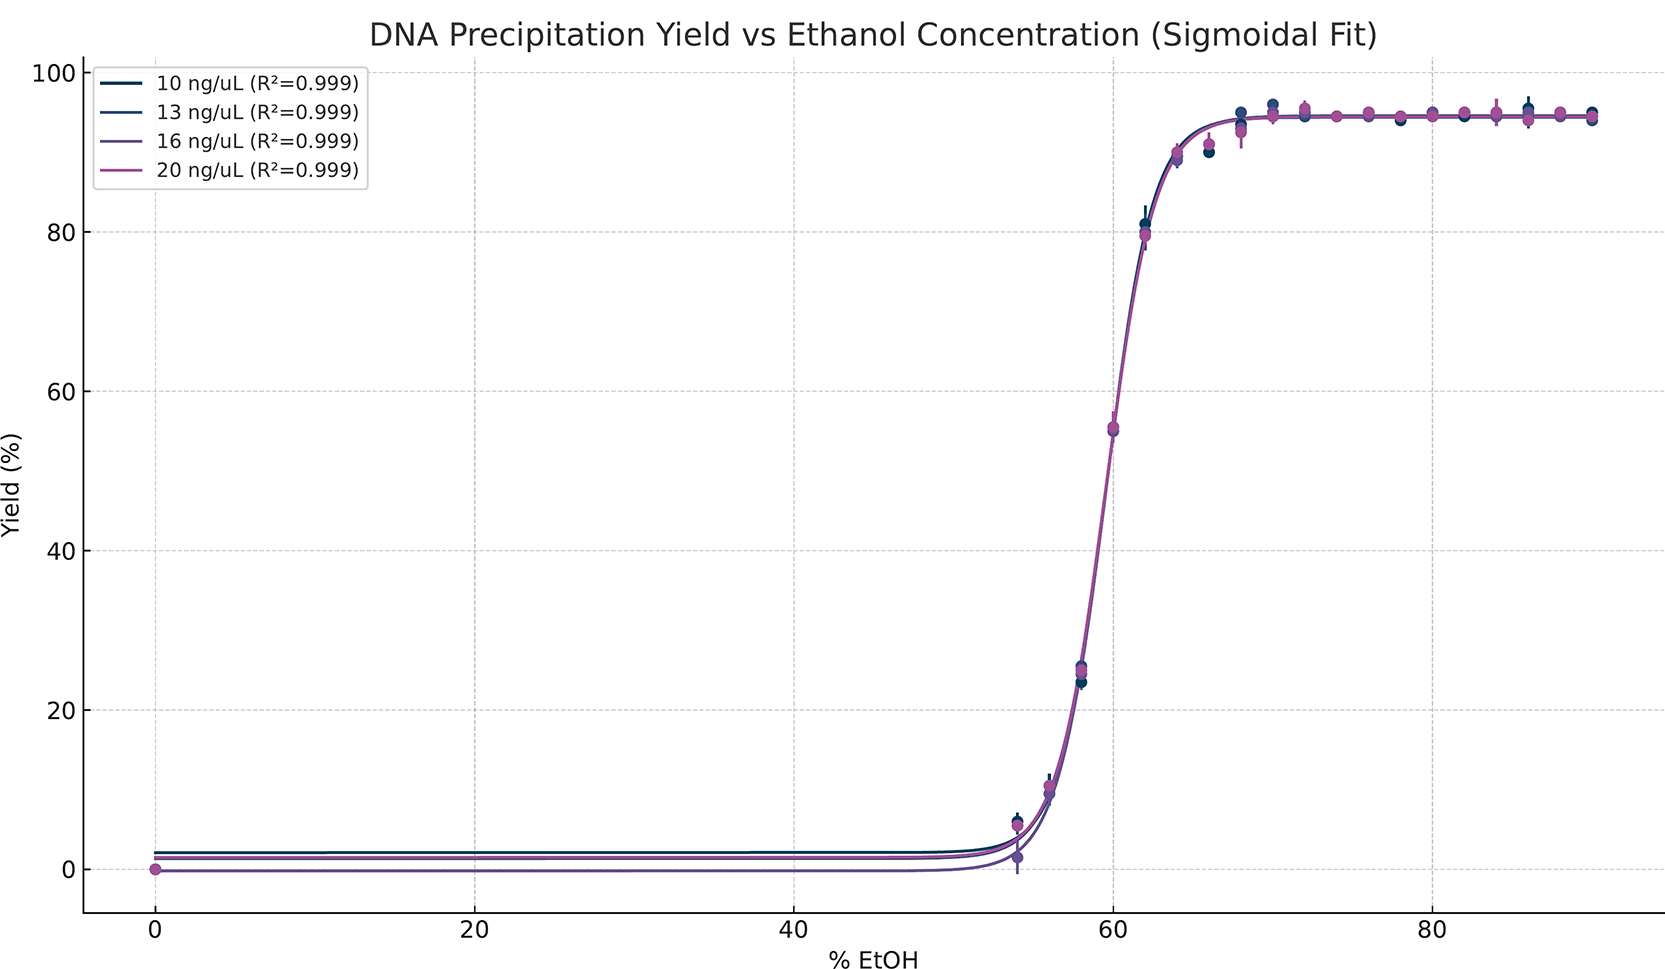
Yield (%) is shown across the ethanol gradient for four DNA input concentrations (10, 13, 16, and 20 ng/μL). Points represent mean recovery across replicates, and solid lines show sigmoidal (four-parameter logistic) fits, with a high goodness of fit (R2 = 0.999) for all four concentrations.
Mass-balance analysis shows that the distribution of DNA between the supernatant and pellet fractions varies with ethanol concentration, whereas the total DNA mass remains constant relative to the initial input across all conditions tested ( Figure 2). At low ethanol concentrations, most DNA was retained in the supernatant, with minimal recovery in the pellet fraction. As ethanol concentration increases through the precipitation transition region, pellet-associated DNA increases sharply, accompanied by a corresponding decrease in supernatant DNA. Above the precipitation threshold, DNA mass was predominantly recovered in the pellet fraction, while residual DNA in the supernatant stabilized at low levels. This pattern was observed consistently across all DNA input concentrations (10, 13, 16, and 20 ng/μL), with the combined mass of pellet and supernatant DNA closely approximating the initial DNA mass across the ethanol gradient.
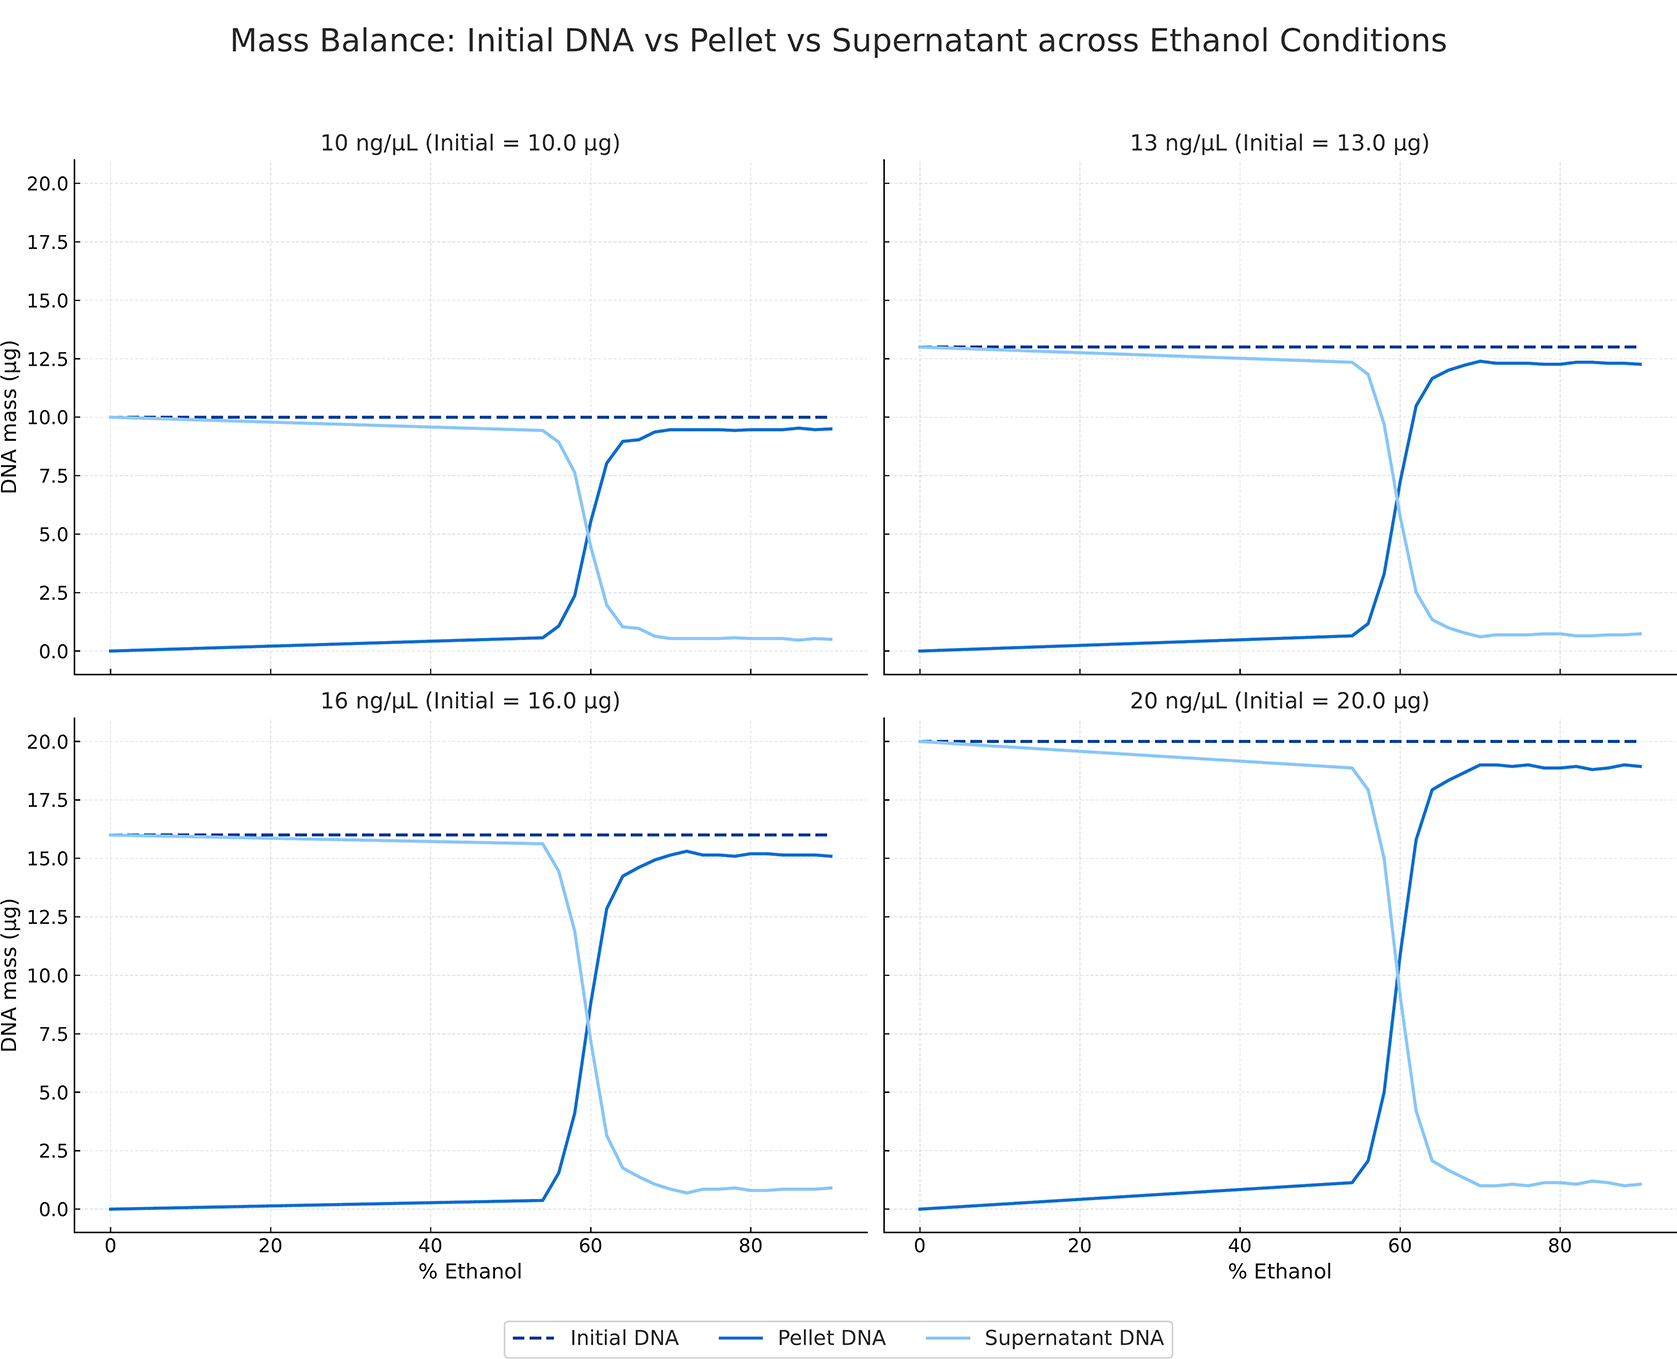
Dashed lines indicate the initial DNA mass; solid lines represent DNA recovered in the pellet and DNA remaining in the supernatant across ethanol conditions.
DNA purity remained consistent across the ethanol concentration range. A260/A280 ratios clustered near 1.8 for all DNA input concentrations tested ( Figure 3). No systematic shifts in purity were observed below or above the precipitation threshold. Mean ratios remained within a narrow range, indicating minimal protein contamination. Replicate measurements exhibited low variability at each ethanol concentration, with overlapping error bars across concentrations, indicating that changes in ethanol concentration do not affect spectrophotometric purity. This stability was consistent across all DNA input concentrations.
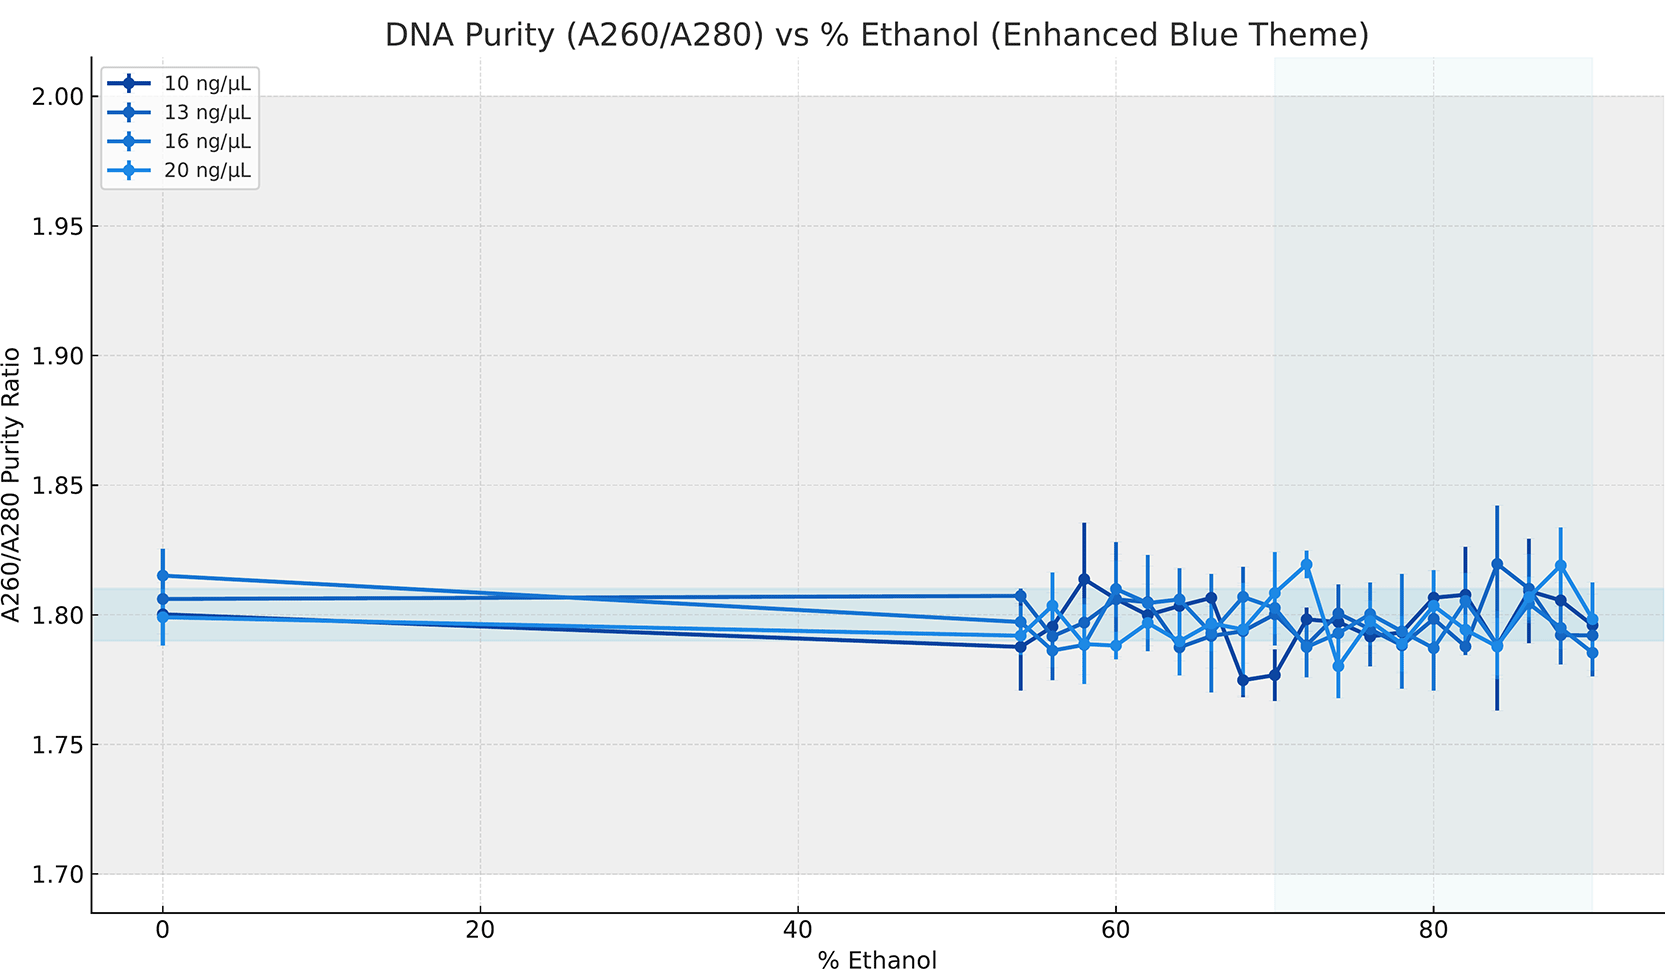
Points represent mean values across replicates, and error bars indicate the standard deviation.
These results establish an ethanol-dependent transition in DNA precipitation behaviour that is consistently observed across measurement modalities, input concentrations, and replicates. DNA recovery exhibits a sharp, nonlinear rise over a narrow concentration range, followed by a stable plateau beyond 65% EtOH ( Figure 1). This behaviour is reproducible across all replicates and DNA concentration conditions, indicating that the onset is governed by a physicochemical factor rather than by sample-specific concentration effects, as previously observed empirically. There was no negative impact on spectrophotometric purity, demonstrating that the increased yield is not achieved at the expense of DNA quality or contamination. Mass-balance analysis further indicates that ethanol-induced precipitation reflects a redistribution of DNA between the solution and pellet phases rather than any loss or degradation ( Figure 2); the total recovered DNA remains consistent with the initial inputs across replicates and conditions. These observations demonstrate that ethanol-mediated DNA precipitation is characterized by a threshold-driven regime change that selectively alters DNA solubility while preserving molecular integrity.
This threshold-like behaviour is consistent with the dielectric-threshold model. In aqueous environments, the high dielectric constant of water stabilizes the negatively charged phosphate groups of DNA, maintaining solubility through electrostatic screening. The presence of ethanol lowers the effective dielectric constant, reducing charge screening and strengthening the Coulombic interactions between DNA molecules. Below the critical dielectric threshold, electrostatic repulsion remains sufficient to prevent aggregation. Once this threshold is crossed, the balance between solvation and intermolecular attraction shifts abruptly, permitting rapid nucleation and aggregation of DNA into an insoluble phase. Such transitions are expected to be nonlinear, because electrostatic forces scale inversely with the dielectric constant rather than changing proportionally with solvent composition. The sigmoidal precipitation profiles observed across all DNA inputs are therefore consistent with a dielectric-mediated collapse of solvation rather than a gradual volumetric effect of ethanol addition.
The stability of DNA purity across the gradient constrains the interpretation of the precipitation mechanism. A260/A280 ratios remained tightly clustered across all conditions ( Figure 3), indicating that changes in recovery efficiency are not accompanied by increased protein concentration or nonspecific aggregation. This argues against explanations based on ethanol-induced co-precipitation of impurities or concentration-dependent measurement artifacts. If increased yield were driven by the nonspecific collapse of macromolecules, the purity metrics would vary across the gradient. On the contrary, the observed constancy of purity suggests that ethanol alters DNA solubility without disrupting integrity or introducing detectable contaminants. These results support the interpretation that precipitation reflects a controlled physical transition rather than a degradation or concentration artifact.
The identification of a quantitative dielectric threshold further strengthens this interpretation. A recovery criterion of more than 90% defines reliable precipitation. The threshold for DNA precipitation was consistently observed at 66% ethanol across all DNA inputs and replicates, corresponding to an effective dielectric constant of 43.4. This threshold was independent of the initial DNA concentration, despite differences in absolute DNA mass, indicating that precipitation onset is governed by the solvent dielectric properties rather than by concentration-dependent crowding effects. Framing precipitation in terms of a dielectric threshold provides a physically meaningful parameter that captures the transition from soluble to insoluble DNA states, offering a more precise descriptor than empirical ethanol volume ratios. The sharpness and reproducibility of this threshold support the interpretation of precipitation as a regime change rather than a gradual accumulation process.
These findings have implications for the development of future DNA protocols. Conventional protocols prescribe fixed ethanol volumes relative to sample volume, assuming a linear relationship between ethanol addition and precipitation efficiency. The results demonstrate that achieving a critical dielectric environment governs precipitation, and that beyond this point additional ethanol confers diminishing returns. Adopting a dielectric-threshold framework enables prediction and optimization of precipitation conditions based on solvent composition rather than heuristic ratios, reducing unnecessary reagent use and improving reproducibility across laboratories. This approach is especially relevant for high-throughput and automated workflows, where small deviations in solvent composition can lead to inconsistent recovery. By replacing empirical rules with a physicochemical criterion, DNA precipitation can be treated as a controlled, model-driven process rather than an experimentally inherited convention.
Several limitations should be considered when generalizing these results. The present study focuses on double-stranded DNA under defined buffer and ionic conditions, and the precise dielectric threshold identified here may shift with changes in salt concentration, counterion identity, temperature, or nucleic acid topology. DNA length, conformation, and sequence composition may also influence precipitation dynamics by altering charge distribution and hydration behaviour. Additionally, the effective dielectric constant of mixed solvents was approximated using a volume-weighted model, which captures first-order effects but may not fully account for local solvent structuring. Future work could extend this framework to other nucleic acids, systematically map threshold shifts under varying buffer conditions, and incorporate more refined dielectric models. Nonetheless, the consistency of the observed threshold across inputs and replicates suggests that dielectric collapse represents a central organizing principle of ethanol-mediated DNA precipitation, providing a robust foundation for both mechanistic understanding and practical application.
This research did not involve human participants, the recruitment or enrolment of individuals, identifiable personal data, clinical interventions, or observational cohorts. All procedures were performed using purified, non-living double-stranded DNA and standard laboratory reagents; the DNA was not obtained from identifiable human participants and was not linked to any individual. Because no human participants, identifiable data, or living organisms were involved, formal ethical approval and informed consent were not required for this study, and an institutional review board (IRB) determination was not applicable. All experimental activities adhered to the institutional laboratory safety guidelines of Princess Margaret Cancer Centre/University Health Network.
| Views | Downloads | |
|---|---|---|
| F1000Research | - | - |
|
PubMed Central
Data from PMC are received and updated monthly.
|
- | - |
Provide sufficient details of any financial or non-financial competing interests to enable users to assess whether your comments might lead a reasonable person to question your impartiality. Consider the following examples, but note that this is not an exhaustive list:
Sign up for content alerts and receive a weekly or monthly email with all newly published articles
Already registered? Sign in
The email address should be the one you originally registered with F1000.
You registered with F1000 via Google, so we cannot reset your password.
To sign in, please click here.
If you still need help with your Google account password, please click here.
You registered with F1000 via Facebook, so we cannot reset your password.
To sign in, please click here.
If you still need help with your Facebook account password, please click here.
If your email address is registered with us, we will email you instructions to reset your password.
If you think you should have received this email but it has not arrived, please check your spam filters and/or contact for further assistance.
Comments on this article Comments (0)