Introduction
Position-based annotation is one of the cornerstones of bioinformatics. A great number of databases, analysis and prediction methods are geared towards providing data that are mapped to specific sequence coordinates. Particularly in the case of proteins, the Pfam1 database identifies, marks-up, and characterizes different functional regions within a given protein. The coordinates of these domains are often given in terms of the start and end position within the protein. The largest pool of reviewed and automatically annotated proteins provided by the UniProt Consortium2 also contains position-based annotations for structural regions, modified residues, and functional sites among others. Finally, methods such as those integrated into PredictProtein3 provide positionbased feature annotations such as secondary structure states, buried and exposed residues, coiled-coil stretches, and disordered regions. PredictProtein also maps functional regions such as protein-protein binding sites and protein-DNA binding sites onto positions within the sequence.
BioJS4 is an open source JavaScript library of components for visualization of biological data on the web. Here, we present FeatureViewer and its current extensions: SimpleFeatureViewer that simplifies the input data format, and DasProteinFeatureViewer that retrieves the input data from a web service. The FeatureViewer is a standard, portable BioJS component designed to easily render position-based annotations, a.k.a. features. The FeatureViewer component can be easily integrated into and controlled from other applications. To our knowledge, this is the first client-side modular component to visualize position-based annotations that can be integrated into other web applications in a standard manner.
The FeatureViewer component
The FeatureViewer component extensively uses the Raphaël javascript library5 that renders Scalable Vector Graphics (SVG) objects in modern web browsers. The use of SVG allows the graphics to scale to any requested resolution and is portable across different computing platforms and viewing software.
The FeatureViewer component can be easily integrated into any web application by including its dependencies in the head section, e.g., jQuery6 and Raphaël, and then instantiating the component within a JavaScript section. A special dependency for some images is required as they are used for the pop-up dialogue controls. The code below shows how to instantiate the component; the corresponding visualization is shown in Figure 1. A complete example and more information can be found at http://www.ebi.ac.uk/Tools/biojs/registry/Biojs.FeatureViewer.html. The FeatureViewer component has been tested with modern browsers such as Mozilla, Chrome, and Internet Explorer (IE); however, the image export option is not available in IE.

Figure 1.
Visualization of a peptide using the FeatureViewer component.
var json = {
  featuresArray:[{
   // configuration for each style
   nonOverlappingStyle:{heightOrRadius:10, y:56}
   ,centeredStyle:{heightOrRadius:40, y:75}
   ,rowsStyle:{heightOrRadius:10, y:157}
   // feature information
   ,featureLabel:’Elicitor peptide 3’
   ,evidenceText:’UniProt’
   ,typeCode:’SO:0001064’
   ,typeCategory:’Molecule processing’
   ,featureId:’UNIPROTKB_Q8LAX3_PEPTIDE_74_96’
   ,featureTypeLabel:’active_peptide’
   // Display information
   ,type:’rect’, fillOpacity:0.5, stroke:’#7DBAA4’
   ,height:10, r:10, y:56, x:529, cy:56, cx:529
   ,strokeWidth:1, fill:’#7DBAA4’, width:151
  }]
  ,segment:Q8LAx3
  ,legend:{/*omi t ted ...*/}
  ,configuration:{
   // centered style
   sizeYCentered:160, sequenceLineYCentered:95,
   ,verticalGridLineL eng thCentered:172
   ,horizontalGridNumLinesCentered:6
   // similar non–overlaping & rows (omitted)
   ,style:’nonOverlapping’, nonOverlapping:true
   // ruler
   ,requestedStart:1, requestedStop:96
   ,rulerY:20, rulerLength:660, belowRuler:30
   ,pixelsDivision:50, aboveRuler:10
   // others
   ,sizeY:76, sizeX:700, rightMargin:20
   ,leftMargin:20, sequenceLineY:54
   ,sequenceLength:96, unitsize:6.875
   ,sizeYKey:210, verticalGridLine Length:66
   ,horizontalGridNumLines:2, gridLineHeight:12
   ,verticalGrid:false, horizontalGrid:false
   ,verticalGridLineLengthRows:284
   ,horizontalGridNumLinesRows:8
   ,dasSources:’http://www.ebi.ac.uk/das
   –srv/uniprot/das/uniprot’
   ,dasReference:’http://www.ebi.ac.uk/das
   –srv/uniprot/das/uniprot’
   }
};
var myPainter = new Biojs.FeatureViewer ({
  target:”YourOwnDivId”,
  json:json
});
Options and data
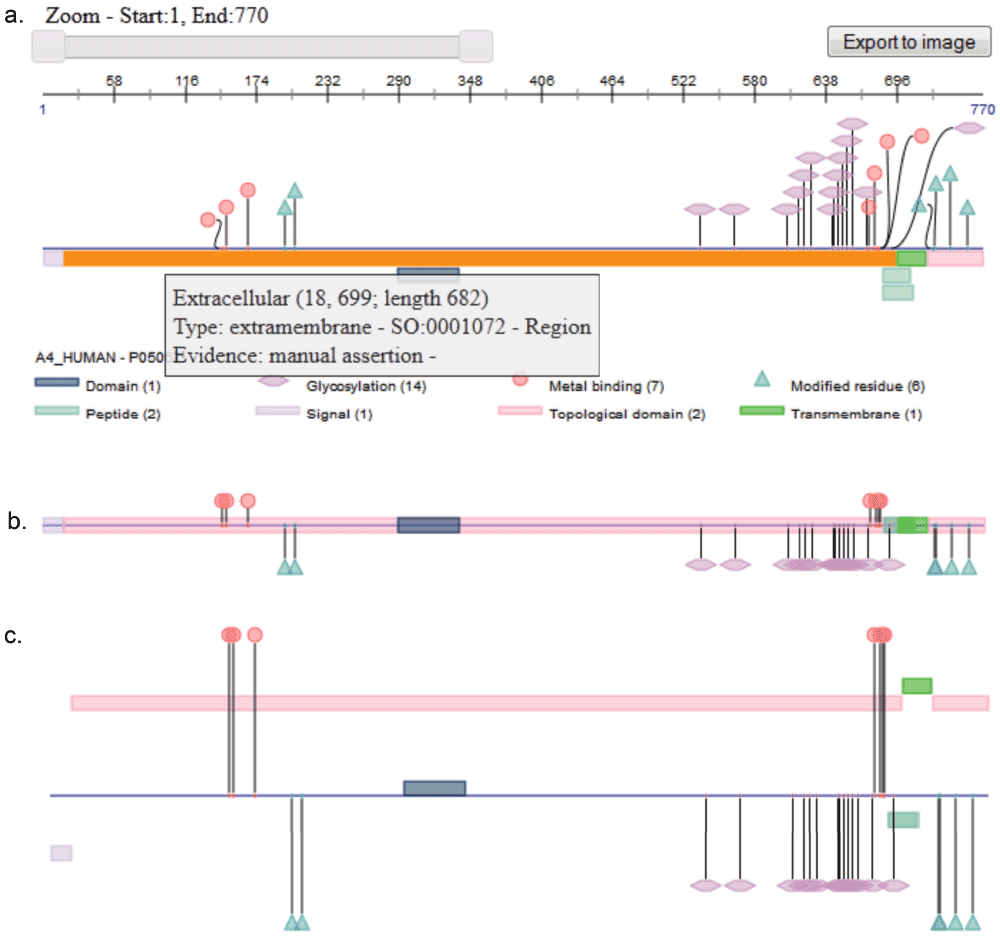
In order to instantiate the FeatureViewer component, some options should be defined. The mandatory options correspond to (i) a place holder named target, i.e., a DIV element in the web page where the annotations will be rendered, and (ii) a JSON object, named json, with the configuration, the protein identifier, the annotations, and the legend. FeatureViewer is a dummy component in the sense that it does not make any calculations about where to render the annotations, not even when the rendering style is changed; all the rendering information is provided in the json option. A comprehensive list of the elements in the json option is available at http://www.ebi.ac.uk/Tools/biojs/registry/Biojs.FeatureViewer.html. The FeatureViewer component includes three different layouts to display the features: all features centered, features grouped by type, and features organized in non-overlapping tracks, as shown in Figure 2.

Figure 2.
a. This visualization corresponds to the UniProt protein "Amyloid beta A4 protein" in the nonoverlapping style; interactions such as shape dragging, tooltip, and selection as well as user controls such as zooming and image exporting are illustrated in this figure; b. shows the centralized view, while c. shows the by-rows view.
User controls
Additional options can also be specified in order to customize the user controls as well as interaction with the features. User controls include the zooming slider and the export-to-image button, as shown in the Figure 2a. The zooming slider allows users to hone in on a region of interest and view it in greater detail, making it possible to move from an overview aspect into a detailed one without navigating to a different page. The export-to-image button allows users to export the rendered features into an image that can embedded into a paper or presentation.
Different kinds of interaction are also possible. Events bound to rendered annotations include a mouse-over action that highlights and colors the "focused" feature. Click action is also supported. Clicking on a feature selects it so it will remain highlighted until another feature is selected; clicking an already selected feature will deselect it. Tooltips tied to each shape pop up and reveal additional information about the rendered annotations. Either shapes or lines can be used to display features covering one single amino acid; currently metal bindings can be rendered as circles, active sites as diamonds, lipidation as waves, glycosylation as hexagons, and post translational modifications as triangles. When shapes are used, it is possible to drag them making it easier to distinguish one from another when they are clustered.
Extensions
As FeatureViewer requires highly detailed information in order to display the features, a simpler version, the SimpleFeatureViewer component, builds on top of it. This simplified version takes care of calculating the configuration options as well as the localization of the features; thus, developers using this version can focus on the actual data rather than on intricate details regarding styles, pixels, and coordinates. However, only the non-overlapping tracks style is supported by this component. The main advantage of this component is that its data structure is much simpler than the one required for FeatureViewer, as observed in the following code excerpt.
var myFT = [
  {
   featureId:’UNIPROTKB_Q8LAX3_PEPTIDE_54_96’,
   featureStart:54, featureEnd:96,
   typeLabel:’Peptide’, typeCode:’SO:0001064’,
   feature Label:’Elicitor peptide 3’,
   typeCategory:’Moleculeprocessing’,
   evidenceText:’UniProt’, evidenceCode:’ ’,
   color:’blue’
  },
  {
   featureId:’UNIPROTKB_Q8LAX3_PEPTIDE_74_96’,
   featureStart:74, featureEnd:96,
   typeLabel:’Active Site’, , typeCode:’SO:0001064’
   featureLabel:’Elicitor peptide 3’,
   typeCategory:’Molecule processing’,
   evidenceText:’UniProt’, evidenceCode:’ ’,
   type:’diamond’
  },
  {
   featureId:’UNIPROTKB_Q8LAX3_DISULFID_75_96’,
   featureStart:75, featureEnd:96,
   typeLabel:’Active Site’, , typeCode:’SO:0001064’
   featureLabel:’Elicitor peptide 3’,
   typeCategory:’Molecule processing’,
   evidenceText:’UniProt’, evidenceCode:’ ’,
   color:’#33FF66’,
   type:’bridge’
   }];
var myPainter =
   new Biojs.SimpleFeatureViewer ({
   target:’YourOwnDivId’,
   sequenceId:’a4_human’,
   sequenceLength:770,
   features:myFT
});
This component requires a place holder, a sequence identifier, a sequence length, and a features array; the width in pixels to be used to rendered the protein features can also be defined by using the option imageWidth. The features array contains information for each feature to be displayed including, for instance, identifier, start and end positions in the sequence, label, and color among others. More information is available at http://www.ebi.ac.uk/Tools/biojs/registry/Biojs.SimpleFeatureViewer.html.
A second extension, the DasProteinFeatureViewer, makes use of a web service that retrieves data from Distributed Annotation System (DAS) sources. DAS defines a communication protocol used to exchange annotations on gene or protein sequences7. Multiple protein databases provide their data following the DAS principles, for instance UniProt and InterPro8. For this extension, no information about the features themselves is required as such details will be retrieved from the web service, as shown in the code below.
var myPainter =
  new Biojs.DasProteinfeatureViewer({
   target: ”YourOwnDivId”,
   segment: ”a4_human”
});
Additional options allow developers to specify the protein identifier, the DAS sources, the feature types – e.g., domain, chain, variant, etc., the rendering style, the image width, and some others. In order to avoid cross-domain problems, a proxy can also be specified. The feature types used by this component are those defined by UniProt, which is also used as the reference DAS source, i.e., the one providing the protein sequence. More information available at http://www.ebi.ac.uk/Tools/biojs/registry/Biojs.DasProteinFeatureViewer.html.
Use case
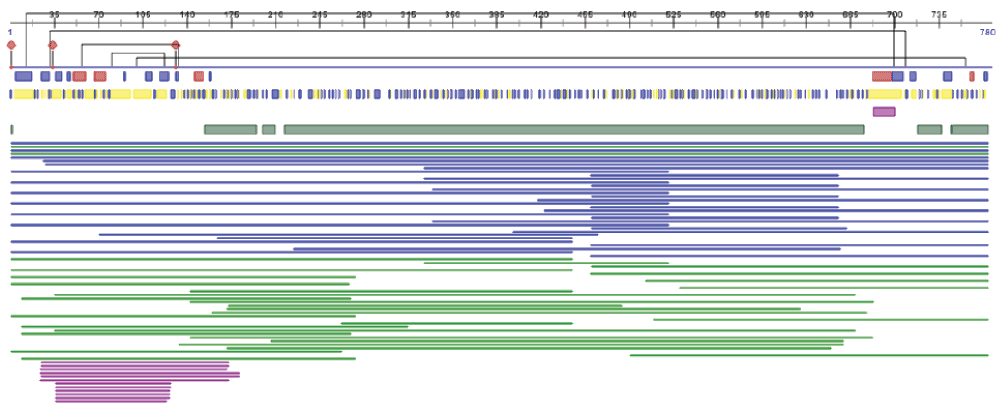
The PredictProtein service3 integrates multiple algorithms that either retrieve from curated databases or automatically predict aspects of protein structure and function. Many of the predictions provided by the methods are mapped to positions within the protein. In order to easily highlight patterns, compare predictions, and cross-validate results, the PredictProtein interface lays out the predicted annotations in data tracks, i.e., in separate rows, each row presenting different predicted features. Data tracks are laid one under the other and enable the quick overview of some of the prominent features of the protein e.g., a cluster of binding sites close to the N-terminal or the count of trans-membrane regions. Figure 3 shows the implementation of the FeatureViewer component used for the PredictProtein service.

Figure 3.
FeatureViewer is used by the PredictProtein service to show a stack of predicted structure and function features.
Conclusions
The FeatureViewer component and its extensions, SimpleFeatureViewer and DasProteinFeatureViewer, provide a platform to visualize position-based biological data easily and efficiently. FeatureViewer, like any other BioJS component, can be easily integrated with other web components or extended to have greater functionality than the one shown here. We expect this component to be particularly useful to developers and users alike, requiring little technical knowledge for its full functioning.
Author contributions
LG is the original author and current lead developer of the FeatureViewer, SimpleFeatureViewer, and DasProteinFeatureViewer components. GY extended FeatureViewer in order to support bridges, and provided the use case presented in this manuscript. MM conceived the original concept and contributed to the design of FeatureViewer. All authors have revised and agreed to the content in this manuscript.
Competing interests
No competing interests were disclosed.
Grant information
GY was supported by the Alexander von Humboldt Foundation. UniProt EMBL-EBI is funded by National Institutes of Health (NIH) [1U41HG006104-03].
Acknowledgements
GY thanks Burkhard Rost who helped fund this work and contributed ideas and feedback. GY also acknowledges Edda Kloppman and Tatyana Goldberg for helpful discussions and invaluable feedback and insight.
LG thanks Pablo Moreno who spotted a bug related to multiple instantiation and contributed to fixing it, as well as Mark Bingley, Claire O’Donovan, Sangya Pundir, and Xavier Watkins in the UniProt EMBL-EBI team and Rafael Jiménez and John Gómez in the IntAct EMBL-EBI team for their comments and suggestions about the FeatureViewer component and its extensions.
The authors thank all those who funded our research as well as researchers who deposited data into publicly available datasets and programmers who provided their work under a free license: our work stands upon their shoulders and would not have been possible without them.
Faculty Opinions recommendedReferences
- 1.
Punta M, Coggill PC, Eberhardt RY, et al.:
The Pfam protein families database.
Nucleic Acids Res.
2012; 40(Database issue): D290–301. PubMed Abstract
| Publisher Full Text
| Free Full Text
- 2.
UniProt Consortium.Update on activities at the universal Protein Resource (uniprot) in 2013.
Nucleic Acids Res.
2013; 41(Database issue): D43–7. PubMed Abstract
| Publisher Full Text
| Free Full Text
- 3.
Rost B, Yachdav G, Liu J:
The PredictProtein server.
Nucleic Acids Res.
2004; 32(Web Server issue): W321–6. PubMed Abstract
| Publisher Full Text
| Free Full Text
- 4.
Gómez J, García LJ, Salazar GA, et al.:
BioJs: an open source Javascript framework for biological data visualization.
Bioinformatics.
2013; 29(8): 1103–4. PubMed Abstract
| Publisher Full Text
| Free Full Text
- 5.
Raphaël—javascript library. 2013. Reference Source
- 6.
jquery—javascript library. 2014. Reference Source
- 7.
Jenkinson AM, Albrecht M, Birney E, et al.:
Integrating biological data--the Distributed Annotation System.
BMC Bioinformatics.
2008; 9(Suppl 8): S3. PubMed Abstract
| Publisher Full Text
| Free Full Text
- 8.
Hunter S, Jones P, Mitchell A, et al.:
InterPro in 2011: new developments in the family and domain prediction database.
Nucleic Acids Res.
2012; 40(Database issue): D306–D312. PubMed Abstract
| Publisher Full Text
| Free Full Text
- 9.
Leyla G, Yachdav G, Moreno P:
BioJS Feature Viewer.
Zenodo.
2014. Reference Source


Comments on this article Comments (0)