Introduction
DNA variant analysis of complete genome or exome data has typically relied on filtering of alleles according to population frequency and alterations in coding of amino acids. Numerous variants of unknown significance (VUS) in both coding and non-coding gene regions cannot be categorized with these approaches. To address these limitations, in silico methods that predict biological impact of individual sequence variants on protein coding and gene expression have been developed, which exhibit varying degrees of sensitivity and specificity1. These approaches have generally not been capable of objective, efficient variant analysis on a genome-scale.
Splicing variants, in particular, are known to be a significant cause of human disease2–5 and indeed have even been hypothesized to be the most frequent cause of hereditary disease6. Computational identification of mRNA splicing mutations within DNA sequencing (DNA-Seq) data has been implemented to varying degrees of sensitivity, with most software only evaluating conservation solely at the intronic dinucleotides adjacent to the junction (i.e.7). Other approaches are capable of detecting significant mutations at other positions with constitutive, and in certain instances, cryptic, splice sites5,8,9 which can result in aberrations in mRNA splicing. Presently, only information theory-based mRNA splicing mutation analysis has been implemented on a genome scale10. Splicing mutations can abrogate recognition of natural, constitutive splice sites (inactivating mutation), weaken their binding affinity (leaky mutation), or alter splicing regulatory protein binding sites that participate in exon definition. The abnormal molecular phenotypes of these mutations comprise: (a) complete exon skipping, (b) reduced efficiency of splicing, (c) failure to remove introns (also termed intron retention or intron inclusion), or (d) cryptic splice site activation, which may define abnormal exon boundaries in transcripts using non-constitutive, proximate sequences, extending or truncating the exon. Some mutations may result in combinations of these molecular phenotypes. Nevertheless, novel or strengthened cryptic sites can be activated independently of any direct effect on the corresponding natural splice site. The prevalence of these splicing events has been determined by ourselves and others5,11–13. The diversity of possible molecular phenotypes makes such aberrant splicing challenging to corroborate at the scale required for complete genome (or exome) analyses. This has motivated the development of statistically robust algorithms and software to comprehensively validate the predicted outcomes of splicing mutation analysis.
Putative splicing variants require empirical confirmation based on expression studies from appropriate tissues carrying the mutation, compared with control samples lacking the mutation. In mutations identified from complete genome or exome sequences, corresponding transcriptome analysis based on RNA sequencing (RNA-Seq) is performed to corroborate variants predicted to alter splicing. Manually inspecting a large set of splicing variants of interest with reference to the experimental samples’ RNA-Seq data in a program like the Integrative Genomics Viewer (IGV)14, or simply performing database searches to find existing evidence would be time-consuming for large-scale analyses. Checking control samples would be required to ensure that the variant is not a result of alternative splicing, but is actually causally linked to the variant of interest. Manual inspection of the number of control samples required for statistical power to verify that each displays normal splicing would be laborious and does not easily lend itself to statistical analyses. This may lead to either missing contradictory evidence or to discarding a variant due to the perceived observation of statistically insignificant altered splicing within control samples. In addition, a list of putative splicing variants returned by variant prediction software can often be extremely large. The validation of such a significant quantity of variants may not be feasible, for example, in certain types of cancer, in instances where the genomic mutational load is high and only manual annotation is performed. We have therefore developed Veridical, a software program that automatically searches all given experimental and control RNA-Seq data to validate DNA-derived splicing variants. When adequate expression data are available at the locus carrying the mutation, this approach reveals a comprehensive set of genes exhibiting mRNA splicing defects in complete genomes and exomes. Veridical and its associated software programs are available at: www.veridical.org.
Methods
The program Veridical was developed to allow high-throughput validation of predicted splicing mutations using RNA sequencing data. Veridical requires at least three files to operate: a DNA variant file containing putative mRNA splicing mutations, a file listing of corresponding transcriptome (RNA-Seq) BAM files, and a file annotating exome structure. A separate file listing RNA-Seq BAM files for control samples (i.e. normal tissue) can also be provided. Here, we predict mutations in a set of breast tumours which are validated with RNA-Seq data from the same individuals, with RNA-Seq data from normal breast tissues as controls. However, in principle, potential splicing mutations for any disease state with available RNASeq data can be investigated. In each tumour, every variant is analyzed by checking the informative sequencing reads from the corresponding RNA-Seq experiment for non-constitutive splice isoforms, and comparing these results with the same type of data from all other tumour and normal samples that do not carry the variant in their exomes.
Veridical concomitantly evaluates control samples, providing for an unbiased assessment of splicing variants of potentially diverse phenotypic consequences. Note that control samples include all non-variant containing files, as well any normal samples provided. Maximizing the set of control samples, while computationally more expensive, increases the statistical robustness of the results obtained.
For each variant, Veridical directly analyzes sequence reads aligned to the exons and introns that are predicted to be affected by the genomic variant. We elected to avoid indirect measures of exon skipping, such as loss of heterozygosity in the transcript, because of the possibility of confusion with other molecular etiologies (i.e. deletion or gene conversion), unrelated to the splicing mutations. The nearest natural site is found using the exome annotation file provided, based upon the directionality of the variant, as defined within Table 1. The genomic coordinates of the neighboring exon boundaries are then found and the program proceeds, iterating over all known transcript variants for the given gene. A diagram of this procedure is provided in Figure 1. The variant location, C, is specifically referring to the, variant-induced, location of the predicted mRNA splice site, which is often proximate to, but distinct from the coordinate of the actual genomic mutation itself.
Table 1. Definitions used within Veridical to determine the direction in which reads are checked. A and B represent natural site positions, defined in Figure 1(b).
| Pertinent Splice Site | | |
|---|
| A | B | Strand | Direction |
|---|
| Exonic | Donorα
| + | → |
| Exonic | Donorα
| - | ← |
| Intronic | Acceptorβ
| + | ← |
| Intronic | Acceptorβ
| - | → |
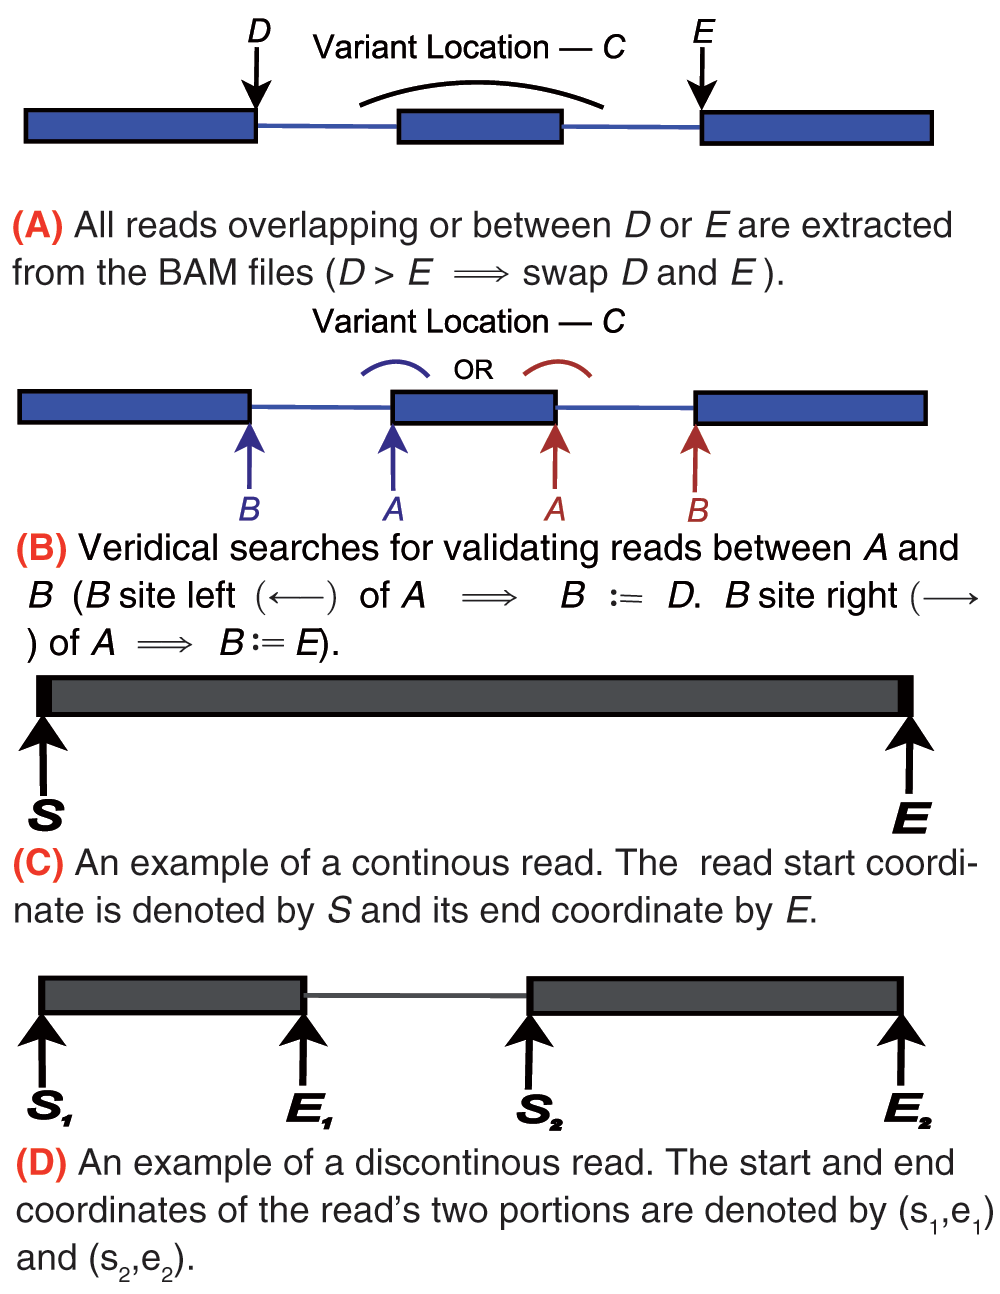
Figure 1.
A diagram portraying the definitions used within Veridical to specify genic variant position and read coordinates. We employ the same conventions as IGV14. Blue lines denote genes, wherein thick lines represent exons and thin lines represent introns. Grey lines denote reads, wherein thick lines denote a read mapping to some particular location in the genome and thin lines represent connecting segments of reads that are split across spliced-in regions (i.e. exons or included introns).
The program uses the BamTools API15 to iterate over all of the reads within a given genomic region across experimental and control samples. Individual reads are then assessed for their corroborating value towards the analysis of the variant being processed, as outlined in the flowchart in Figure 2. Validating reads are based on whether they alter either the location of the splice junction (i.e. junction-spanning) or the abundance of the transcript, particularly in intronic regions (i.e. read-abundance). Junction-spanning reads contain DNA sequences from two adjacent exons or are reads that extend into the intron. These reads directly show whether the intronic sequence is removed or retained by the spliceosome, respectively. Read-abundance validated reads are based upon sequences predicted to be found in the mutated transcript in comparison with sequences that are expected to be excised from the mature transcript in the absence of a mutation. Both types of reads can be used to validate cryptic splicing, exon skipping, or intron inclusion. A read is only said to corroborate cryptic splicing if and only if the variant under consideration is expected to activate cryptic splicing. Junction-spanning, cryptic splicing reads are those in which a read is exactly split from the cryptic splice site to the adjacent exon junction. For read-abundance cryptic splicing, we define the concept of a read fraction, which is the ratio of the number of reads corroborating the cryptically spliced isoform and the number of reads that do not support the use of the cryptic splice site (i.e. non-cryptic corroborating) in the same genomic region of a sample. Cryptic corroborating reads are those which occur within the expected region where cryptic splicing occurs (i.e. spliced-in regions). This region is bounded by the variant splice site location and the adjacent (direction dependent) splice junction. Non-cryptic corroborating reads, which we also term "anti-cryptic" reads, are those that do not lie within this region, but would still be retained within the portion that would be excised, had cryptic splicing occurred. To identify instances of exon skipping, Veridical only employs junction-spanning reads. A read is considered to corroborate exon skipping if the connecting read segments are split such that it connects two exon boundaries, skipping an exon in between. A read is considered to corroborate intron inclusion when the read is continuous and either overlaps with the intron-exon boundary (and is then said to be junction-spanning) or if the read is within an intron (and is then said to be based upon read-abundance).
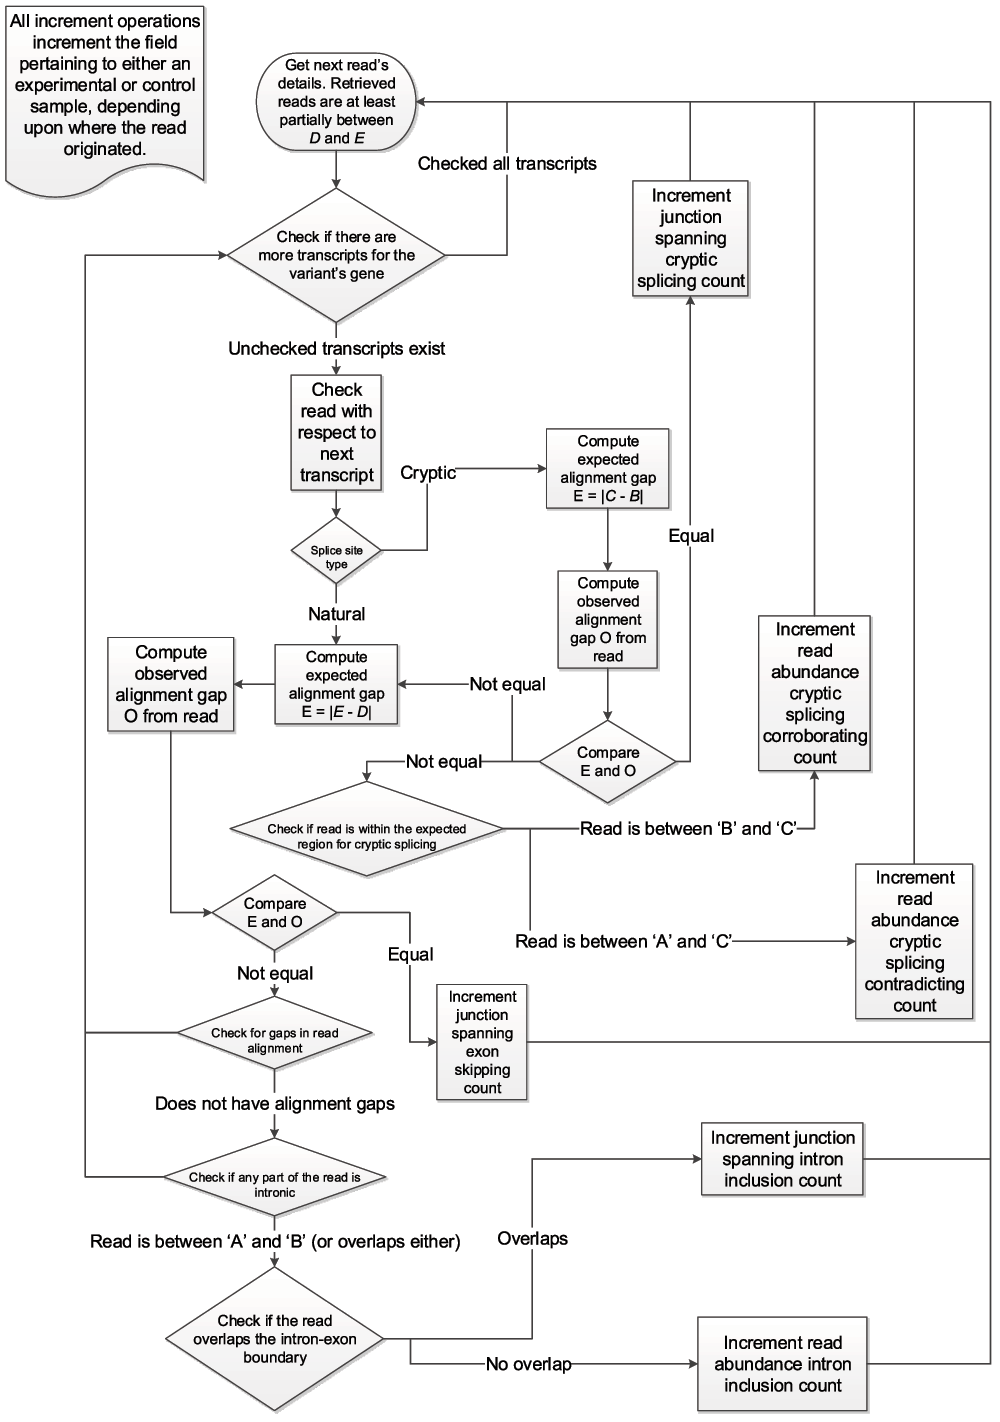
Figure 2.
The algorithm employed by Veridical to validate variants. Refer to Table 1 for definitions concerning direction and Figure 1 for variable definitions.
We proceed to formalize the above descriptions as follows. A given read is denoted by r, with start and end coordinates (rs, re), if the read is continuous, as diagrammed within Figure 1(c), or otherwise, with start and end coordinate pairs, () and (), as diagrammed within Figure 1(d). Let ℓ be the length of the read. The set ζ denotes the totality of validating reads. The criterion for r ∈ ζ is detailed below. It is important to note that validating reads are necessary but not sufficient to validate a variant. Sufficiency is achieved only if the number of validating reads is statistically significant relative to those present in control samples. ζ itself is partitioned into three sets: ζc, ζe, and ζi for evidence of cryptic splicing, exon skipping, and intron inclusion, respectively. We allow partitions to be empty. Let S denote the relevant splice junctions as defined by Figure 1 and Table 1. Without loss of generality, we consider only the red (i.e. direction is right) set of labels within Figure 1(b). Then the (splice consequence) partitions of ζ are given by:
r ∈ ζc ⇔ variant is cryptic ∧ = C – S ∨
(rs > A ∧ re < S)
r ∉ ζc ∧ variant is cryptic ∧ ¬ ( = C – S) ⇒ r ∈ anticryptic
r ∈ ζe ⇔
r ∈ ζi ⇔ (A∈ [rs, re]) ∨ B ∈ [rs, re]) ∨
[(A ∉ [rs, re] ∧ B ∉ [rs, re]) ∧ (rs < A – ℓ ∧ re > B ∧ r ∉ (A, B))]
We separately partition ζ by its evidence type, the set of junction-spanning reads, δ and read-abundance reads, α, as follows:
r ∈ δ ⇔ (A ∈ [rs, re] ∨ B ∈ [rs, re]) ∨
[r ∈ ζc ∧ = C – S]. r ∈ α ⇔ r ∉ δ
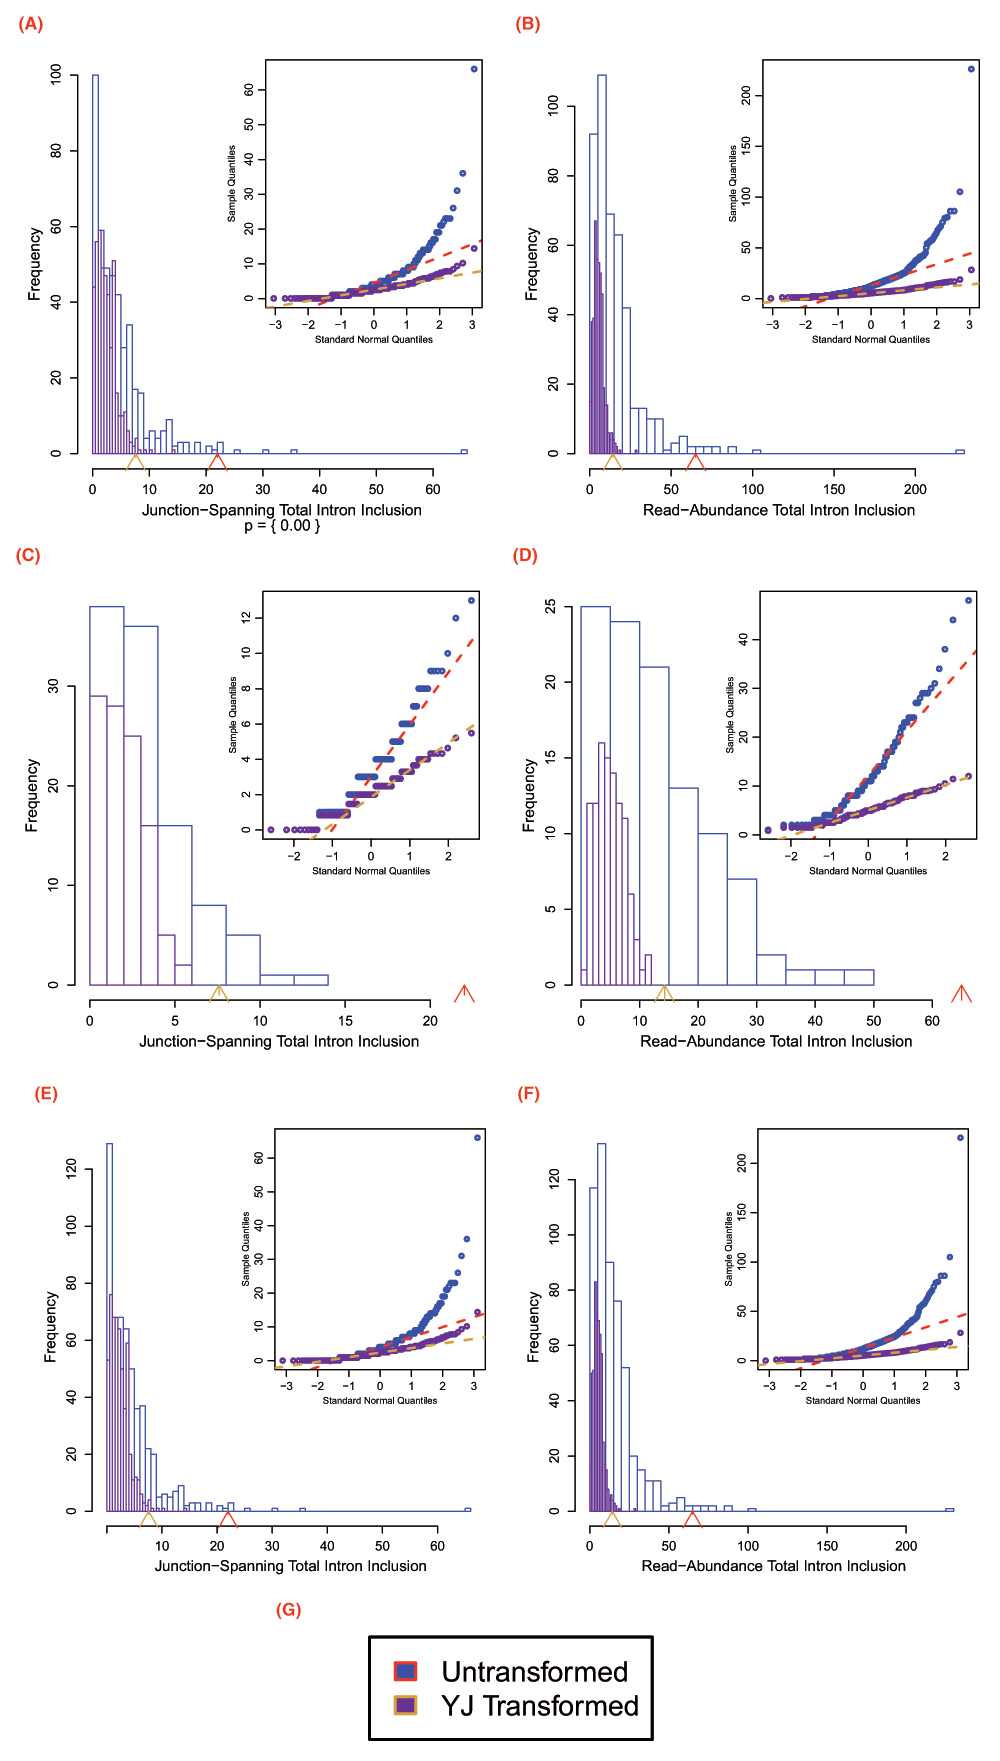
Once all validating reads are tallied for both the experimental and control samples, a p-value is computed. This is determined by computing a z-score upon Yeo-Johnson (YJ)16 transformed data. This transformation, shown in Equation 1, ensures that the data is sufficiently normally distributed to be amenable to parametric testing.
The transform is similar to the Box-Cox power transformation, but obviates the requirement of inputting strictly positive values and has more desirable statistical properties. Furthermore, this transformation allowed us to avoid the use of non-parametric testing, which has its own pitfalls regarding assumptions of the underlying data distribution17. We selected λ = , because Veridical’s untransformed output is skewed left, due to their being, in general, less validating reads in control samples and the fact that there are, by design, vastly more control samples than experimental samples. We found that this value for λ generally made the distribution much more normal.
A comparison of the distributions of untransformed and transformed data is provided in Figure S1. We were not concerned about small departures from normality as a z-test with a large number of samples is robust to such deviations18. It is important to realize, therefore, that the p-values given by Veridical are much more robust when the program is provided with a large number of samples.
Thus, we can compute the p-value of the pairwise unions of the two sets of partitions of ζ, except the irrelevant ζe ∪ α = ∅. We only provide p-values for these pairwise unions and do not attempt to provide p-values for the partitions for the different consequences of the mutations on splicing. While such values would be useful, we do not currently have a robust means to compute them. Our previous work provides guidance on interpretation of splicing mutation outcomes3–5,10. Thus for ζx ∈ {ζc, ζe, ζi}, let ΦZ(z) represent the cumulative distribution function of the one-sided (right-tailed — i.e. P[X > x]) standard normal distribution. Let N represent the total number of samples and let V represent the set of all ζx validations, across all samples. Then:
The program outputs two tables, along with summaries thereof. The first table lists all validated read counts across all categories for experimental samples, while the second table does the same for the control samples. P-values are shown in parentheses within the experimental table, which refer to the column-dependent (i.e. the category is given in the column header) p-value for that category with respect to that same category in control samples. The program produces three files: a log file containing all details regarding validated variants, an output file with the programs progress reports and summaries, and a filtered validated variant file. The filtered file contains all validated variants of statistical significance (set as p < 0.05, by default), defined as variants with one or more validating read categories which achieve statistical significance in a relevant category (i.e. a cryptic variant for which p = 0.04 in the junction-spanning cryptic column would meet this criteria).
We elected to use RefSeq19 genes for the exome annotation, as opposed to, the more permissive exome annotation sets, UCSC Known Genes20 or Ensembl21. The large number of transcript variants within Ensembl, in particular, caused many spurious intron inclusion validation events. This occurred because reads were found to be intronic in many cases, when in actuality they were exonic with respect to the more common transcript variant. In addition, the inclusion of the large number of rare transcripts in Ensembl significantly increased program runtime and made validation events much more challenging to interpret unequivocally. The use of RefSeq, which is a conservative annotation of the human exome, resolves these issues.
We also provide an R program22 which produces publication quality histograms displaying embedded Q-Q plots and p-values, to evaluate for normality of the read distribution and statistical significance, respectively. The R program performs the YJ transformation as implemented in the car package23. The histograms generated by the program use the Freedman-Draconis24 rule for break determination, and the Q-Q plots use algorithm Type 8 for their quantile function, as recommended by Hyndman and Fan25. Lastly, a Perl program was implemented to automatically retrieve and correctly format an exome annotation file from the UCSC database20 for use in Veridical. All data uses hg19/GRCh37, however when new versions of the genome become available, this program can be used to update the annotation file.
Results
Veridical validates predicted mRNA splicing mutations using high-throughput RNA sequencing data. The performance of the software is affected by the number of predicted splicing mutations, the number of abnormal samples containing mutations and control samples and the corresponding RNA-Seq data for each type of sample. Veridical has the ability to analyze approximately 3000 variants in approximately 4 hours assuming an input of 100 BAM files of RNA-Seq data. The relationship between time and numbers of BAM files and variants are plotted in Figure 3 for a 2.27 GHz processor. Veridical uses memory in linear proportion to the number and size of the input BAM files. In our tests, using RNA-Seq BAM files with an average size of approximately 6 GB, Veridical used approximately 0.7 GB for ten files to 1 GB for 100 files. Currently, splicing consequences that are reported include intron inclusion, exon skipping, and cryptic splicing, which are validated through junction-spanning reads, or based on read-abundance in the region circumscribing the variant (see Methods for details). For example, a cryptic splicing junction-spanning read will show that the mRNA contains a truncated or extended exon at the predicted location, which is directly attached to the sequence of the corresponding adjacent exon. For mutations that alter read-abundance, each read within the genomic location assessed (i.e. intron for intron inclusion) is counted for the variant-containing samples and then compared with the number of reads in the control files. For each input variant, Veridical outputs the number of validating reads (i.e. RNA-Seq reads which corroborate the predicted splicing consequence) for a given splice consequence within the variant-containing tumour samples and within control samples (i.e. non-variant containing tumour samples and normal samples). The program provides read counts for the different categories for all experimental and control samples as tab-delimited tables, along with the relevant p-values, indicating the statistical probability that the predicted mutation exhibits a normal expression pattern.
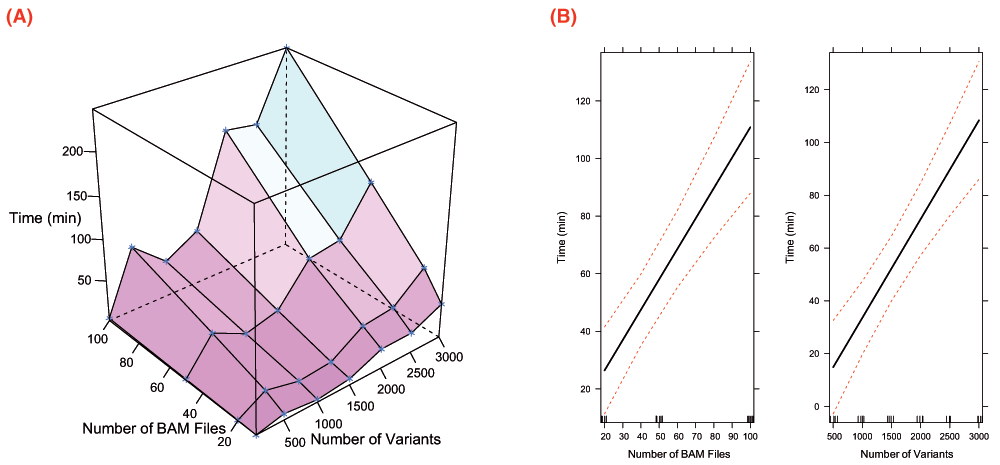
Figure 3.
Profiling data for Veridical runtime. Tests were conducted upon an Intel Xeon @2.27 GHz. Visualizations were generated with R22 using Lattice26 and Effects27. A surface plot of time vs. numbers of BAM files and variants is provided in (A). Effect plots are given in (B) and demonstrate the effects of the numbers of BAM files and variants upon runtime. The effect plots were generated using a linear regression model (R2 = 0.7525).
We demonstrate how Veridical and its associated R program are used to validate predicted splicing mutations in somatic breast cancer. Each example depicts a particular variant-induced splicing consequence, analyzed by Veridical, with its corresponding significance level. The relevant primary RNA-Seq data are displayed in IGV, along with histograms and Q-Q plots showing the read distributions for each example. The source data are obtained from controlled-access breast carcinoma data from The Cancer Genome Atlas (TCGA)28. Tumour-normal matched DNA sequencing data from the TCGA consortium was used to predict a set of splicing mutations, and a subset of corresponding RNA sequencing data was analyzed to confirm these predictions with Veridical. The following examples demonstrate the utility of Veridical to identify potentially pathogenic mutations from a much larger subset of predicted variants.
Leaky mutations are those variants that reduce, but not abolish, the spliceosome’s ability to recognize the intron/exon boundary3. This can lead to the mis-splicing (intron inclusion and/or exon skipping) of many but not all transcripts. An example of a predicted leaky mutation (chr5:162905690 G>T) in the HMMR gene in which both junction-spanning exon skipping (p < 0.01) and read-abundance-based intron inclusion (p = 0.04) are observed is provided within Figure 4. We predict this mutation to be leaky because its final Ri exceeds 1.6 bits — the minimal individual information required to recognize a splice site and produce correctly spliced mRNA4. Indeed, the natural site, while weakened by 2.16 bits, remains strong — 10.67 bits. This prediction is validated by the variant-containing sample’s RNA-Seq data (Figure 4), in which both exon skipping (5 reads) and intron inclusion (14 reads) are observed, along with 70 reads portraying wild-type splicing. Only a single normally spliced read contains the G→T mutation. These results are consistent with an imbalance of expression of the two alleles, as expected for a leaky variant. Figure 5 shows that for the distribution of read-abundance-based intron inclusion is statistically significant (p = 0.04).
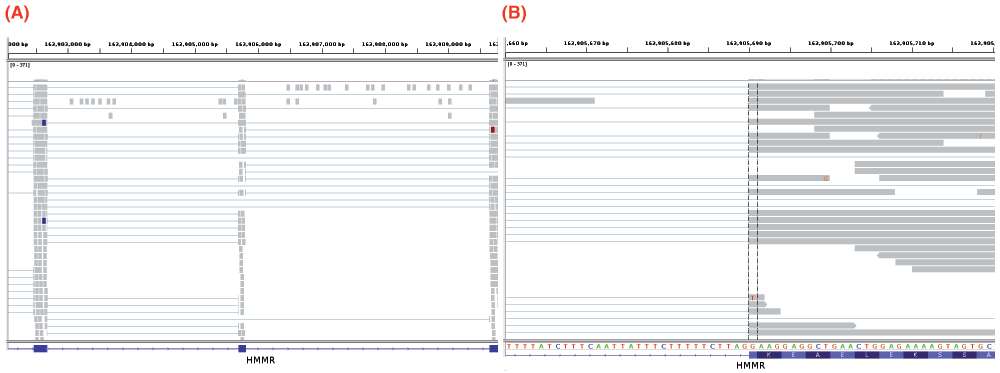
Figure 4.
IGV images depicting a predicted leaky mutation (chr5:162905690 G>T) within the natural acceptor site of exon 12 (162905689–162905806) of HMMR. This gene has four transcript variants and the given exon number pertains to isoforms a and b (reference sequences NM_001142556 and NM_012484). RNA-Seq reads are shown in the centre panel. The bottom blue track depicts RefSeq genes, wherein each blue rectangle denotes an exon and blue connecting lines denote introns. In the middle panel, each rectangle (grey by default) denotes an aligned read, while thin lines are segments of reads split across exons. Red and blue coloured rectangles in the middle panel denote aligned reads of inserts that are larger or smaller than expected, respectively. (A) depicts a genomic region of chromosome 5: 162902054–162909787. The variant occurs in the middle exon. Intron inclusion can be seen in this image, represented by the reads between the first and middle exon (since the direction is right, as described within Table 1). These 14 reads are read-abundance-based, since they do not span the intron-exon junction. (B) depicts a closer view of the region shown in (A) — 162905660–162905719. The dotted vertical black lines are centred upon the first base of the variant-containing exon. The thin lines in the middle panel that span the entire exon fragment are evidence of exon skipping. These 5 reads are split across the exon before and after the variant-containing exon, as seen in (A).
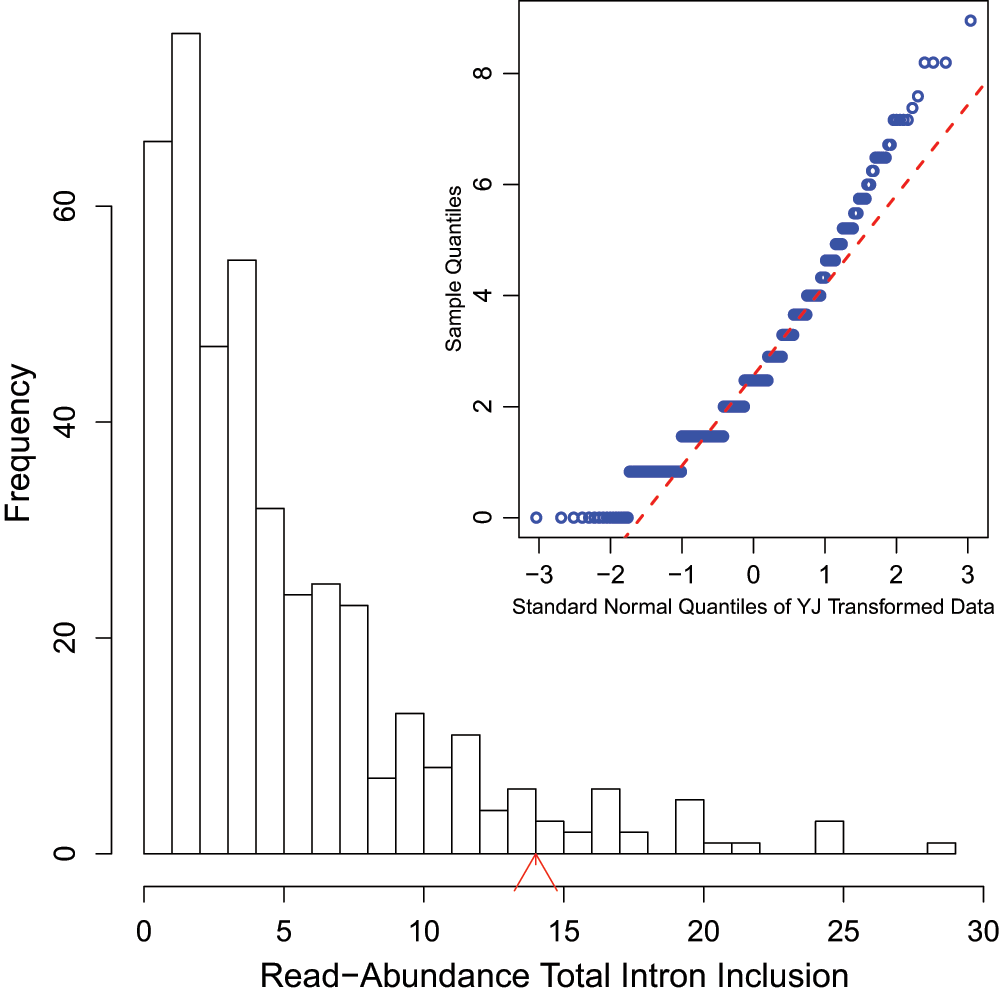
Figure 5.
Histogram of read-abundance-based intron inclusion with embedded Q-Q plots of the predicted leaky mutation (chr5:162905690 G>T) within HMMR, as shown in Figure 4. The arrowhead denotes the number of reads (14 in this case) in the variant-containing file which is more than observed in the control samples (p = 0.04).
Variants that inactivate splice sites have negative final Ri values3 with only rare exceptions4, indicating that splice site recognition is essentially abolished in these cases. We present the analysis of two inactivating mutations within the PTEN and TMTC2 genes from different tumour exomes, namely: chr10:89711873 A>G and chr12:83359523 G>A, respectively. The PTEN variant displays junction-spanning exon skipping events (p < 0.01), while the TMTC2 gene portrays both junction-spanning and read-abundance-based intron inclusion (both splicing consequences with p < 0.01). In addition, all intron inclusion reads in the experimental sample contain the mutation itself, while only one such read exists across all control samples analyzed (p < 0.01). The PTEN variant contains numerous exon skipping reads (32 versus an average of 2.466 such reads per control sample). The TMTC2 variant contains many junction-spanning intron inclusion reads with the G→A mutation (all of its junction-spanning intron inclusion reads: 22 versus an average of 0.002 such reads per control sample). IGV screenshots for these variants are provided within Figure 6. This figure also shows an example of junction-spanning cryptic splice site activated by the mutation (chr1:985377 C>T) within the AGRN gene. The concordance between the splicing outcomes generated by these mutations and the Veridical results indicates that the proposed method detects both mutations that inactivate splice sites and cryptic splice site activation.
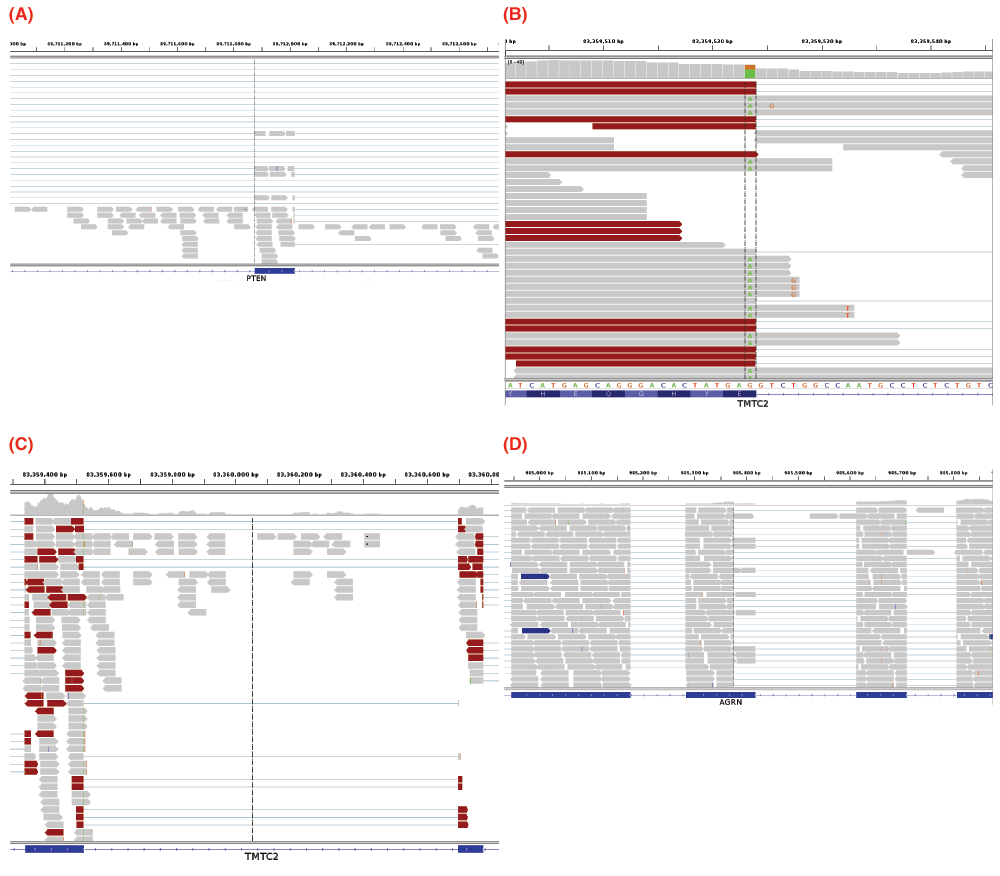
Figure 6.
(A) depicts an inactivating mutation (chr10:89711873 A>G) within the natural acceptor site of exon 6 (89711874–89712016) of PTEN. The dotted vertical black line denotes the location of the relevant splice site. The region displayed is 89711004–89712744 on chromosome 10. Many of the 32 exon skipping reads are evident, typified by the thin lines in the middle panel that span the entire exon. There is also a significant amount of read-abundance-based intron inclusion, shown by the reads to the left of the dotted vertical line. Exon skipping was statistically significant (p < 0.01), while read-abundance-based intron inclusion was not (p = 0.53). Panels (B) and (C) depict an inactivating mutation (chr12:83359523 G>A) within the natural donor site of exon 6 (83359338–83359523) of TMTC2. (B) depicts a closer view (83359501–83359544) of the region shown in (C) and only shows exon 6. Some of the 22 junction-spanning intron inclusion reads can be seen. In this case, all of these reads contain the mutation, shown by the green adenine base in each read, between the two vertical dotted lines. (C) depicts a genomic region of chromosome 12: 83359221–83360885, TMTC2 exons 6–7. The variant occurs in the left exon. 65 read-abundance-based intron inclusion can be seen in this image, represented by the reads between the two exons. Panel (D) depicts a mutation (chr1:985377 C>T) causing a cryptic donor to be activated within exon 27 (the second from left, 985282–985417) of AGRN. The region displayed is 984876–985876 on chromosome 1 (exons 26–29 are visible). Some of the 34 cryptic (junction-spanning) reads are portrayed. The dotted black vertical line denotes the cryptic splice site, at which cryptic reads end. Refer to the caption of Figure 4 for IGV graphical element descriptions.
Recurrent genetic mutations in some oncogenes have been reported among tumours within the same, or different, tissues of origin. Common recurrent mutations present in multiple abnormal samples are recognized by Veridical. This avoids including a variant-containing sample among the control group, and outputs the results of all of the variant-containing samples. A relevant example is shown in Figure 7. The mutation (chr1:46726876 G>T) causes activation of a cryptic splice site within RAD54L in multiple tumours. Upon computation of the p-values for each of the variant-containing tumours, relative to all non-variant containing tumours and normal controls, not all variant-containing tumours displayed splicing abnormalities at statistically significant levels. Of the six variant-containing tumours, two had significant levels of junction-spanning intron inclusion, and one showed statistically significant read-abundance-based intron inclusion. Details for all of the aforementioned variants, including a summary of read counts pertaining to each relevant splicing consequence, for experimental versus control samples, are provided in Table 2.
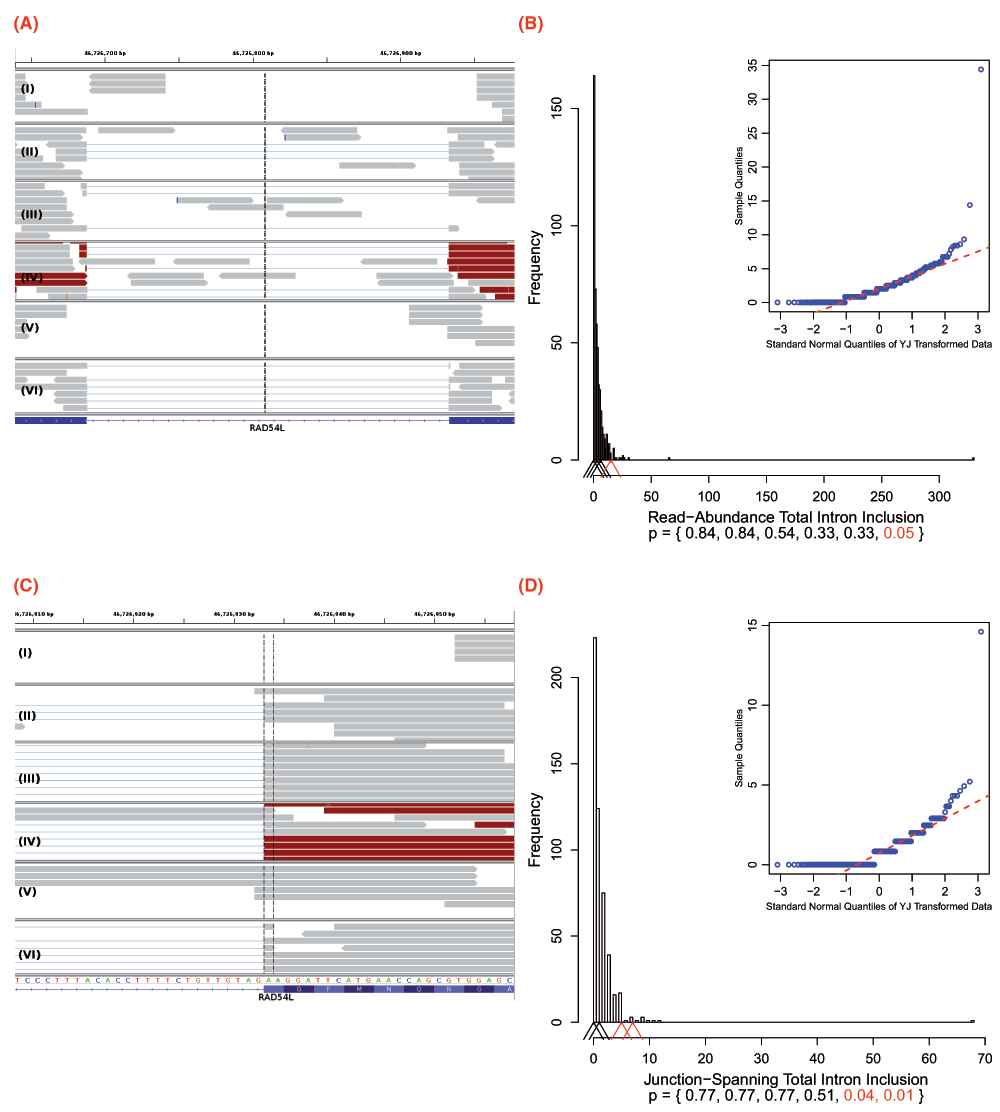
Figure 7.
IGV images and their corresponding histograms with embedded Q-Q plots depicting all six variant containing files with a mutation (chr1:46726876 G>T) which, in some cases, causes a cryptic donor to be activated within the intron between exons 7 and 8 of RAD54L. This results in the extension of the downstream natural donor (the 5´ end of exon 8). This gene has two transcript variants and the given exon numbers pertain to isoform a (reference sequence NM_003579). Only samples IV and V have statistically significant intron inclusion relative to controls. read-abundance-based intron inclusion can be seen in (A), between the two exons. The region displayed is on chromosome 1: 46726639–46726976. (B) depicts the corresponding histogram for the 15 read-abundance-based intron inclusion reads (p = 0.05) that are present in sample IV. The intron-exon boundary on the right is the downstream natural donor. (C) typifies some of the 13 junction-spanning intron inclusion reads that are a direct result of the intronic cryptic site’s activation. In these instances, reads extending past the intron-exon boundary are being spliced at the cryptic site, instead of the natural donor. In particular, samples IV and V both have a statistically significant numbers of such reads, 7 (p = 0.01) and 5 (p = 0.04), respectively. This is further typified by the corresponding histogram in (D). (C) focuses upon exon 8 from (A) and displays the genomic positions 46726908–46726957. Refer to the caption of Figure 4 for IGV graphical element descriptions. In the histograms, arrowheads denote numbers of reads in the variant-containing files. The bottom of the plots provide p-values for each respective arrowhead. Statistically significant p-values and their corresponding arrowheads are denoted in red.
Table 2. Examples of variants validated by Veridical. Header abbreviations Chr, Cv, Cs, #, SC, and ET, denote chromosome, variant coordinate, splice site coordinate, sample number (where applicable), splicing consequence, and evidence type, respectively.
Headers containing R with some subscript denote numbers of validated reads for the specified variant’s splicing consequence(s) and evidence type(s). RE denotes reads within variant-containing tumour samples. RT and RN denote control samples, for tumours and normal cells, respectively. Rμ is the per sample mean of RT and RN. Splicing consequences: CS denotes cryptic splicing, ES denotes exon skipping, and II denotes intron inclusion. Evidence types: JS denotes junction-spanning and RA denotes read-abundance.
| Gene | Chr | Cv | Cs | Variant | Type | Initial Ri | Final Ri | ΔRi | # | SC | ET | p-value | RE | RT | RN | Rμ | Figure |
|---|
| HMMR | chr5 | 162905690 | 162905689 | G/T | Leaky | 12.83 | 10.67 | -2.16 | | ES | JS | < 0.01 | 5 | 11 | 0 | 0.020 | [4],[5] |
| II | RA | 0.04 | 14 | 2133 | 103 | 4.051 | |
| PTEN | chr10 | 89711873 | 89711874 | A/G | Inactivating | 12.09 | -2.62 | -14.71 | | ES | JS | < 0.01 | 32 | 975 | 386 | 2.466 | [6(A)] |
| TMTC2 | chr12 | 83359523 | 83359524 | G/A | Inactivating | 1.74 | -1.27 | -3.01 | | II | JS | < 0.01 | 22 | 2241 | 383 | 4.754 | [6(B)] |
| II | JSwM | < 0.01 | 22 | 0 | 1 | 0.002 | |
| II | RA | < 0.01 | 65 | 7293 | 1395 | 15.739 | [6(C)] |
| AGRN | chr1 | 985377 | 985376 | C/T | Cryptic | -2.24 | 4.79 | 7.03 | | CS | JS | < 0.01 | 34 | 97 | 23 | 0.217 | [6(D)]
|
| RAD54L | chr1 | 46726876 | 46726895 | G/T | Cryptic | 13.4 | 14.84 | 1.44 | I | II | JS | N/A | 0 | 645 | 58 | 1.274 | [7] |
| II | RA | 0.54 | 3 | 2171 | 290 | 4.458 | |
| II | II | JS | 0.51 | 1 | 645 | 58 | 1.274 | |
| II | RA | 0.33 | 6 | 2171 | 290 | 4.458 | |
| III | II | JS | N/A | 0 | 645 | 58 | 1.274 | |
| II | RA | 0.33 | 6 | 2171 | 290 | 4.458 | |
| IV | II | JS | 0.01 | 7 | 645 | 58 | 1.274 | |
| II | RA | 0.05 | 15 | 2171 | 290 | 4.458 | |
| V | II | JS | 0.04 | 5 | 645 | 58 | 1.274 | |
| II | RA | N/A | 0 | 2171 | 290 | 4.458 | |
| VI | II | JS | N/A | 0 | 645 | 58 | 1.274 | |
| II | RA | N/A | 0 | 2171 | 290 | 4.458 | |
Discussion
We have implemented Veridical, a software program that automates confirmation of mRNA splicing mutations by comparing sequence read-mapped expression data from samples containing variants that are predicted to cause defective splicing with control samples lacking these mutations. The program objectively evaluates each mutation with statistical tests that determine the likelihood of and exclude normal splicing. To our knowledge, no other software currently validates splicing mutations with RNA-Seq data on a genome-wide scale, although many applications can accurately detect conventional alternative splice isoforms (i.e.29). Veridical is intended for use with large data sets derived from many samples, each containing several hundred variants that have been previously prioritized as likely splicing mutations, regardless of how the candidate mutations are selected. It is not practical to analyze all variants present in an exome or genome, rather only a filtered subset, due to the extensive computations required for statistical validation. As such, Veridical is a key component of an end-to-end, hypothesis-based, splicing mutation analysis framework that also includes the Shannon splicing mutation pipeline10 and the Automated Splice Site Analysis and Exon Definition server5.
There is a trade-off between lengthy run-times and statistical robustness of Veridical, especially when there are either a large number of variants or a large number of RNA-Seq files. As with most statistical methods, those employed here are not amenable to small sample sets, but become quite powerful when a large number of controls are employed. In order to ensure that mutations can be validated, we recommend an excess of control transcriptome data relative to those from samples containing mutations (> 5 : 1), regardless of the computational expense. We do not recommend the use of a single control to corroborate a sample containing a putative mutation. Not surprisingly, we have found that junction-spanning reads have the greatest value for corroborating cryptic splicing and exon skipping. Even a single such read is almost always sufficient to merit the validation a variant, provided that sufficient control samples are used. For intron inclusion, both junction-spanning and read-abundance-based reads are useful and a variant can readily be validated with either, provided that the variant-containing experimental sample(s) show a statistically significant increase in the presence of either form of intron inclusion corroborating reads.
Veridical is able to automatically process variants from multiple different experimental samples, and can group the variant information if any given mutation is present in more than one sample. The use of a large sample size allows for robust statistical analyses to be performed, which aid significantly in the interpretation of results. The main utility of Veridical is to filter through large data sets of predicted splicing mutations to prioritize the variants. This helps to predict which variants will have a deleterious effect upon the protein product. Veridical is able to avoid reporting splicing changes that are naturally occurring through checking all variant-containing and non-containing control samples for the predicted splicing consequence. In addition, running multiple tumour samples at once allows for manual inspection to discover samples that contained the alternative splicing pattern, and consequently, permits the identification of DNA mutations in the same location which went undetected during genome sequencing.
The statistical power of Veridical is dependent upon the quality of the RNA-Seq data used to validate putative variants. In particular, a lack of sufficient coverage at a particular locus will cause Veridical to be unable to report any significant results. A coverage of at least 20 reads should be sufficient. This estimate is based upon alternative splicing analyses in which this threshold was found to imply concordance with microarray and RT-PCR measurements30–33. There are many potential legitimate reasons why a mutation may not be validated: (a) nonsense-mediated decay may result in a loss of expression of the entire transcript, (b) the gene itself may have multiple paralogs and reads may not be unambiguously mapped, (c) other non-splicing mutations could account for a loss of expression, and (d) confounding natural alternative splicing isoforms may result in a loss of statistical significance during read mapping of the control samples. The prevalence of loci with insufficient data is dependent upon the coverage of the sequencing technology used. As sequencing technologies improve, the proportion of validated mutations is expected to increase. Such an increase would mirror that observed for the prevalence of alternative splicing events34. It is important to note that acceptance of the null hypothesis, due to an absence of evidence required to disprove it, does not imply that the underlying prediction of a mutation at a particular locus is incorrect, but merely that the current empirical methods employed were insufficient to corroborate it.
While there is considerable prior evidence for splicing mutations that alter natural and cryptic splice site recognition, we were somewhat surprised at the apparent high frequency of statistically significant intron inclusion revealed by Veridical. In fact, evidence indicates that a significant portion of the genome is transcribed34, and it is estimated that 95% of known genes are alternatively spliced30. Defective mRNA splicing can lead to multiple alternative transcripts including those with retained introns, cassette exons, alternate promoters/terminators, extended or truncated exons, and reduced exons35. In breast cancer, exon skipping and intron retention were observed to be the most common form of alternative splicing in triple negative, non-triple negative, and HER2 positive breast cancer36. In normal tissue, intron retention and exon skipping has been predicted to affect 2572 exons in 2127 genes and 50 633 exons in 12 797 genes, respectively37. In addition, previous studies suggest that the order of intron removal can influence the final mRNA transcript composition of exons and introns38. Intron inclusion observed in normal tissue may result from those introns that are removed from the transcript at the end of mRNA splicing. Given that these splicing events are relatively common in normal tissues, it becomes all the more important to distinguish expression patterns that are clearly due to the effects of splicing mutations — one of the guiding principles of the Veridical method.
Veridical is an important analytical resource for unsupervised, thorough validation of splicing mutations through the use of companion RNA-Seq data from the same samples. The approach will be broadly applicable for many types of genetic abnormalities, and should reveal numerous, previously unrecognized, mRNA splicing mutations in exome and complete genome sequences.


Comments on this article Comments (0)