Introduction
Pooled short hairpin RNA sequencing (shRNA-seq) screens couple RNA interference (RNAi) with second generation sequencing to enable researchers to elucidate gene function in an unbiased, high-throughput manner1. Several recent high impact studies have exploited this technology to discover novel genes involved in processes including cell fate decisions of normal and cancer cells, and to generate genetic interaction maps in mammalian cells2–4.
Pooled shRNA screening relies on the stable genomic integration (often by viral transduction) of expression cassettes that allow stable or inducible expression of shRNAs targeting specific genes in a large population of cells. Depending on the biological question of interest, typically two or more cell populations are compared either in the presence or absence of a selective pressure, or as a time-course before and after a selective pressure is applied. Gain of shRNA representation within a pool suggests that target gene knockdown confers some sort of advantage to a cell. Similarly, genes whose knockdown is disadvantageous may be identified through loss of shRNA representation. Screening requires a library of shRNA constructs in a lentiviral or retroviral vector backbone that is used to generate a pool of virus for transducing cells of interest. The relative abundance of these shRNAs in transduced cells is then quantified by PCR amplification of proviral integrants from genomic DNA using primers designed to amplify all shRNA cassettes equally, followed by second-generation amplicon sequencing (Figure 1A). Sample-specific primer indexing allows many different conditions to be analyzed in parallel.
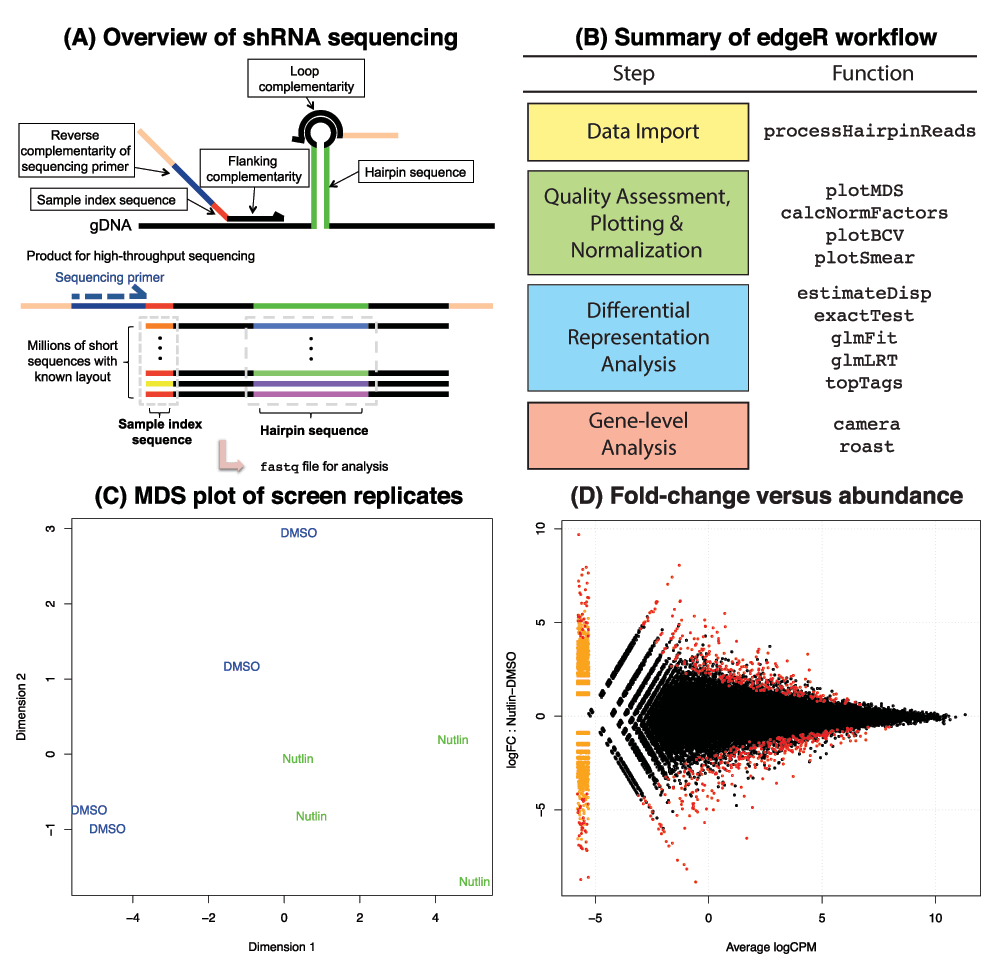
Figure 1. Summary of the raw data, workflow and diagnostic plots from edgeR.
(A) Structure of the amplicons sequenced in a typical shRNA-seq screen. Each one contains sample and hairpin specific sequences at predetermined locations. After sequencing, the raw data is available in a fastq file. (B) The main steps and functions used in an analysis of shRNA-seq screen data in edgeR are shown. (C) Example of a multidimensional scaling (MDS) plot showing the relationships between replicate dimethyl sulfoxide (DMSO) and Nutlin treated samples (data from Sullivan et al. (2012)3). MDS plots provide a quick display of overall variability in the screen and can highlight inconsistent samples. (D) Plot of log2-fold-change versus hairpin abundance (log2CPM) for the same data. Hairpins with a false discovery rate < 0.05 from an exact test analysis in edgeR (highlighted in red) may be prioritized for further validation.
As the popularity of this approach grows, there is a need to develop suitable analysis pipelines to handle the large volumes of raw data that each screen generates. The major steps in an analysis involve processing the raw sequence reads, assessing the data quality and determining representational differences in the screen in a statistically rigorous way.
Two pipelines are currently available for this task. The shALIGN program5 is a custom Perl script that trims the sequence reads to the pre-defined base positions and then matches these to a library of hairpin sequences. Mismatch bases are permitted, and any ambiguous matches are ignored from the final hairpin count. Statistical analysis of the data is then performed using the shRNAseq R package5, which calculates log-ratios of the counts from each screen replicate, normalizes these values and ranks hairpins by their median, mean or t-statistic. Another solution is the BiNGS!SL-seq program6 that uses Bowtie to perform sequence mapping followed by statistical analysis in edgeR7.
In this article, we describe a complete analysis solution for shRNA-seq screens accessible from within the edgeR package available from Bioconductor8.
Implementation
A summary of the main steps in a typical shRNA-seq analysis alongside the functions in edgeR that perform each task is given in Figure 1B.
Sequence pre-processing
Our sequence counting procedure has been tailored for screens where PCR amplified shRNA constructs of known structure are sequenced using second generation sequencing technology (Figure 1A). The location of each index and hairpin sequence is used to determine matches between a specified list of index and hairpin sequences expected in the screen with the sequences in the fastq file. Mismatches in the hairpin sequence are allowed to accommodate sequencing errors, as are small shifts in the position of the hairpin sequence within the read. Analysis of unpublished in-house data reveals that allowing for mismatches can yield up to 4.4% additional reads, and shifting an extra 2.6%. This simple searching strategy is implemented in C, with the user interface provided by the processHairpinReads function in edgeR. Input to this function consists of a fastq file/s, a second file containing sample IDs and their index sequences and a third file listing hairpin IDs and their sequences (the latter files are tab-delimited). A screen with 100 million reads (one lane from an Illumina HiSeq 2000) can be processed in 2-15 minutes depending on the processing parameters. Fastq processing requires minimal RAM, allowing analysis to be completed on any standard computer with R9 installed.
The matrix of counts returned by the processHairpinReads function, which contains hairpins in the rows and samples in the columns, is stored as a DGEList object so that it is fully interoperable with the downstream analysis options available in edgeR. Such an object can also be created directly by the user in the event that the hairpin counts have been summarized by alternate means.
Next, the data quality of a screen can be assessed conveniently using multidimensional scaling (MDS) plots via plotMDS (Figure 1C) and access to a range of normalization options is available through the calcNormFactors function.
Differential representation analysis
The shRNAseq software5 assumes simple experimental set-ups (e.g. comparing two conditions) that are unsuitable in more complicated situations, such as time-course designs. In edgeR, screens can be analyzed using either the classic method10, ideal for simple two-group comparisons, or generalized linear models (GLMs)11 for more complex screens with multiple conditions (using the glmFit function). This framework can accommodate hairpin-specific variation of both a technical and biological nature as estimated via the estimateDisp function and visualized using plotBCV, which plots biological variability as a function of average hairpin abundance. Statistical testing for changes in shRNA abundance between conditions of interest (typically over time) is carried out using exact (see exactTest function) or likelihood ratio (glmLRT) tests that allow results to be ranked by significance using the topTags function and plotted using the plotSmear function (Figure 1D).
Gene set analysis tools available via roast12 and camera13 allow researchers to further test and prioritize screen results. This capability can be used to obtain a gene-by-gene ranking, rather than a hairpin-specific one, which can be helpful when shRNA libraries contain multiple hairpins targeting each gene.
Case studies and further extensions
We provide example data sets and a complete analysis script that demonstrate how to use the edgeR package to prioritize data from four different pooled shRNA-seq screens14. These examples were chosen to showcase edgeR’s ability to deal with experiments of varying size (from tens to thousands of hairpins) and complexity, from two-group situations, to settings with four groups, or a time-course design, where a GLM with a slope and intercept term is most appropriate. We have also developed a Galaxy tool15–17 that implements this workflow as a point-and-click application to improve accessibility for researchers who are unfamiliar with the R programming environment (Figure 2).
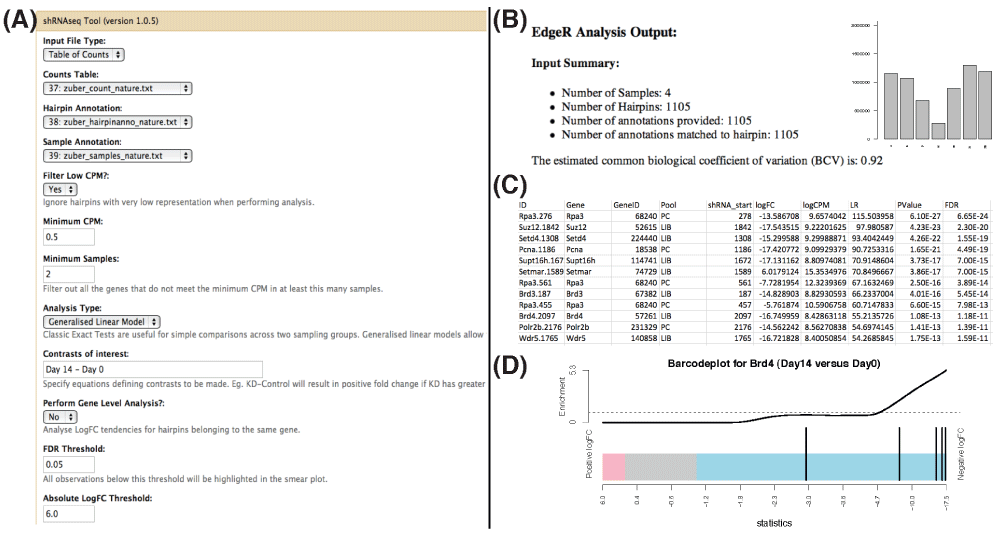
Figure 2. Screenshots of the Galaxy tool for shRNA-seq screen analysis powered by edgeR.
(A) From the main screen, the user selects the appropriate input files and analysis options. (B) The results of an analysis are summarized in an HTML page that includes various diagnostic plots. (C) Output also includes a table of ranked results at the hairpin and gene-level (where appropriate) as well as barcode plots (D) that highlight the ranks of hairpins targeting a specific gene relative to all other hairpins in the data set.
Discussion
Although the major functionality of edgeR has been developed with RNA-seq data in mind, the analysis of numerous in-house data sets14 and the results of others3 have demonstrated its utility for count data derived from shRNA-seq screens. edgeR provides users with a unique tool for the analysis of data from this emerging application of second generation sequencing technology, that is capable of handling both the biological variability and experimental complexity inherent in these screens. Provision of a Galaxy module puts these powerful statistical methods within reach of experimentalists. Future work will be focused on the use of a suitable control data set to compare this analysis pipeline with other approaches such as shRNAseq5. We anticipate that the approach for differential representation analysis described in this paper will also be useful in the analysis of short-guided RNA-seq (sgRNA-seq) knockout screens as facilitated by the clustered regularly interspaced short palindromic repeats-Cas9 (CRISPR-Cas9) system18,19.
Software availability
edgeR is an R9 package distributed as part of the Bioconductor project8 (http://www.bioconductor.org). The Galaxy tool that implements this workflow is available from http://toolshed.g2.bx.psu.edu/view/shians/shrnaseq.
Author contributions
ZD and MER developed the hairpin counting software and SS developed the Galaxy tool. JMS, LJG, DLM and MEB generated the screen data analyzed in the user guide that accompanies this article and RAD developed the hairpin technology. All authors wrote and approved the manuscript.
Competing interests
No competing interests were disclosed.
Grant information
This research was supported by NHMRC Project grants 1050661 (MER) and 1059622 (MER and MEB), Victorian State Government Operational Infrastructure Support and Australian Government NHMRC IRIISS.
The funders had no role in study design, data collection and analysis, decision to publish, or preparation of the manuscript.
Acknowledgements
We thank Matthew Wakefield and Gordon Smyth for advice on data analysis, Cynthia Liu for code testing and our many collaborators at the WEHI whose research has motivated this work.
Faculty Opinions recommendedReferences
- 1.
Bassik MC, Lebbink RJ, Churchman LS, et al.:
Rapid creation and quantitative monitoring of high coverage shRNA libraries.
Nat Methods.
2009; 6(6): 443–5. PubMed Abstract
| Publisher Full Text
| Free Full Text
- 2.
Zuber J, Shi J, Wang E, et al.:
RNAi screen identifies Brd4 as a therapeutic target in acute myeloid leukaemia.
Nature.
2011; 478(7370): 524–8. PubMed Abstract
| Publisher Full Text
| Free Full Text
- 3.
Sullivan KD, Padilla-Just N, Henry RE, et al.:
ATM and MET kinases are synthetic lethal with nongenotoxic activation of p53.
Nat Chem Biol.
2012; 8(7): 646–54. PubMed Abstract
| Publisher Full Text
| Free Full Text
- 4.
Bassik MC, Kampmann M, Lebbink RJ, et al.:
A systematic mammalian genetic interaction map reveals pathways underlying ricin susceptibility.
Cell.
2013; 152(4): 909–22. PubMed Abstract
| Publisher Full Text
| Free Full Text
- 5.
Sims D, Mendes-Pereira AM, Frankum J, et al.:
High-throughput RNA interference screening using pooled shRNA libraries and next generation sequencing.
Genome Biol.
2011; 12(10): R104. PubMed Abstract
| Publisher Full Text
| Free Full Text
- 6.
Kim J, Tan AC:
BiNGS!SL-seq: a bioinformatics pipeline for the analysis and interpretation of deep sequencing genome-wide synthetic lethal screen.
Methods Mol Biol.
2012; 802: 389–98. PubMed Abstract
| Publisher Full Text
- 7.
Robinson MD, McCarthy DJ, Smyth GK:
edgeR: a Bioconductor package for differential expression analysis of digital gene expression data.
Bioinformatics.
2010; 26(1): 139–40. PubMed Abstract
| Publisher Full Text
| Free Full Text
- 8.
Gentleman RC, Carey VJ, Bates DM, et al.:
Bioconductor: open software development for computational biology and bioinformatics.
Genome Biol.
2004; 5(10): R80. PubMed Abstract
| Publisher Full Text
| Free Full Text
- 9.
R Core Team. R: A Language and Environment for Statistical Computing. R Foundation for Statistical Computing, Vienna, Austria, 2014. Reference Source
- 10.
Robinson MD, Smyth GK:
Small-sample estimation of negative binomial dispersion, with applications to sage data.
Biostatistics.
2008; 9(2): 321–32. PubMed Abstract
| Publisher Full Text
- 11.
McCarthy DJ, Chen Y, Smyth GK:
Differential expression analysis of multifactor RNA-Seq experiments with respect to biological variation.
Nucleic Acids Res.
2012; 40(10): 4288–97. PubMed Abstract
| Publisher Full Text
| Free Full Text
- 12.
Wu D, Lim E, Vaillant F, et al.:
ROAST: rotation gene set tests for complex microarray experiments.
Bioinformatics.
2010; 26(17): 2176–82. PubMed Abstract
| Publisher Full Text
| Free Full Text
- 13.
Wu D, Smyth GK:
Camera: a competitive gene set test accounting for inter-gene correlation.
Nucleic Acids Res.
2012; 40(17): e133. PubMed Abstract
| Publisher Full Text
| Free Full Text
- 14.
Ritchie ME:
Analysing shRNA-seq data using edgeR, supplementary data and documentation. 2014. Reference Source
- 15.
Giardine B, Riemer C, Hardison RC, et al.:
Galaxy: a platform for interactive large-scale genome analysis.
Genome Res.
2005; 15(10): 1451–5. PubMed Abstract
| Publisher Full Text
| Free Full Text
- 16.
Goecks J, Nekrutenko A, Taylor J:
The Galaxy Team. Galaxy: a comprehensive approach for supporting accessible, reproducible, and transparent computational research in the life sciences.
Genome Biol.
2010; 11(8): R86. PubMed Abstract
| Publisher Full Text
| Free Full Text
- 17.
Blankenberg D, Von Kuster G, Nathaniel C, et al.:
Galaxy: a web-based genome analysis tool for experimentalists.
Curr Protoc Mol Biol.
2010; Chapter 19: 19.10.1–21. PubMed Abstract
| Publisher Full Text
- 18.
Wang T, Wei JJ, Sabatini DM, et al.:
Genetic screens in human cells using the CRISPR/Cas9 system.
Science.
2014; 343(6166): 80–4. PubMed Abstract
| Publisher Full Text
| Free Full Text
- 19.
Shalem O, Sanjana NE, Hartenian E, et al.:
Genome-scale CRISPR-Cas9 knockout screening in human cells.
Science.
2014; 343(6166): 84–7. PubMed Abstract
| Publisher Full Text
Comments on this article Comments (0)