Keywords
Antimicrobials, Biofilms, E. coli, Environmental
Antimicrobials, Biofilms, E. coli, Environmental
The virtual colony count (VCC) microbiological assay has been used for over a decade to measure the effect of antimicrobial peptides such as defensins and LL-37 against a variety of bacteria. The VCC procedure first exposes bacterial cells to the active antimicrobial agent in 10 mM sodium phosphate pH 7.4 for two hours, then a twice-concentrated broth is added to simultaneously inhibit the antimicrobial activity and induce exponential growth. The method was initially developed by Robert I. Lehrer of the University of California, Los Angeles (UCLA) using twice-concentrated tryptic soy broth (2×TSB) as the outgrowth media. However, the commonly used antimicrobial susceptibility testing positive control strain E. coli ATCC® 25922™ formed macroscopic clumps in TSB up to several millimeters in diameter when grown in the in 125 mL disposable Erlenmeyer flasks with 0.22 micron filters in the caps at 37°C shaking 250 rpm (Institute of Human Virology building at the University of Maryland Baltimore [UMB]). These clumps were not present in a clinical laboratory at UMB that routinely uses ATCC® 25922™ grown in TSB for antimicrobial susceptibility testing, nor were they evident using E. coli ATCC® 43827™ (ML-35) in the IHV building. ATCC® 25922™ formed an apparently homogeneous suspension with no clumps visible to the unaided eye when Mueller-Hinton Broth (MHB) was substituted for TSB, so 2×MHB was chosen as the outgrowth media in VCC studies of E. coli ATCC® 25922™ at UMB, published between 2005 and 2013 (Ericksen et al., 2005; Zhao et al., 2013).
The method of enumeration (Brewster, 2003) of surviving cells used by VCC is termed quantitative growth kinetics (QGK). It relates the time taken for the turbidity of a microbiological culture in a well of a 96-well microplate to reach a threshold difference in turbidity to a 10-fold dilution series, conducted as a separate calibration experiment (Figure 1A). Quantification of the number of viable cells follows an algorithm mathematically identical to quantitative real-time polymerase chain reaction (QPCR) (Heid et al., 1996), except that with QGK the cells, rather than copies of PCR products, grow exponentially. The time taken to reach the threshold is called the “threshold time“, Tt, which is equivalent to the QPCR value “cycle time” or Ct. While the calibration curve linear regression R2 values were often >0.999 (Figure 1B), scatter below a ΔOD650 of 0.01 (Figure 1A, green, lavender and blue points and circles) suggested the presence of bacterial clumps. Gram stains (Gram, 1884) of both TSB and MHB cultures revealed far fewer clumps than expected, given that a broad size distribution should accompany the intermediate steps leading to macroscopic clumps. Apparently, most clumps were not retained on the glass during the Gram stain procedure, whether fixed to the slide by heat or methanol. The application of lactophenol cotton blue, ordinarily used to visualize fungi by staining cell wall polysaccharides such as chitin, revealed circles and rings consistent with the caramelized residue of polysaccharides, which presumably included capsular polysaccharides and slime secreted concomitantly with clump and biofilm formation. These indigo circles and rings could be consistent either with a heterogeneous subpopulation of E. coli or with slight contamination with a second strain.
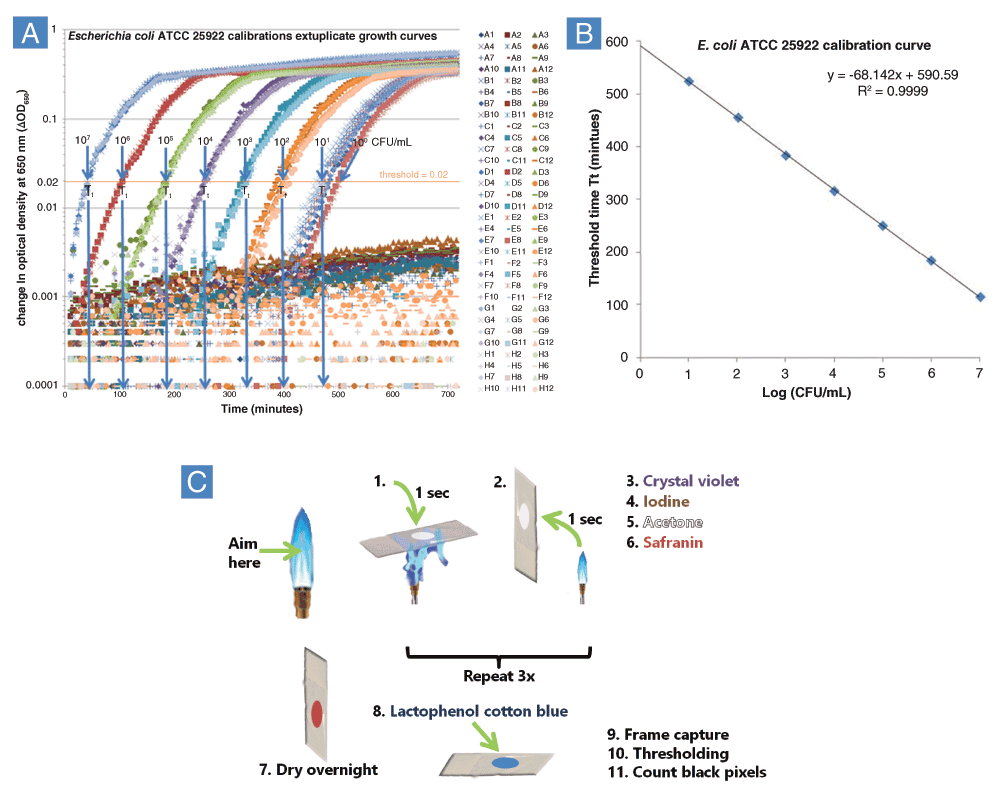
A: Escherichia coli ATCC 25922 was diluted 10-fold in Mueller-Hinton Broth and growth kinetics was monitored for 12h using a Tecan infinite M1000 plate reader according to the UMB procedure (Ericksen et al., 2005). QGK was used to calculate threshold times, Tt. B: Calibration curve relating Tt to the logarithm of cell concentration in a separate experiment. Both experiments shown in A and B were conducted in November, 2011 by Le Zhao. C: Lactophenol Cotton Blue Gram Stain Procedure. Overnight steps allowed for equilibration to the ambient humidity during summer months in the IHV building at UMB, which ranged from 40–60%. Water content and temperature may be important factors for the caramelization process to be quantitatively reproducible.
The VCC assay was conducted using the 36 edge wells to detect contamination as originally described (Ericksen et al., 2005), except a rectangular piece of Parafilm M (6 × 0.25 squares) was wrapped around the 96-well plate before the start of the 2-hour and 12-hour plate reader runs. Parafilm strips remained almost entirely intact and in place throughout the 12-hour run at 37°C and resulted in the complete absence of dust large enough to be visible using an Olympus 8Z61 crystallographic microscope on the ledge between the 96 wells and the edge of the plate, except for a single speck in one experiment observed near a crack in the Parafilm. Parafilm also prevented the visible decrease in edge well volume due to evaporation that originally necessitated excluding these wells from the experimental portion of the assay (Ericksen et al., 2005). 10 µL samples of edge wells were added to droplets of sterile water or media and spread on Mueller Hinton Agar, Tryptic Soy Agar, and Sabouraud’s Agar plates. Colonies were analyzed by morphology, wet mounts, Gram stains, and biochemical analysis using Becton Dickinson Enteropluri Product Number 261185.
Glass slides were scrubbed with PCMX hand soap using a pipe cleaner. 10 µL of cells sampled from 96-well plates after VCC assays using twice-concentrated MHB in the outgrowth step were added to the slides and equilibrated to ambient humidity overnight. The slides were heat-fixed by placing the sample at the point in space at the upper tip of the inner blue flame of a Bunsen burner three times for one second each, removing the slide for one second in between (Figure 1C). Ambient relative humidity was 40–60%. The slides were stained with Fluka Analytical Gram Staining Kit Product Number 77730 and again equilibrated to ambient humidity overnight in a vertical position. Becton Dickinson Lactophenol Cotton Blue Stain Droppers Product Number 261188 were applied to the Gram stained sample and digital images were captured using an Amscope light microscope at 160×, 400× and 1600× magnification and Toupview software. The Adobe Photoshop thresholding function was applied to the 400× digital images using a threshold of 100. Black pixels were enumerated using the histogram function.
Macroscopic clumps were observed in 25 mL TSB batch cultures of E. coli ATCC® 25922™ grown at 37°C in early exponential phase to an expected optical density at 650 nm (OD650) of approximately 0.3. A 1 mL uncovered sample placed in a cuvette and cooled to room temperature rapidly formed small macroscopic clumps (up to about 1 mm in diameter), some of which exhibited motility, swimming in a synchronized wave downward to form a single large macroscopic clump (up to 1 cm long, equal to the cuvette width) at the base of the cuvette. OD650 plummeted up to 2% per minute, reaching equilibrium after a 10–20% decrease when placed in a room temperature HPLC detector, as cells in suspension joined the clump beneath the light path. The optical density readings declined so rapidly that only the first two digits of the four reported by the Waters 600 detector could be recorded. Macroscopic clumping in the batch culture or cuvette outside the detector was no longer observed after four changes: 1. using a small HEPA-filtered air purifier, 2. replacing in-house deionized Milli-Q water with purchased molecular biology grade water, 3. replacing 2×MHB prepared and autoclaved in-house using reusable jars with Teknova 2× cation-adjusted MHB, and 4. filter-sterilizing phosphate buffers made near the portable air purifier, rather than autoclaving in reusable jars. Even after these measures, uncovered 1 mL samples placed in the detector for 2 hours formed a macroscopic clump at the base of the cuvette accompanied by a decrease in optical density, suggesting that at least one clumping environmental factor (CEF) was concentrated by the fan and filter within detector acting as a dust trap. Thus, 1 mL samples of E. coli ATCC® 25922™ served as biosensors for CEFs, and the detector served as a biosensor positive control. Corner-seeking motility of E. coli ATCC® 25922™ was also observed on MH agar plates wrapped in Parafilm and incubated at room temperature for 2–3 weeks, as indicated by the formation of a ~1 cm-wide confluent ring around the entire edge of the plate, even though confluent areas and single colonies that originally appeared after 1–2 days were separate from the edge. The UMB VCC procedure was sensitive to cross-contamination in the 36 un-inoculated edge wells, possibly indicating that clumping affects the particle size distribution and adhesive properties of the cells, which in turn promotes aerosol formation during pipetting. Figure 2 depicts cells sampled from a cross-contaminated edge well after storage at 4°C. The UCLA VCC method, with cells in 10 µL pipetted beneath 90 µL rather than a 50 µL suspension added to 50 µL as droplets from above, (Welkos et al., 2011) minimizes the probability of cross-contamination and is a safer and more effective method of transferring bacteria such as the hazardous BSL-3 pathogen Bacillus anthracis (Ericksen, 2014).
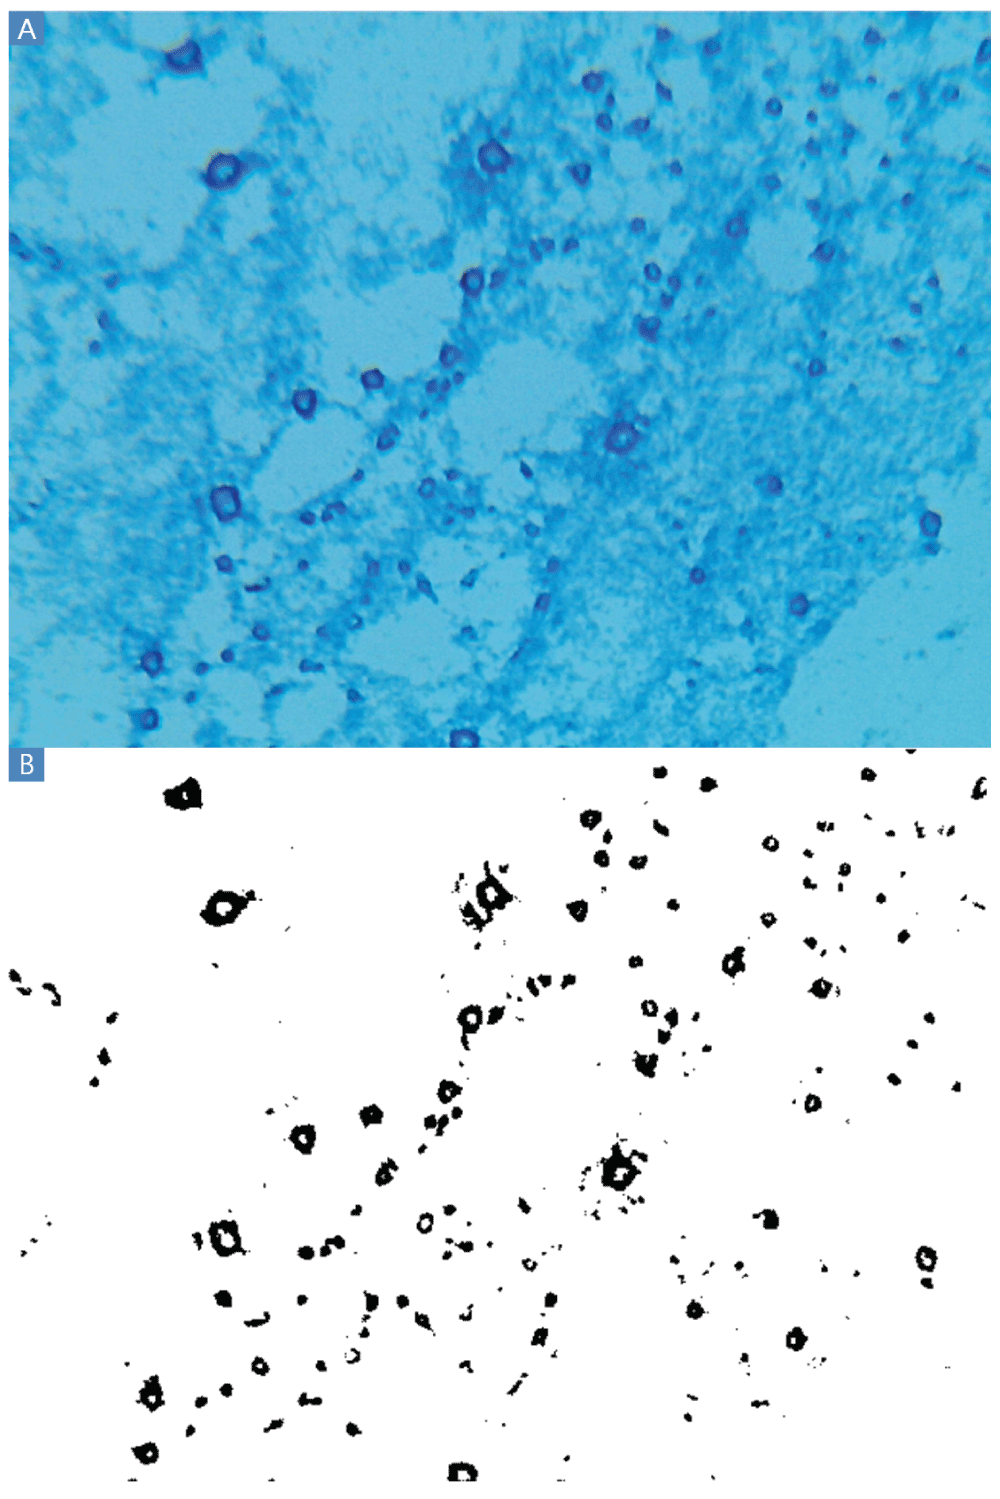
A: Blue rings indicate the polysaccharide residue of clumps of cells presumably washed from the slides during the Gram stain procedure. These polysaccharides were invisible when inspected after Gram staining and before application of lactophenol cotton blue. Other experiments produced smaller dark blue circles rather than rings. B: Thresholding results. A large majority of black pixels are contained within the polysaccharide rings. The VCC experiments resulting in cross-contamination and Escherichia coli ATCC 25922 clumps with dark blue BGS staining were conducted by author BE in the summer of 2013 at UMB.
The lactophenol cotton blue Gram stain (BGS) revealed ubiquitous circular or ring-shaped structures that stained dark blue (Figure 2A). All cells stained light blue because all cells are glycosylated to some degree. Rare regions of indistinct blue staining were also observed, probably resulting from starch and other polysaccharides present in Mueller Hinton Broth. Carbohydrates, possibly including Maillard reaction (Maillard, 1912) and caramelization products, adhered to the glass in the intense heat of the fixation steps and endured on the slide throughout the Gram stain procedure. These polysaccharide residues had been invisible when these same slides were observed after Gram staining and before application of lactophenol cotton blue. Accompanying the processes of adhesion, cohesion and biofilm formation, cells secrete complex polysaccharides and concentrate nutrients such as starch from the media. The intensity of dark blue staining suggests copious capsule and slime formation.
Applying the thresholding technique using a threshold of 100 differentiated the dark from the light staining with little apparent background noise (Figure 2B). Thresholding of BGS images captured at 160× and 1600× magnification (Figure 3) are also possible using the Amscope microscope. However, pixelation could add imprecision at 160× and the large size of clumps would increase variability from field to field at 1600×. TSB or MHB cultures of E. coli ATCC® 43827™ (ML-35) produced no macroscopic clumps under any conditions in several experiments conducted in 2013 and 2014.
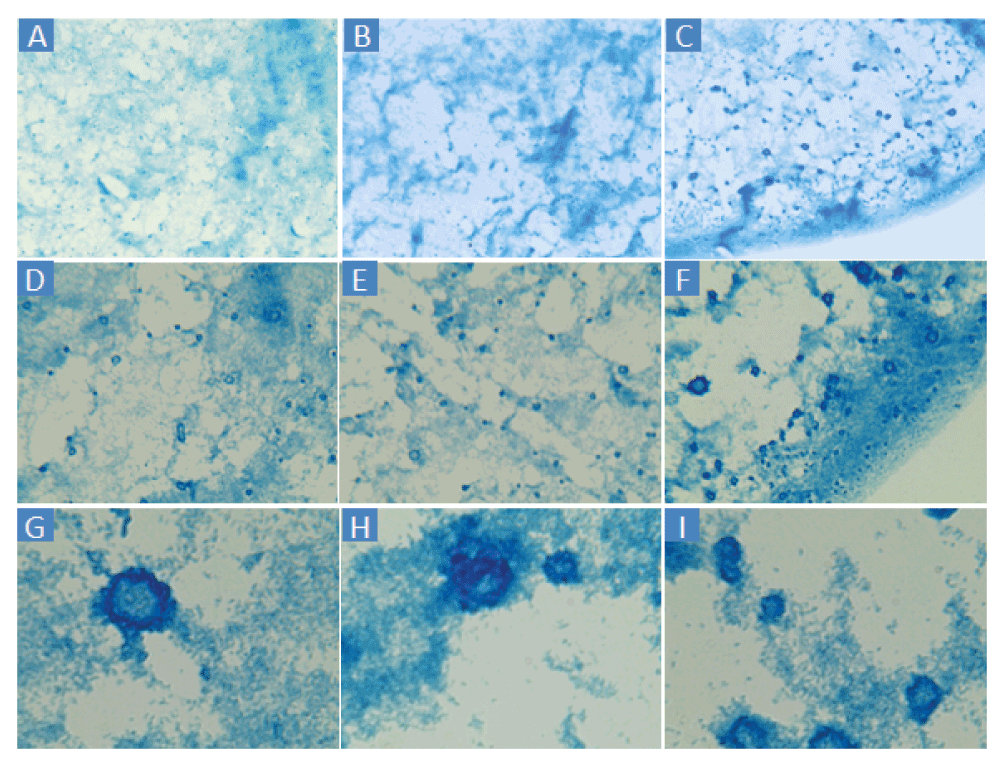
A–C: 160×. D–F: 400×. G–I: 1600×. Cells were sampled from the edge wells of a different virtual colony count experiment than Figure 2.
The history of hundreds of VCC experiments at UMB between 2003 and 2014 clearly shows that edge wells are almost always clear, not turbid, after the 12h outgrowth phase of VCC experiments. Therefore, Pantoea agglomerans, were it is the sole CEF present in the laboratory environment, must be almost always non-viable in TSB or MHB under the conditions studied at UMB. The inability to grow in these two non-selective media would be surprising, given that ATCC recommends rich media (nutrient broth) for the type strain P. agglomerans ATCC® 33243™.
In a 1-month period in August and September 2013, I conducted 13 quadruplicate calibration experiments using the same pipetting technique as the sextuplicate calibration experiments in the original VCC publication (Ericksen et al., 2005). However, in the 2013 experiments, four, rather than six, calibration curves were confined to 32 internal wells (C3-F10). These experiments used the rich media MHB, TSB or slight variations thereof. The external 64 wells (rows A, B, G and H and columns 1, 2, 11 and 12) contained two rings of contamination control wells rather than the single ring of 36 wells originally used. In these experiments conducted just outside a biosafety cabinet used for VCC experiments, none of the 832 contamination control wells turned turbid after the 12h incubation. These experiments strongly suggest that CEFs present in the laboratory environment are overwhelmingly non-culturable in rich media such as MHB or TSB, and the numerous indigo circles and rings revealed by BGS cannot be explained only by direct contamination by P. agglomerans or some other viable CEF. If P. agglomerans were responsible for all cross-contamination in VCC assays, it must have exerted its influence in co-culture with E. coli cells that inoculated those wells as aerosols. It is more likely that P. agglomerans is merely one possible CEF among many. In addition to viable contamination, unculturable bacteria could exert an influence upon rapidly growing E. coli cells. Furthermore, nucleic acids are known to cause cells to coalesce into clumps over a broad size distribution in both bacterial and mammalian cell culture. Airborne CEFs smaller than a bacterial cell could pass through the HEPA filters with little or no resistance, meaning that these molecules could have affected experiments conducted both inside and outside biosafety cabinets. Measures such as trypsinization, treatment with other proteases, and treatment with nucleases such as benzonase are commonly employed to reduce or eliminate clumping (Kruse & Patterson, 1973). For the same purpose, shear was employed in VCC calibration curves by placing pipette tips in contact with the cross-sectional corner of each well when pipetting up and down 15 times to mix, although growth curves showed evidence of clumps large enough to produce measurable differences in optical density that preceded exponential growth (Figure 1A, region between a change in optical density of 0.001 and 0.01).
CEFs that are ordinarily nonviable, or that produce robust growth only in co-culture or under certain environmental conditions, would not always be detectable using VCC contamination control wells containing rich media such as MHB. One putative CEF isolated in these experiments is P. agglomerans, identified as a contaminant of an edge well in a VCC experiment using Enteropluri (Table 1). Because a monoculture of P. agglomerans could not possibly have explained the ubiquitous macroscopic clumping observed in TSB cultures of E. coli, one possible explanation of these results is that a small inoculum of P. agglomerans is sensed by E. coli in a contaminated co-culture, causing the E. coli majority in the mixed population to coalesce. P. agglomerans was named based upon its propensity to agglomerate and form biofilm-like aggregates called symplasmata (Li et al., 2012), which typically contain on the order of hundreds of cells or fewer. However, our experience over a decade demonstrates that biofilms and clumps visible to the unaided eye containing at least 104–105 cells often form in the laboratory environment, resulting from cultures of Bacillus cereus, Pseudomonas aeruginosa and Candida albicans as well as E. coli in the absence of antimicrobial agents. Macroscopic microcolonies of Staphylococcus aureus also commonly formed within 96-well plates when exposed to antimicrobial agents such as the defensin HNP1. In many cases, lyophilized stocks of the same strain were ordered repeatedly with the same results, indicating that clumping was the result of persistent conditions in the laboratory environment rather than contamination originating from the manufacturer. The presence of macroscopic clumps demonstrates that CEFs cause clumps over a size range from microns to millimeters. However, all clumps revealed by the BGS are small enough to have arisen from the polysaccharide residues left by symplasmata adhering to the glass during the heat fixation step but washed off afterward. P. agglomerans is a triple auxotroph that must catabolize the cationic amino acids lysine, ornithine and arginine from an environmental source (Winn et al., 2006). E. coli might sense dissolved solid nutrients directly, or P. agglomerans indirectly, so that it can quickly join in the feeding frenzy. This phenomenon would explain the observed downward swimming of motile clumps visible to the unaided eye in 1 mL cuvettes causing a rapid 10–20% decrease in optical density readings. Perhaps these phenomena were observed first in a defensin laboratory because flakes of lyophilized powder weighed on balances in the open laboratory environment collected within the filters of laboratory equipment acting as dust traps, degrading the filters themselves and bursting through intermittently. For example, the failure of the intake air filter was visible within the Tecan Infinite M1000 plate reader, resulting in white fragments large enough to be visible to the unaided eye as specks or smears in the corners of the 96-well plates. If indeed symplasma formation explains dark blue staining, the ring-shaped structures could have arisen as P. agglomerans or another environmental contaminant formed a carbohydrate-rich biofilm surrounding solids suspended in batch cultures. E. coli might also form such structures in monocultures, although the absence of reports of such behavior by this commonly used quality control strain over the past decades would suggest that the BGS results reported here are the product of unusual environmental factors. Further experiments that control for air quality will be necessary in order to distinguish between these possibilities.
The presence of polysaccharides associated with E. coli ATCC® 25922™ cohesion suggests that in the conditions studied at UMB, this strain employs clumping as a defense mechanism in response to the presence of one or more CEF. Forming a clump surrounded by polysaccharides could contribute to resistance to antimicrobial lectins such as defensins (Wang et al., 2003) that would be bound and inhibited at the surface, limiting further inward diffusion and protecting persister cells (Ericksen et al., 2005) at the center of the clump. These survivors could contribute to the deviation from simple exponential killing (Luria & Latarjet, 1947) observed throughout all VCC studies at UMB of defensin activity against E. coli. MHB contains a considerable amount (1.5 g/L) of added starch. Polysaccharides in rich media could contribute to the complete inhibition of antimicrobial peptides, which is essential for VCC assays to be capable of enumerating surviving bacteria by the QGK data analysis method. Qualitative defensin lectin activity generally follows the hierarchy: glycosylated proteins > branched polysaccharides > linear polysaccharides > oligosaccharides > monosaccharides. (Lehrer, R. I., personal communication) Bacterial slime and capsules are highly branched and contain glycosylated proteins (Wilkinson, 1958). If inhibition follows the same qualitative pattern as binding, bacterial capsular polysaccharides would be potent defensin inhibitors. Clump, biofilm and capsule formation may have evolved partially as resistance mechanisms to the ancient selection pressure exerted throughout the tree of life by antimicrobial peptides in the environment.
A possible consequence of the inhibition of defensins by polysaccharides could be that therapies with lectin antimicrobial peptides as active ingredients would not be effective against clumps or biofilms in the absence of at least one other active ingredient that degrades the polysaccharide capsule, such as a glycosidase. Because polysaccharide structures in capsules and slime vary widely, as do glycosidase substrate specificities, any given enzyme might be active against only a narrow range of bacteria. Activity against a broad spectrum of pathogenic bacteria would therefore require an enzyme cocktail of glycosidases accompanying the lectin antimicrobial peptide or a glycosidase with unusually promiscuous substrate specificity. Amazingly, filter degradation within the laboratory suggests that defensin slurries hydrated by condensation might themselves act like just such a glycosidase, hydrolyzing polymers near room temperature. However, at present such slurry could only qualify as hydrolase-like, not a true hydrolase, because it has not yet been investigated whether the defensins themselves are destroyed in the catalytic process. These observations of airborne environmental contamination suggest dual mechanisms of defensin activity at different orders of defensin concentration. Defensins are present above 10 mM in the granules of the neutrophil. At these high concentrations, they may be capable of hydrolyzing their way through biofilms and capsular polysaccharides, disrupting clumps and thwarting this mechanism of resistance. Helper glycosidase activity naturally present in vivo could enhance efficacy against the high cell concentrations, clumps and biofilms that typically accompany acute infections and would be expected to stain indigo by the BGS method. In addition, as they diffuse away after degranulation, concentrations of defensins up to a 1000-fold lower would still be capable of bactericidal activity against planktonic cells containing glycosidation but not large amounts of capsular polysaccharides. These low levels of glycosylation would correspond to light blue BGS staining.
The disruption of laboratory airflow by biosafety cabinets and other equipment that propel large amounts of air at high velocity through filters should be considered, especially in areas where chemicals are lyophilized and weighed. Rethinking the design of research laboratories to account for effects of air quality, airborne particulate contaminants and airflow on experimentation would benefit the results or assays in the presence of CEFs. Controls to ensure the efficacy of methods to alleviate clumping, such as physical methods employed by the VCC calibration experiment pipetting technique or methods using enzymes such as trypsin or benzonase, could be supplemented by the inspection of bacterial or mammalian cell cultures using light microscopy and staining techniques such as BGS.
figshare: Blue Gram Stain images from three cross-contamination edge wells of a Virtual Colony Count assay at 160x, 400x, or 1600x, doi: http://dx.doi.org/10.6084/m9.figshare.1269193 (Ericksen, 2014).
| Views | Downloads | |
|---|---|---|
| F1000Research | - | - |
|
PubMed Central
Data from PMC are received and updated monthly.
|
- | - |
Provide sufficient details of any financial or non-financial competing interests to enable users to assess whether your comments might lead a reasonable person to question your impartiality. Consider the following examples, but note that this is not an exhaustive list:
Sign up for content alerts and receive a weekly or monthly email with all newly published articles
Already registered? Sign in
The email address should be the one you originally registered with F1000.
You registered with F1000 via Google, so we cannot reset your password.
To sign in, please click here.
If you still need help with your Google account password, please click here.
You registered with F1000 via Facebook, so we cannot reset your password.
To sign in, please click here.
If you still need help with your Facebook account password, please click here.
If your email address is registered with us, we will email you instructions to reset your password.
If you think you should have received this email but it has not arrived, please check your spam filters and/or contact for further assistance.
Comments on this article Comments (0)