Keywords
Contact rate, Immunological memory, Mathematical model, Eigenvalue Stability point
This article is included in the Bioinformatics gateway.
This article is included in the World TB Day collection.
Contact rate, Immunological memory, Mathematical model, Eigenvalue Stability point
Tuberculosis (TB) transmission results from air exchange between infective sources and susceptible individuals within enabling environments. Enabling environments are frequently poorly ventilated congregate settings, such as households, public transport, schools, and work places, resulting in high effective contact rate between infectious and susceptible individuals1,2.
Effective contact number is determined by the effective contact rate and the mean period of infectiousness of source cases. Progression from TB infection to disease depends on the interaction between the immunological state of the host and the virulence of the pathogen strain3. TB disease may arise either early or late following a new infection and also from reinfection of previously infected cases. Substantial epidemiological evidence suggests that reinfection is among the factors hampering successful TB control4,5 and is a major contributor to active disease in both high and low TB burden settings6.
Individuals treated with combination chemotherapy for active disease have high rates of re-treatment, due to both reactivation and reinfection, and contribute 30% of total TB notifications in high burdened settings7. Treated TB cases therefore constitute an attractive target for vaccine studies because of a high new TB event frequency and ease of identification. Two recent studies of TB vaccines are currently exploring a novel strategy of vaccination in individuals who have had successfully treated active TB8,9. However, the biological mechanisms for high rates of re-treatment and the immune status following successful treatment remain unclear.
This paper describes a mathematical model that incorporates susceptible, newly infected, reinfected, active TB and treated individuals to study the population impact of effective contact rate and post-treatment immune status on TB epidemiology. An infectious individual with varying effective contact rate (ranging from 5 to 30 y r–1) was introduced among 100, 000 fully susceptible individuals and we observed the number of individuals in all five states at stability point of a TB epidemic. This range of effective contact rate was selected because β = 5−10 y r–1 is related to TB transmission in the United Kingdom in 1900 − 19504, β = 15 y r–1 is related to TB transmission in schools in South Africa2, and β = 30 y r–1 is related to TB transmission in prisons in South Africa10. Here, we explore the population impact of effective contact rate by comparing the number of newly infected and that of reinfected individuals at stability point of a TB epidemic, with increasing effective contact rate. The study was divided into three parts and simulated the model numerically when all treated individuals move to: (i) susceptible (ii) newly infected or (iii) reinfected state, and we observed the number of individuals in all five states. We explore the population impact of post-treatment immune status by comparing the number of active TB cases when all treated individuals move to either a susceptible, newly infected or reinfected state with increasing effective contact rate. This is an important study population as the incidence of TB can be higher in people recently cured of the disease. We compute the basic reproduction number and eigenvalues from the model when treated individuals move to all three states of susceptible, newly infected and reinfected to examine the stability of the disease free equilibrium.
The model consists of five states of susceptible individuals (S) who are not yet infected, but at a high risk of acquiring TB infection or disease if exposed to an infectious individual(s); newly infected individuals (L1) who have been infected once in their lifetime with Mycobacterium tuberculosis (MTB) and if exposed, they move to either reinfected or active TB state through exogenous reinfection, depending on the host immune response and virulence of the pathogen strain; reinfected individuals (L2) who have been infected multiple times with MTB of either the same or different strains and remain latently infected or move to active TB state through endogenous reactivation; active TB individuals (I) who are infectious and can transmit TB; treated or recovered individuals (T) who were previously infectious and were cured by chemotherapy, though some are still on treatment. Note that the difference between newly infected and reinfected individuals is that newly infected individuals are latently infected who have been infected once in lifetime with MTB and they can develop active disease through either exogenous reinfection or endogenous reactivation, while reinfected individuals are latently infected individuals who are multiply infected with MTB of either the same or different virulent strains and they can only develop active disease through endogenous reactivation or remain latently reinfected, depending on the virulence of the pathogen strain and immune response of the host.
The design and development of the model was based on an actual population in Cape Town, South Africa11, where many already infected individuals are repeatedly exposed to different infectious sources and become reinfected, and start treatment after acquiring TB disease11.
Furthermore, since natural MTB infection and chemotherapy induce an immune response that reduces TB susceptibility12, we take into consideration the fact that treated individuals move to either a newly infected or reinfected state if they maintain immunological memory after successful treatment, and if they become susceptible due to waning of the immune response, they move to a susceptible state. This is because the average duration for the waning of induced immune response by MTB and chemotherapy is not well understood. However, if treatment fails or is not completed, they can move back to active disease and become infectious. As it has been reported that TB disease incidence in TB treated individuals is several-fold higher than in latently infected13, we explored post-treatment cases returning to either the susceptible, newly infected or reinfected immunological state. This approach makes our model unique and different from the prior studies, which apply infection force for treated individuals moving to latent TB states without considering immunological memory of the host. In order to explore the population impact of effective contact rate and post treatment immune status on TB epidemiology in high TB burden settings, such as Cape Town, the model includes human immunodeficiency virus (HIV) infection, but it does not incorporate: (i) age stratification or (ii) multi-drug resistant TB (MDR-TB).
In the development of the model, we assume that the population consists of fully susceptible individuals, hence, the number of births or recruitment individuals become susceptibles at a rate π y r–1. When susceptible individuals become infected with MTB, a proportion p in this group develop active TB very fast and it’s complement proportion 1−p, which constitute the majority become latently infected and move to a newly infected state depending on the virulent strains of the pathogen and host immunological factors. Newly infected individuals are at a high risk of developing active disease through either endogenous reactivation or exogenous reinfection. Here, we take into consideration that one group of newly infected individuals develop active TB slowly through endogenous reactivation at a rate c y r–1, and a fraction q of the second group of newly infected individuals develop active TB very fast after infection through exogenous reinfection, while a remaining fraction 1-q of this group move to a reinfected state. Reinfected individuals develop active TB through endogenous reactivation either fast or slowly at a rate y y r–1, depending on the immunological state of the host and the virulent strains of the infecting pathogen. Individuals with active TB receive medical treatment and move to a treated state at a rate k, while some die of active TB at a rate µt y r–1. Treated and successfully cured individuals may become susceptible and move to a susceptible state at a rate r or retain immunological memory and move to either a newly infected at a rate g or a reinfected state at a rate z y r–1, without exposure to the force of infection14. This is because latently infected and treated individuals acquire an immune response that reduces TB susceptibility though it may wane and individuals become susceptible. As mentioned earlier, we only implement treatment for active TB cases because in the real world, many TB patients only start treatment after active disease development. However, if TB cases are not well treated, treatment fails or chemotherapy is incomplete, they incubate the infection and relapse back to active TB at a rate α y r–1. As stated earlier. it has been noted that latently infected individuals acquire immunity that reduces TB susceptibility5,15, though they can be (re)infected and develop active disease if they become frequently exposed to infectious individuals in confined spaces. Thus, ω(0 < ω < 1) is the preventive factor due to prior natural MTB infection, which partially prevents latently infected individuals from TB susceptibility5. In each of the five states, there is a natural mortality rate µ y r–1 as demonstrated in Figure 1.
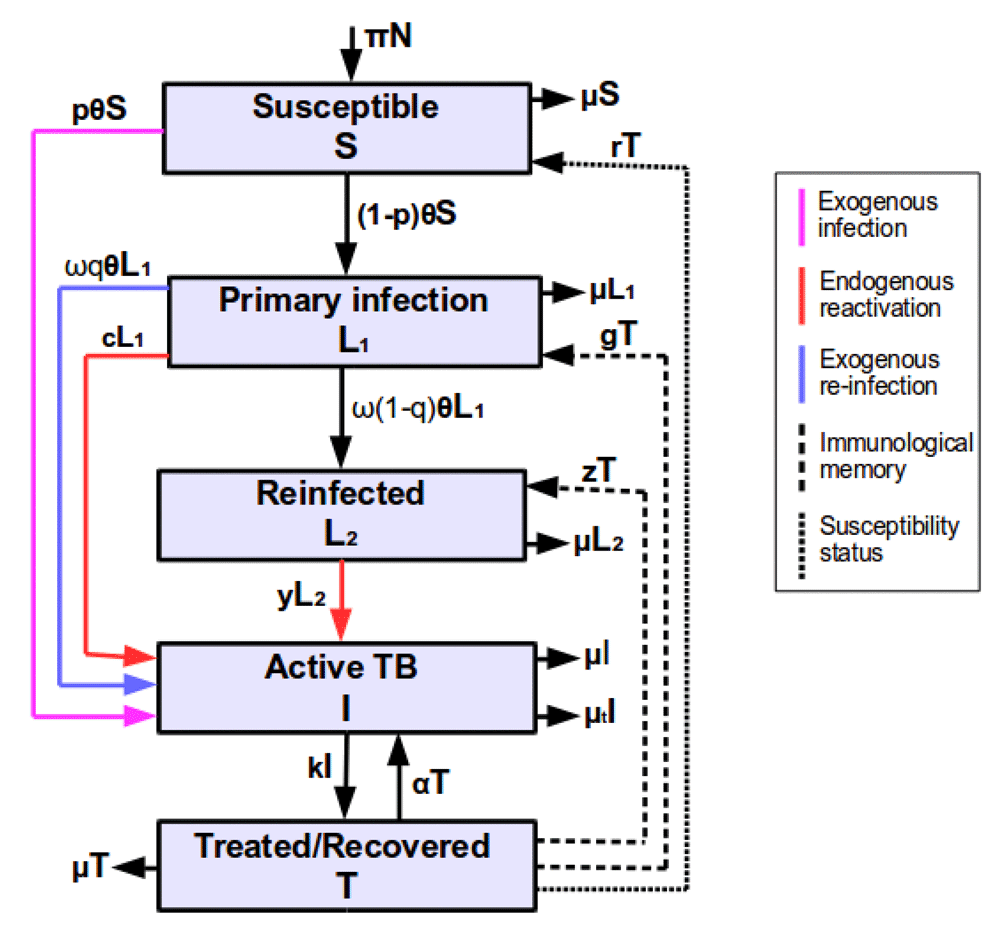
Parameters are described in Table 1.
From the model (Figure 1), we developed a mathematical model as follows:
where which is the force of infection, β is the effective contact rate, is the prevalence, I is the number of infectious individuals and N is the total number of individuals in the population. Other parameters are described in Table 1.
Disease free equilibrium is defined as the point at which there is no existence of the disease in the population. By computing S, L1, L2, I and T at disease free equilibrium (i.e., L1 = L2 = I = T = 0) and assuming that birth rate is equal to death rate, we obtain the disease free equilibrium point as = (N, 0, 0, 0, 0). This implies that at disease free equilibrium, the total number of individuals in the population is equal to that of susceptible individuals, such that N = S. However, during an epidemic of active disease at any time, t, we have N(t) = S(t)+L1(t)+L2(t)+I(t)+T(t), implying that the population is comprised of all five states and disease free equilibrium might be unstable. The model is epidemiologically balanced. From the mathematical model (Equation 1), we compute the basic reproduction number to determine the stability of the disease free equilibrium as discussed below.
The values of parameters used in this study were estimated from published literature. We also computed and estimated other values by matching infection and incidence data in South Africa.
| Parameter | Description | Values | Reference |
|---|---|---|---|
| β | Effective contact rate | 5 − 30 yr−1 | estimated |
| p | Probability of fast progression from susceptible to active TB after infection | 0.05 | 16,17 |
| c | Rate of progression from newly infected to active TB through endogenous reactivation | 0.0026 yr−1 | 16,17 |
| q | Probability of moving from newly infected to active TB through exogenous reinfection | 0.03 | 6 |
| y | Rate of endogenous reactivation from reinfected to active TB | 0.0053 yr−1 | 16,17 |
| r | Rate of moving from treated to susceptible state | Variable (0 or 0.99) | Depends on the immunological status |
| π | Birth or recruitment rate | 0.02 yr−1 | 18 |
| g | Rate of moving from treated to a newly infected state | Variable (0 or 0.99) | Depends on the immunological status |
| ω | Preventive factor that reduces TB susceptibility due to prior natural MTB infection | 0.21 | 8 |
| z | Rate of moving from treated to a reinfected state | Variable (0 or 0.99) | Depends on the immunological status |
| k | Case detection rate from active TB to treated state | 0.68 yr−1 | 19 |
| α | Rate of treatment failure and move to active TB | 0.01 yr−1 | 16 |
| µ | Natural mortality rate | 0.02 yr−1 | 6 |
| µt | Active TB mortality rate | 0.075 yr−1 | 19 |
Computed values: In the design of the model (Figure 1), we take into consideration that treated or recovered individuals may become either susceptible or immune, depending on the host immunological status. Thus, successful treatment to either g, r or z = 1 - treatment failure (α).
Basic reproduction number (Ro) is the average number of secondary cases generated by a single case connected with the fully susceptible population16,20,21. We use the next generation method to determine the basic reproduction number, which is an important figure in the epidemiology of infectious diseases. It is among the most frequently estimated quantities to predict the outbreak of infectious diseases, and its value provides information for designing control interventions for the infectious disease burden16,21. Ro thus plays an important role in the analysis of infectious disease models, such as TB17. If Ro < 1, the disease free equilibrium is asymptotically stable, and it is unstable if Ro > 116,20,21.
The next generation method is used extensively to compute the basic reproduction number, though numerous other methods are discussed in the literature21. It generates a next generation matrix, and the basic reproduction number is the spectral radius of this matrix. The next generation matrix is defined as a matrix that relates the numbers of newly infected individuals in the various states in consecutive generations21. The dominant eigenvalue in a next generation matrix is referred to as the basic reproduction number. The next generation matrix (M) is defined mathematically as
and the basic reproduction number is the dominant eigenvalue of M. Where F and V are the transmission and transition matrices (n × n matrix) at disease free equilibrium, respectively. These are defined mathematically as
where xo is the disease free equilibrium, fi is the rate of appearance of the new infection in classes, vi is the transfer of the infection from one class to another and n is the number of infective classes.
However, prior to the formation of the next generation matrix, we generate the transmission (f) and transition (v) subsystems from Equation (1). We then linearise subsystems f and v by applying the Jacobian (Jc) and obtain matrices F(S, L1, L2, I, T) and V(S, L1, L2, I, T), which are n × n transmission and transition matrices, respectively. The transmission subsystem is an infected subsystem that describes the production of newly infected individuals and changes in the states of existing infected individuals. The transition subsystem is the transfer of the infection from one class to another. On the other hand, the transmission matrix describes the production of new infections, and the transition matrix describes changes of infected states, such as the immunity acquisition or removal by death21. Considering Equation (1), the Jacobian method that is used to linearise subsystems f and v is described mathematically as
Hence, from Equation (1), we form the transmission, f and transition, v subsystems as
In Figure 1, there are three infected states, which are L1, L2 and I, giving a 3×3 matrix. Hence, we form the transmission matrix, F(S, L1, L2, I, T) by using Jacobian (see Equation (2)) in f for L1, L2 and I as
Substituting S, L1, L2, I and T at disease free equilibrium point = (N, 0, 0, 0, 0) into Equation (3), we obtain the transmission matrix at disease free equilibrium, F, as
By applying the Jacobian with respect to L1, L2 and I in v above, we obtain the transition matrix, V(S, L1, L2, I, T), as
Substituting disease free equilibrium point into Equation (5), we obtain the transition matrix at disease free equilibrium, V, as
Since the transition matrix consists of many variables, to be consistent we used a computational tool (Sage version 8.0; http://www.sagemath.org/) to compute the inverse. Hence the inverse of Equation (6), V−1, is demonstrated as
We obtain the next generation matrix, which is the product of F and V−1 as
Thus, the basic reproduction number, which is defined as the dominant eigenvalue in the next generation matrix, was obtained from Equation (8) as
The computed basic reproduction number has a positive real part, implying that it might be greater than 1. We further examined the stability of the disease free equilibrium by computing eigenvalues as discussed below.
Since the basic reproduction number computed in this study has a positive real part, it is likely to be greater than 1, implying that TB transmission is increasing, regardless of the implementation of medical treatment16,20,21. Here, we explore the stability of the disease free equilibrium by computing eigenvalues in Equation (1). Disease free equilibrium is stable if all eigenvalues have negative real parts, and unstable if any of the eigenvalues is positive20. Hence, applying the Jacobian in Equation (1), gives
where
The characteristic equation of the model at disease free equilibrium is expressed as
[J0–λI] = 0
where J0 is the Jacobian matrix (from the model) at disease free equilibrium, λ is the eigenvalue and I is the identity matrix.
Substituting disease free equilibrium point = (N, 0, 0, 0, 0) into Equation (9), minus the product of eigenvalue and identity matrix diagonally, we obtain the model matrix at disease free equilibrium as follows:
From Equation (10), we form the characteristic equation, [J0−λI] = 0, as
(–μ – λ)[(–c – μ – λ)(–y – μ – λ)(pβ – k – μ – μt – λ)(–r – α – z – g – μ – λ)]
–c[(–y – μ – λ)(pβ – k – μ – μt – λ)(–r – α – z – g – μ – λ)] = 0
Simplifying the characteristic equation further, gives
(–y – μ – λ)(pβ – k – μ – μt – λ)(–r – α – z – g – μ – λ)[μ(c + μ) + λ(2μ + c + λ) – c] = 0
From the simplified characteristic equation, we form the following four equations:
–(y + μ) – λ = 0 (11)
pβ – (k + μ + μt) – λ = 0 (12)
–(r + α + z + g + μ) – λ = 0 (13)
λ2 + (2μ + c)λ + μ2 + cμ – c = 0 (14)
Using Equation (11) to Equation (14), we can determine the eigenvalues that predict the stability of the disease free equilibrium. As mentioned earlier, disease free equilibrium is stable if all eigenvalues have negative real parts, and unstable if any of the eigenvalues is positive. Additionally, if one of the eigenvalues is zero then we cannot tell from stability analysis whether the disease free equilibrium is stable or unstable. Thus, considering Equation (11) to Equation (14), the eigenvalues are:
λ1 = –(y + μ) < 0
λ2 = pβ – (k + μ + μt)
λ3 = –(r + α + z + g + μ) < 0
Here, we noted that λ1 and λ3 have negative real parts, and λ2 has a positive real part if pβ > (k + µ + µt). For stability of the disease free equilibrium, we assume that λ4,5 have negative real parts (i.e., λ4 < 0 and λ5 < 0). Disease free equilibrium is stable if pβ < (k + µ + µt) and unstable if pβ > (k + µ + µt), where pβ is the effective contact rate for susceptible individuals moving directly to active disease. On the other hand, disease free equilibrium is stable if the effective contact rate for susceptible individuals moving directly to active disease is less than the summation of case detection, natural death and disease death rates. Otherwise disease free equilibrium is unstable.
Using data estimated from published literature, varying effective contact rate (ranging from β = 5 to β = 30 y r–1) and computed or estimated values by matching infection and incidence data in South Africa (Table 1), we simulated Equation (1) numerically to explore the population impact of effective contact rate and post treatment immune status on TB epidemiology. As mentioned earlier, the study was divided into three parts where we simulated the model when all treated individuals move to: (i) susceptible (i.e., z = g = 0, r = 0.99 y r–1) (ii) reinfected (i.e., r = g = 0, z = 0.99 y r–1) or (iii) newly infected state (i.e., r = z = 0, g = 0.99 y r–1). In the model simulation, we used the initial assumption that S = 100, 000, L1 = L2 = T = 0 and I = 1, implying that an infectious individual was introduced among 100, 000 fully susceptible individuals. The epidemic was observed for 700 years when β = 5 y r–1 and 200 years when β ≥ 10 y r–1 so that the TB epidemic stability point could be attained.
Here, we observed the number of individuals in all five states at stability point of a TB epidemic with increasing effective contact rate, and compared the number of newly infected and that of reinfected individuals. We also compared the number of active TB cases schematically when all treated individuals move to a susceptible, newly infected or reinfected state at stability point of a TB epidemic. We found that the number of newly infected cases increases when β = 5 to β = 10 y r–1, then decreases with increasing effective contact rate, while that of reinfected individuals increases in all values of effective contact rate (Figure 2, Figure 4 and Figure 5), implying that a large number of active TB cases might be contributed by repeatedly exposed individuals. The number of active TB individuals was increasing with increasing effective contact rate, but lower than that of newly infected and reinfected individuals. Of all five states, the number of treated individuals was noted to be the lowest, probably because treated individuals become either susceptible and move to a susceptible state or retain immunological memory and move to either a newly infected or reinfected state. We noted that as the effective contact rate increases, the number of susceptible individuals decreases dramatically with a steep slope until a stability point is attained, implying that effective contact rate is an important factor, which determines the likelihood of TB infection and disease in the community. Table 2, Table 3 and Table 4 summarise simulation results in Figure 2, Figure 4 and Figure 5, which are magnified and visualised in Figure 7, Figure 8 and Figure 9 with increasing effective contact rate, while Figure 6 compares active TB cases.
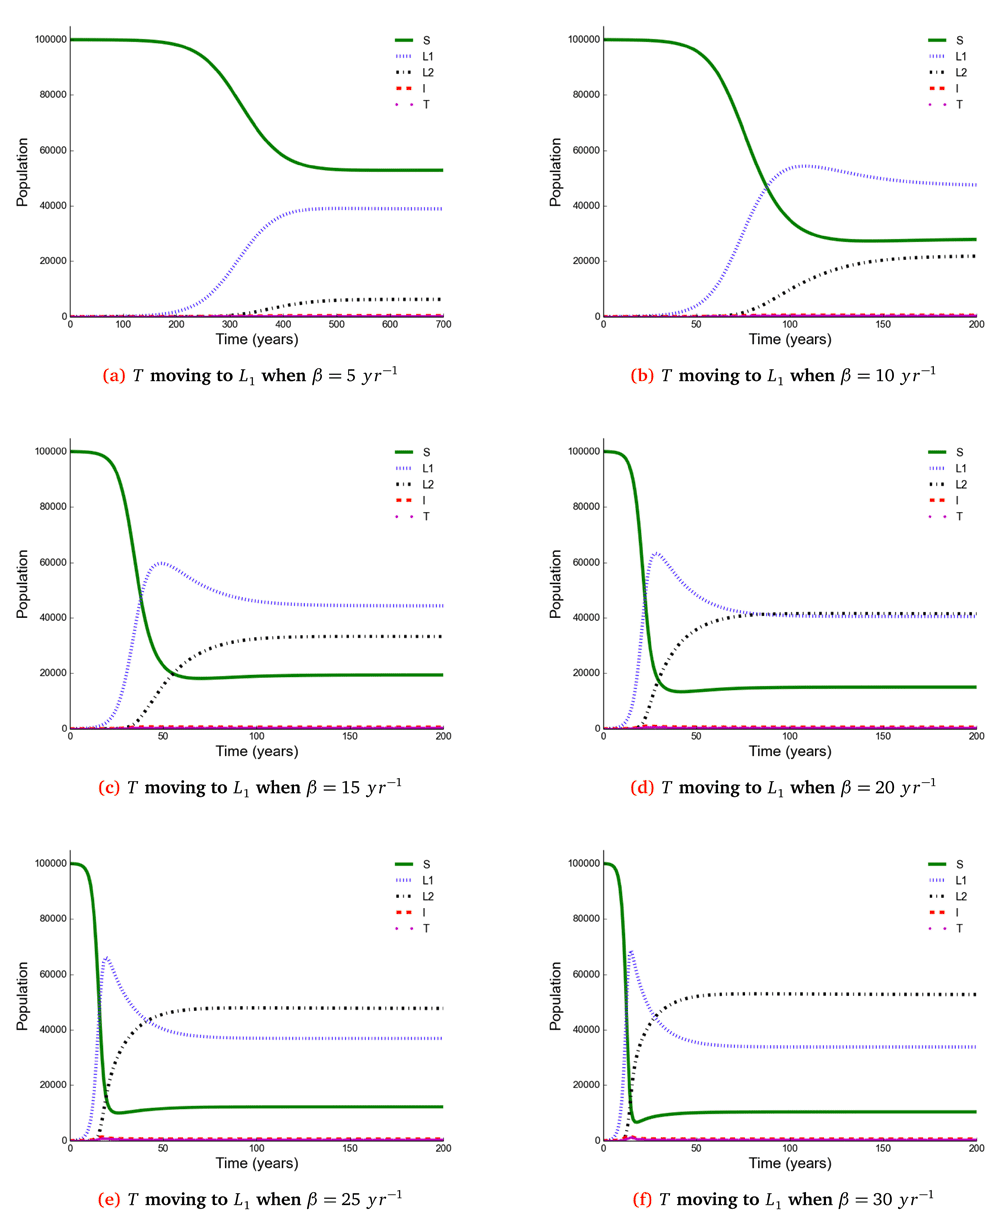
The number of individuals in all five states from β = 5 to β = 30 y r–1 at stability point of a TB epidemic are shown in Table 2. Note: S = susceptible, L1 = newly infected, L2 = reinfected, I = active TB, T = treated.
Observing the number of active TB cases when treated individuals move to a susceptible, newly infected or reinfected state, we noted the highest number of active TB cases when all treated individuals move to a susceptible state (Table 2, Table 3 and Table 4). We went on to compare the number of active TB cases schematically when treated individuals move to a susceptible, newly infected or reinfected state and found that when all treated individuals become susceptible, the number of active TB cases becomes higher than moving to either a newly infected or reinfected state (Figure 6), perhaps because individuals moving to a newly infected or reinfected state have more protection due to immunological memory retention than susceptible individuals.
We separated and compared the number of active TB cases due to new infection (new active cases) and reactivation (reactivation cases) when treated individuals move to a susceptible, newly infected and reinfected state with increasing effective contact rate. We noted that new active cases are very dependent on the effective contact rate and highest when treated individuals move to a susceptible state, while reactivation cases plateau when β > 10 y r–1 (Figure 3).
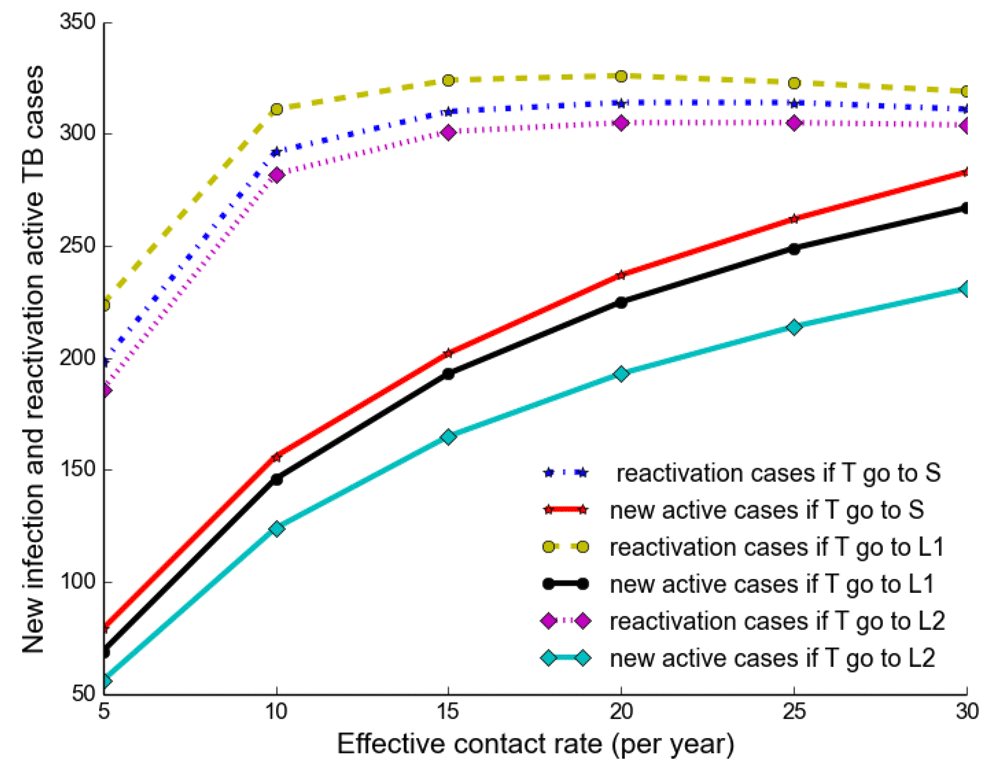
It shows that new active cases are very dependent on effective contact rate and highest when treated individuals move to a susceptible state, but reactivation cases plateau at the effective contact rate greater than 10 y r–1.
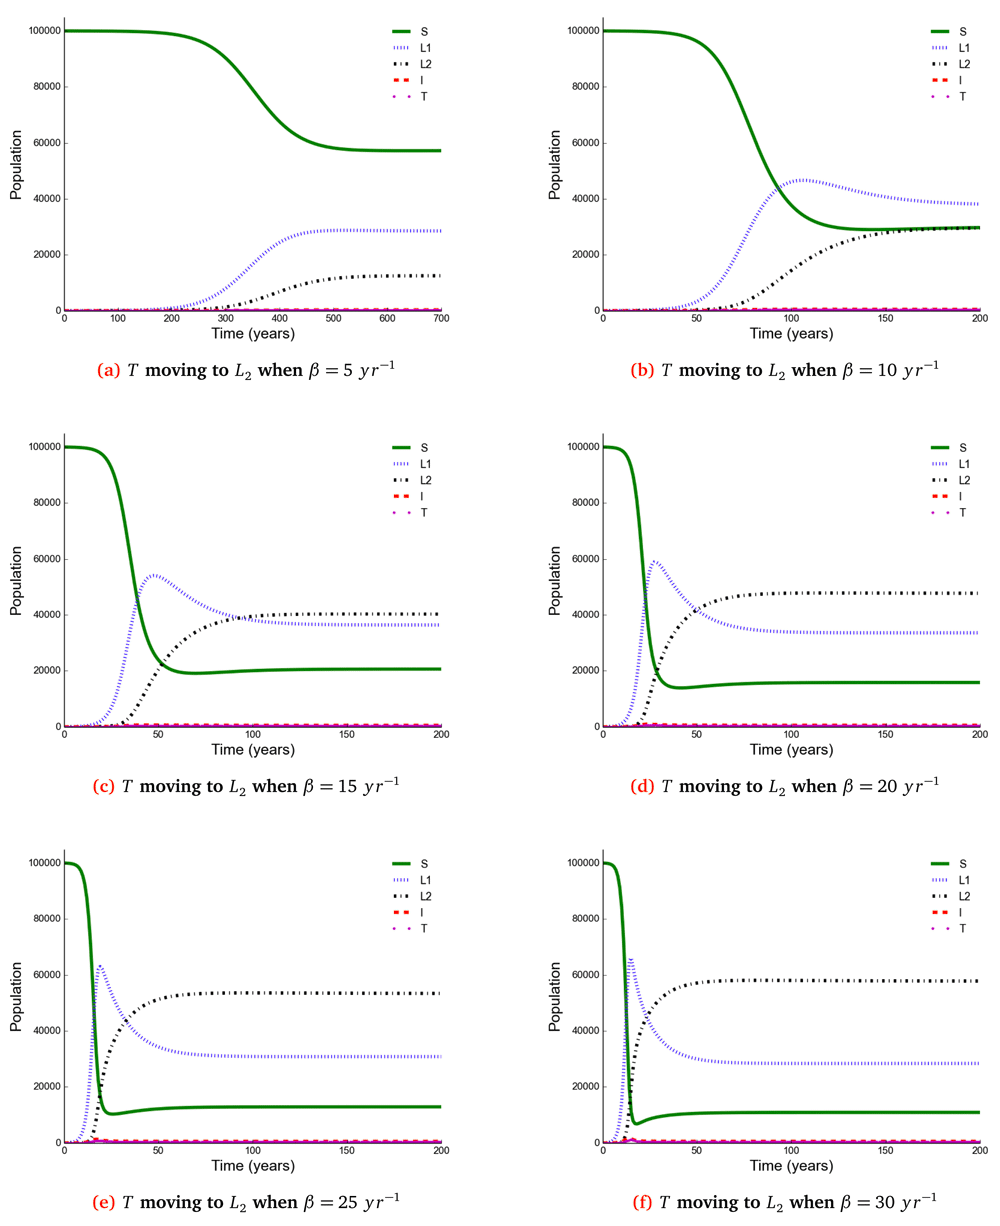
The number of individuals in all five states from β = 5 to β = 30 y r−1 at stability point of a TB epidemic are shown in Table 3. Note: S = susceptible, L1 = newly infected, L2 = reinfected, I = active TB, T = treated.
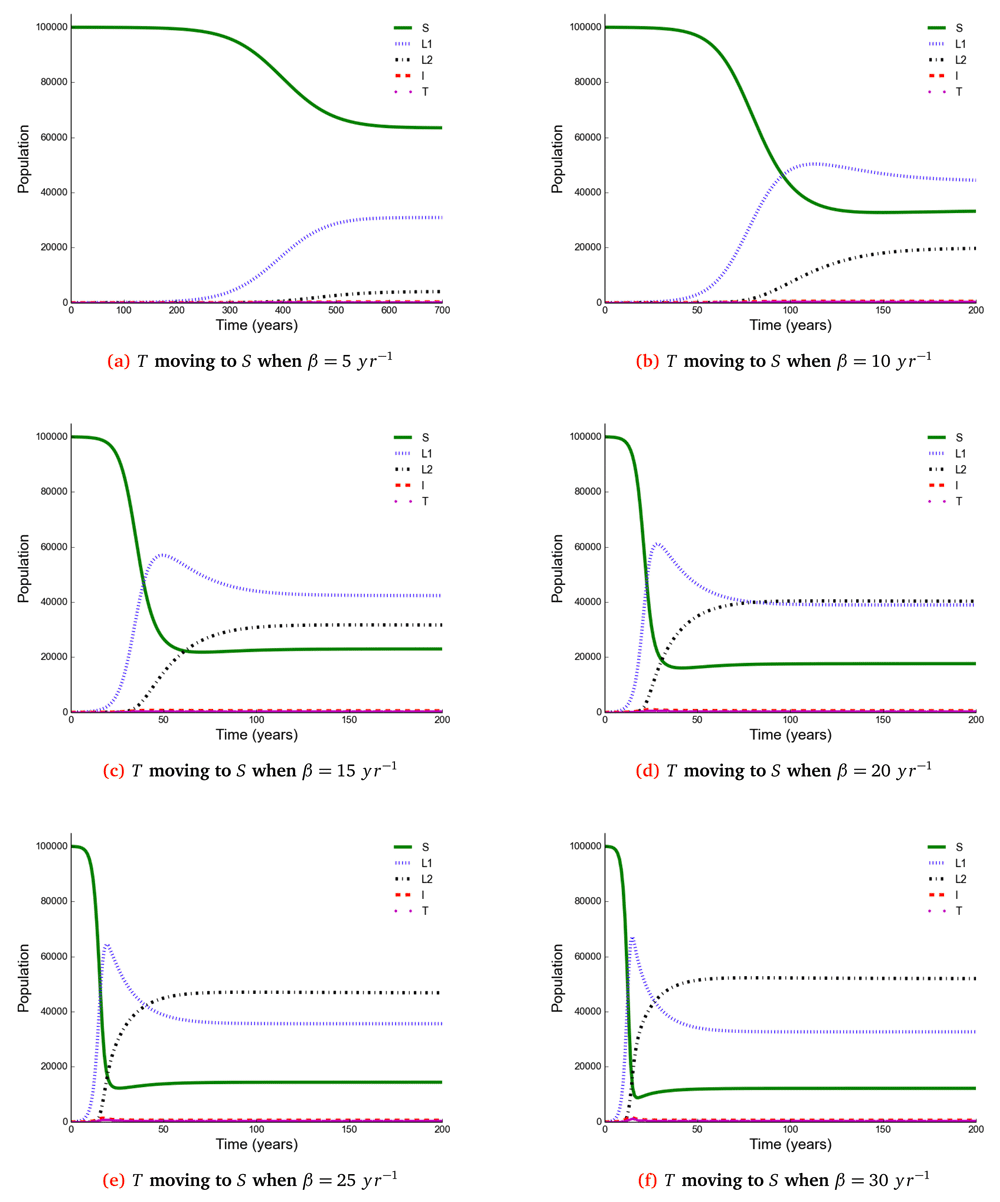
The number of individuals in all five states from β = 5 to β = 30 y r–1 at stability point of a TB epidemic are shown in Table 4. Note: S = susceptible, L1 = newly infected, L2 = reinfected, I = active TB, T = treated individuals.
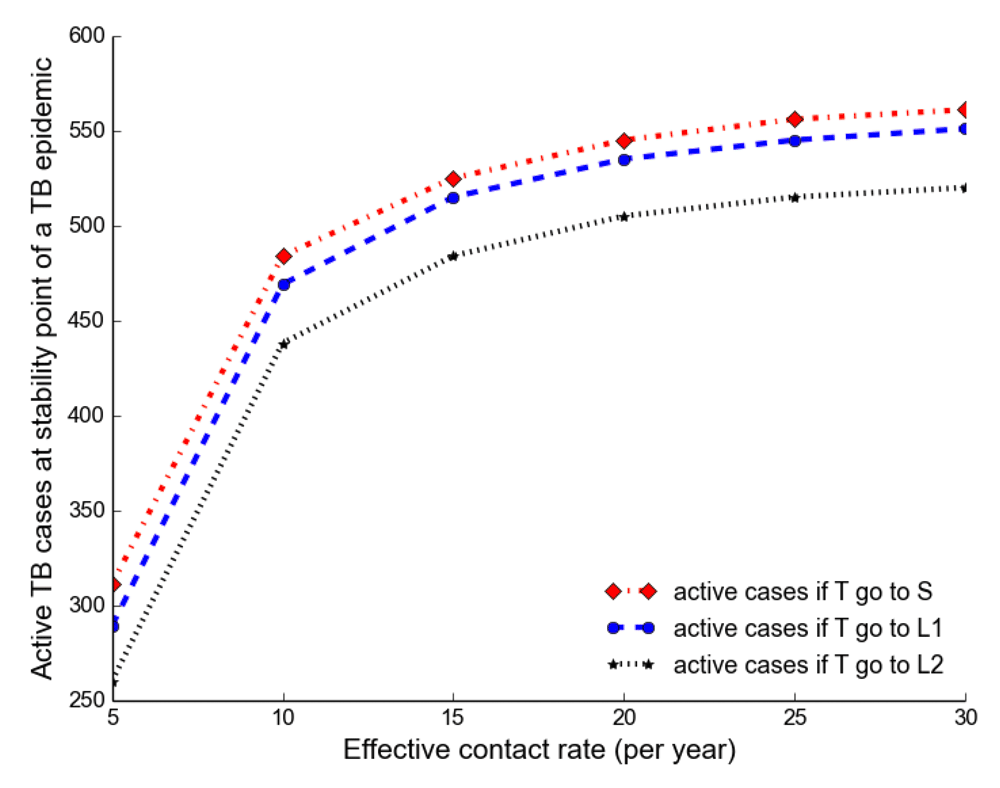
The number of active TB becomes higher when all treated individuals become susceptible than moving to either a newly infected or reinfected state.
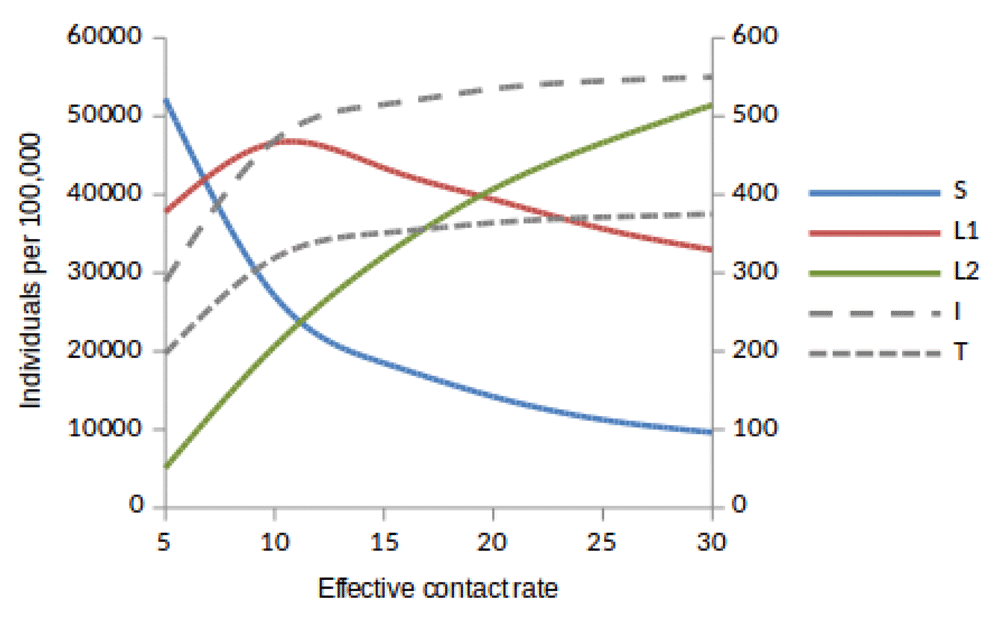
Susceptible (S), newly infected (L1) and reinfected (L2) are located on the left side of y-axis, while active TB (I ) and treated (T) are located on the right side of y-axis.
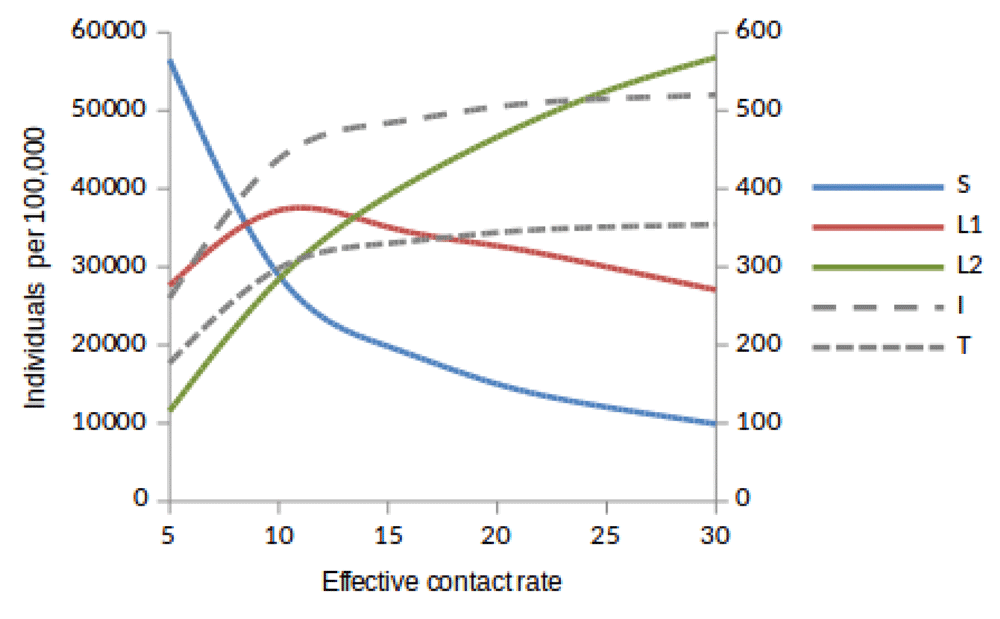
Susceptible (S), newly infected (L1) and reinfected (L2) are located on the left side of y-axis, while active TB (I) and treated (T) are located on the right side of y-axis.
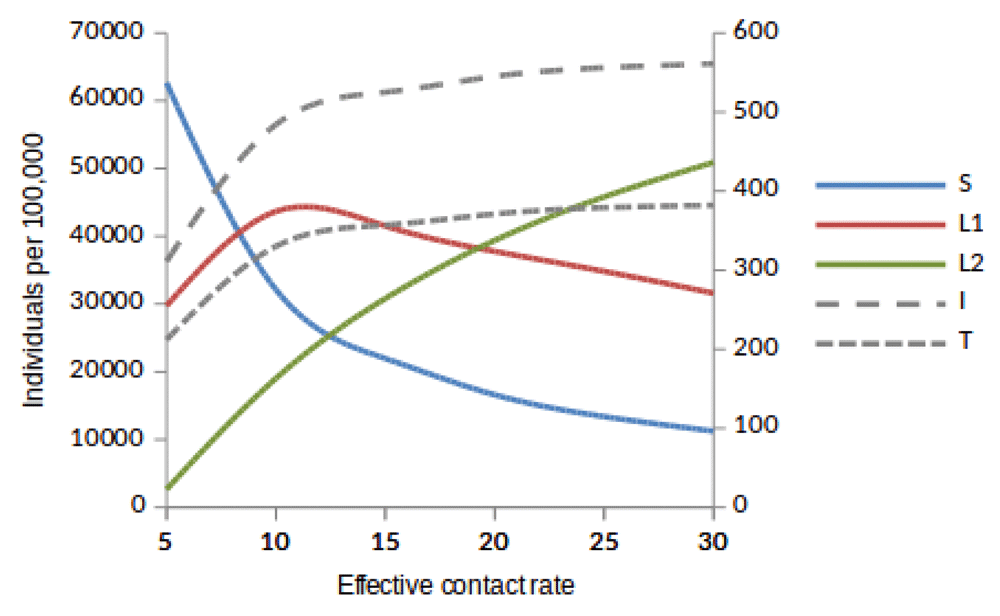
Susceptible (S), newly infected (L1) and reinfected (L2) are located on the left side of y-axis, while active TB (I) and treated (T) are located on the right side of y-axis.
The time taken for a TB epidemic to reach the peak and stability points was noted to decrease with increasing effective contact rate in all cases, implying that effective contact rate is directly correlated with the force of infection. Here, we show that the number of active TB cases in the community is contributed by both newly infected and reinfected individuals after developing active disease. However, since the number of reinfected individuals becomes higher than that of newly infected individuals at stability point of a TB epidemic (if β ≥ 20 y r–1), TB prevalence might be driven by reinfection force.
Using a mathematical model developed in this study, we investigated the impact of effective contact rate and post-treatment immune status on TB epidemiology. A caveat is that this is a simple model assuming a homogeneous population without age stratification and HIV. However, the model has important findings: Susceptible (S), newly infected (L1), reinfected (L2), active TB (I), and treated (T) individuals are all affected in a non-linear relationship with effective contact rate. While it is intuitive that the number of susceptible individuals declines with increasing effective contact rate, the other states are more complex. When β < 20 then L1 > L2 if T move to either S or L1, and when β ≥ 20 then L2 > L1. Treatment and active TB rates are also non-linear, if effective contact rate decreases from 30 to 25 y r–1 then the decline in TB cases is 5/100, 000, but a reduction of 10 to 5 y r–1 produces a decline of 177(range, 173−180)/100, 000.
This saturation effect resulting from high effective contact rate may explain the difficulty in TB control in very high burdened settings, such as mines and prisons.
This may also explain the empiric finding that TB notification rates are relatively insensitive to moderate improvements in case finding in high burden settings. E.g. the Zamstar study and the World Health Organization observation of very little data on the impact of enhanced case finding in high burdened settings22. This is also compatible with the modelling of TB transmission in South African prisons10. At high effective contact rate (i.e., β ≥ 20), there is a high proportion of cases from L2 rather than L1. This is compatible with the observation that 20 − 25% of TB cases are re-treatment cases in high TB burden settings, such as Cape Town. Post-treatment immunological boosting from susceptible status (S) to latently infected status (L2) could decrease population TB by 17% at lower effective contact rate but only 7% at high effective contact rate. Post-treatment vaccination impact would therefore be reduced in very high transmission settings. This finding is of considerable importance for post TB vaccine study design, requiring a balance between high event frequency and reduced vaccination effect.
The early peak values in TB rates demonstrate that there may be temporary peaks followed by apparent decline in notifications when TB disease is introduced into a new susceptible population, as seen in studies of the Alaskan Inuit population23. The time course of TB epidemiology is long, and the status of the post-treatment state is something that prior models have ignored. Loss of protective immunity in newly infected individuals following treatment (or prophylaxis which is a form of treatment) could have major negative epidemiological consequences.
The findings in this study suggest that TB prevalence is driven by reinfection force, particularly in high TB burden settings, such as Cape Town. Although prior natural MTB infection induces a partial immune protection, which reduces TB susceptibility12, the number of reinfected individuals continues to increase dramatically. The source of reinfection strains is not clearly understood, but the increasing number of reinfected individuals might be accelerated by the force of infection due to high effective contact rate and duration of exposure in congregate areas in particular. In conclusion, enhancing post-treatment immune status by vaccination may significantly augment medical treatment. However, an increased focus on diminishing the effective contact rate will require greater focus on environmental interventions.
All the data sources used in the analysis are referenced in Table 1.
This work is funded by grants from the South African Medical Research Council with funds from National Treasury under the Economic Competitiveness and Support Package (MRC-RFA-UFSP-01-2013/CCAMP) and the Bill & Melinda Gates Foundation (OPP1116641).
The funders had no role in study design, data collection and analysis, decision to publish, or preparation of the manuscript.
This article is based on the PhD thesis of CI at the University of Cape Town, South Africa.
| Views | Downloads | |
|---|---|---|
| F1000Research | - | - |
|
PubMed Central
Data from PMC are received and updated monthly.
|
- | - |
Is the work clearly and accurately presented and does it cite the current literature?
Yes
Is the study design appropriate and is the work technically sound?
No
Are sufficient details of methods and analysis provided to allow replication by others?
Yes
If applicable, is the statistical analysis and its interpretation appropriate?
Not applicable
Are all the source data underlying the results available to ensure full reproducibility?
Yes
Are the conclusions drawn adequately supported by the results?
No
Competing Interests: No competing interests were disclosed.
Reviewer Expertise: Tuberculosis, modelling, respiratory infections
Is the work clearly and accurately presented and does it cite the current literature?
Partly
Is the study design appropriate and is the work technically sound?
Partly
Are sufficient details of methods and analysis provided to allow replication by others?
Yes
If applicable, is the statistical analysis and its interpretation appropriate?
Not applicable
Are all the source data underlying the results available to ensure full reproducibility?
No source data required
Are the conclusions drawn adequately supported by the results?
Yes
Competing Interests: No competing interests were disclosed.
Alongside their report, reviewers assign a status to the article:
| Invited Reviewers | ||
|---|---|---|
| 1 | 2 | |
|
Version 1 09 Oct 17 |
read | read |
Provide sufficient details of any financial or non-financial competing interests to enable users to assess whether your comments might lead a reasonable person to question your impartiality. Consider the following examples, but note that this is not an exhaustive list:
Sign up for content alerts and receive a weekly or monthly email with all newly published articles
Already registered? Sign in
The email address should be the one you originally registered with F1000.
You registered with F1000 via Google, so we cannot reset your password.
To sign in, please click here.
If you still need help with your Google account password, please click here.
You registered with F1000 via Facebook, so we cannot reset your password.
To sign in, please click here.
If you still need help with your Facebook account password, please click here.
If your email address is registered with us, we will email you instructions to reset your password.
If you think you should have received this email but it has not arrived, please check your spam filters and/or contact for further assistance.
Comments on this article Comments (0)