Keywords
cigarette smoking, visual system, color discrimination, color vision, Cambridge Colour Test, Trivector, nicotinic receptor,
This article is included in the Eye Health gateway.
cigarette smoking, visual system, color discrimination, color vision, Cambridge Colour Test, Trivector, nicotinic receptor,
Cigarette smoking is still a major source of exposure to chemicals that are toxic for humans. The compounds in cigarettes and cigarette smoke, such as nicotine, oxygen dioxide and formaldehyde, are highly harmful to health1. Data from the World Health Organization (WHO) hypothesize that by 2030, cigarettes could kill nearly 9 million people a year around the world2,3.
Cigarette nicotine deprivation in chronic users may impair cognitive and attentional abilities even after long time of cessation4,5. The neurotoxic effects of chronic use and smoking abstinence on the nervous system have not been extensively studied6–8. The need for establishing reliable measures that assess the effects of smoking on sensory, perceptual and cognitive domains is crucial to fill these gaps.
A visual percept may consist of stimuli that vary over the space (spatial contrast), time (temporal contrast) or direction of motion, and vary in luminance (achromatic) and chromaticity (saturation and hue color)9–11. Thus, chromatic contrast involves chromaticity differences, which can be expressed by the distance in the CIE 1976 uniform chromaticity scale diagram and assessed by the size of MacAdam ellipses on the Cambridge Color Test (CCT), for example 12,13.
We base our rationale on the premise that chronic exposure to nicotine will led to receptor desensitization and not suffer influence of arousal and increase in attentional resources in smokers14. The purpose of the present study was to assess the influence of chronic heavy smoking on color discrimination (CD).
In this study, 15 non-smokers (mean age = 32.5 years; SD = 9.1; 7 male), 15 cigarette smokers (mean age = 32.1 years; SD = 5.7; 7 male) and 15 deprived smokers (mean age = 31.9 years; SD = 6.3; 7 male) between the ages of 20 and 45 years, who were working as staff or were students at Federal University of Paraiba, were recruited through printed advertisements. Participants were excluded if they had any one of the following criteria: younger than 20 and older than 45 years (since the effects of the human visual system immaturation or aging could superestimate the results15,16); current history of neuropsychiatric disorder; a history of head trauma, color blindness, current or previous drug abuse; drinking more than 10 alcoholic drinks per week or current use of medications that may affect visual processing and cognition. In addition, subjects were required to have a good ocular health: no abnormalities were detected in the fundoscopic examination and in the optical coherence tomography (OCT) exam. All participants had normal or corrected-to-normal vision as determined by a visual acuity of at least 20/20.
Smokers reported a smoking history of at least 8 years, currently smoked more than 20 cigarettes/day and had a score of >5 on the Fagerstrom Test for Nicotine Dependence (FTND)17. Deprived smokers were asked to smoke only after the experiment (≈ 6/7 hours of deprivation). Smokers and deprived smokers began smoking at an average of 16.5 years of age (SD = 3.25) and had been smoking for an average 15 years (SD = 6.45). Non-smokers had never smoked a cigarette. Smokers were allowed to smoke until the beginning of experiment.
This research followed the ethical principles from the Declaration of Helsinki and was approved by the Committee of Ethics in Research of the Health Sciences Center of Federal University da Paraiba (CAAE: 60944816.3.0000.5188). Written informed consent was obtained from all participants.
Stimuli were presented on a 19 inch LG CRT monitor with 1024 × 786 resolution and a rate of 100 Hz. Stimuli were generated using a VSG 2/5 video card (Cambridge Research Systems), which was run on a microcomputer Precision T3500 with W3530 graphics card. All procedures were performed in a room at 26±1°C, with the walls covered in grey for better control of luminance during the experiments. All measurements were performed with binocular vision. Monitor luminance and chromatic calibrations were performed with a ColorCAL MKII photometer (Cambridge Research Systems).
The color vision test was performed using CCT, version 2.0, with Trivector subtest (Cambridge Research Systems; http://www.crsltd.com/tools-for-vision-science/measuring-visual-functions/cambridge-colour-test/). The CTT was performed in a darkened room with illumination provided only by the monitor used to present visual stimuli. Trivector provides a clinical assessment of color vision deficiencies as a rapid means screening of the existence of congenital or acquired deficits12. CCT uses pseudoisochromatic stimuli (Landolt C) defined by the test colors that are to be discriminated, on an achromatic background. The figure and the background are composed of grouped circles randomly varying in diameter and having no spatial structure (variation of 5.7° arcmin of external diameter and 2.8° arcmin of internal diameter). The luminance variation in each response avoids the existence of learning effect or use of tricks to respond correctly.
The four-alternative forced-choice12,18 (4-AFC) method was used, and the subjects' task was to identify, using a remote control response box, whether the Landolt 'C' stimulus was presented at the left, right, up or down side of the monitor screen. The participant was instructed to answer even if could not identify the stimulus gap12. After each correct answer, the chromaticity of the target proceeded closer to that of background, while each wrong answer or omission was followed by the presentation of the target at a greater chromatic distance from the background. The step on the staircase was doubled or divided by two after each incorrect or correct answer, respectively. This process took place throughout the experiment. The experiment ended after 11 reversals for each axis and the threshold was estimated from the six final reversals19.
The trivector testing protocol estimates sensitivity for the short, medium and long wavelengths through the protanopic, deuteranopic, and tritanopic confusion axes, respectively19,20. Trivector protocol uses vectors as central measurement. The advantage of this brief test is that it can be performed in about 5 minutes and provides a reliable result12. The three confusion axes converge at a point called 'point of intersection', and the xy coordinates used were: protan (0.6579, 0.5013), deutan (-1.2174, 0.7826) and tritan (0.2573, 0.0000) (for more details, see 13).
In general, we used a default setting where the Landolt ‘C’ had an opening at 1° of visual angle, minimum luminance of 8 cd/m², maximum luminance of 18 cd/m², 6 s of response time for each trial and distance of 269 cm between participant and monitor screen.
Most of these procedures were performed late in the morning or mid-afternoon. Here we used Weber contrast21:
where C is the contrast value, Lmax, Lmin and LBackground are luminance maximum and minimum and luminance of the background, respectively.The distributions for each group were compared with Shapiro-Wilk. Both groups showed non-normal distribution, thus non-parametric statistical methods were used to analyze the data. For group comparisons, the non-parametric univariate analysis was used, with pairwise comparisons by Mann-Whitney U test. Spearman’s rank correlation coefficients (rho) were conducted to assess the relationship between outcomes of color discrimination data and biosociodemographic variables, such as age, gender and education level. All the calculations were made using SPSS®, version 21.0.
The effect size (r) estimation was used from the conversion of z-score22,23:
Results are presented as medians. Center lines show the medians; box limits indicate the 25th and 75th percentiles as determined by SPSS software; whiskers extend 1.5 times the interquartile range from the 25th and 75th percentiles (ends of the whiskers are the maximum and minimum values). When presented, errors bars represent standard deviations (SD) of the median based on 1000 bootstrap resamplings. Bonferroni correction was the method of adjusting the P-value that we used. P < 0.016 was accepted as statistically significant for multiple comparisons and P < 0.025 for pairwise comparisons.
There were significant differences in discrimination thresholds between groups along the protan (χ²(2) = 26.53, P < 0.001), deutan (χ²(2) = 22.40, P < 0.001) and tritan (χ²(2) = 14.93, P < 0.001) axes. The results of the trivector measurements are shown in Figure 1.
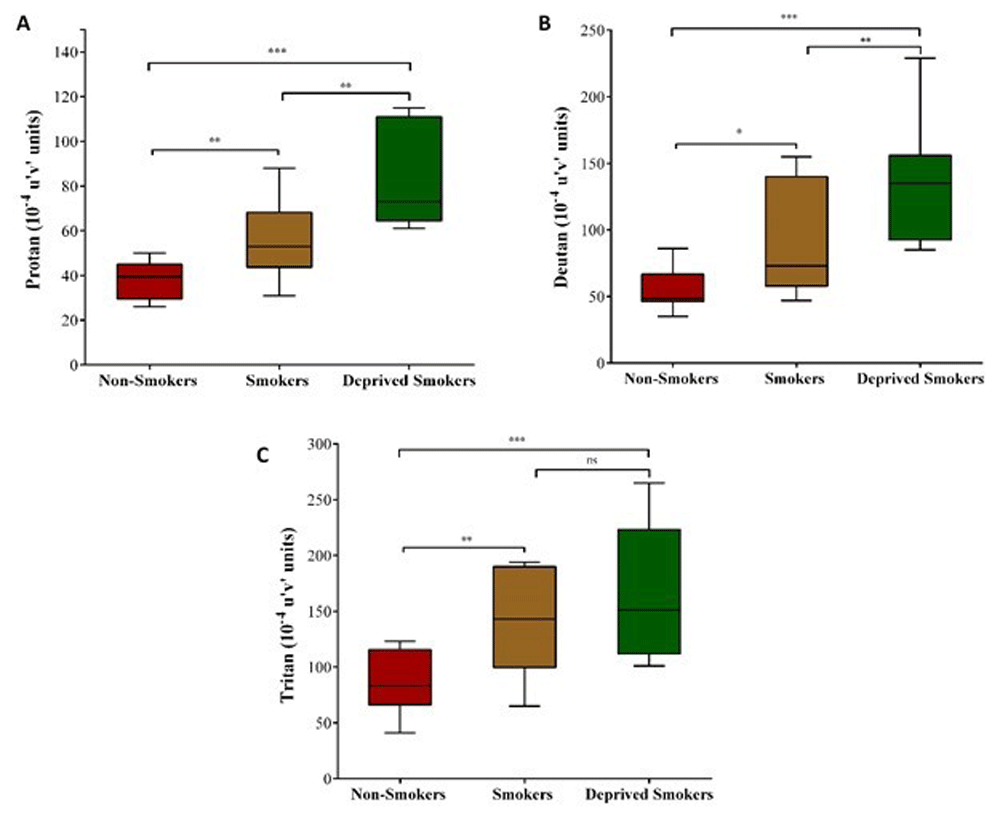
Trivector test: box-and-whiskers plots for protan (A), deutan (B) and tritan (C) confusion lines. Data are presented in 10-4 u’v’ units. Each box-and-whiskers plot is based on results for 45 participants. * P < 0.05; ** P < 0.01; *** P < 0.001.
Along protan vectors (Figure 1A), pairwise comparisons showed significant differences between non-smokers vs. smokers (U = 132, P = 0.002, r = -.61), non-smokers vs. deprived smokers (U = 105, P < 0.001, r = -.85) and smokers vs. deprived smokers (U = 136, P = 0.002, r = -.58).
Along deutan vectors (Figure 1B), pairwise comparisons showed significant differences between non-smokers vs. smokers (U = 136, P = 0.001, r = -.58), non-smokers vs. deprived smokers (U = 108, P < 0.001, r = -.83), and smokers vs. deprived smokers (U = 154, P = 0.024, r = -.43).
Along tritan vectors (Figure 1C), pairwise comparisons showed significant differences between non-smokers vs smokers (U = 140, P = 0.003, r = -.55) and non-smokers vs. deprived smokers (U = 126, P < 0.001, r = -.67). There was no statistically significant differences among smokers vs. deprived smokers (P = 0.250).
There is no relationship between color discrimination and gender (chi-square = 72, df = 39, P > 0.05). A spearman correlation showed no correlation between FTND and trivector data (P > 0.050), color discrimination and education years [rho = .078, P = 0.515], and color discrimination and age [rho = .096, P = 0.347].
The data indicated that smoker groups, as a whole, had less discrimination when compared to non-smokers (P < 0.05), indicating the existence of a diffuse impairment in visual processing.
Small differences in blue-yellow color processing suggest that sensor neurons responsive to the short wavelength may differently operate from those responding to medium and long wavelengths. Indeed, the koniocelular pathway may not suffer from the influences of tobacco components.
Along the trivector protocol, smokers were more sensitive to protanopic and deuteranopic confusion axes (Figure 1). An effect size analysis confirmed that smokers had the largest discrimination errors for protanopic (r = -85) and deuteranopic (r = -82) confusion axes when comparing against non-smokers. As stated, this result does not support the idea of channel selectivity. However, we base our rational on the existence of diffuse processing impairment, which may include magno- and parvocellular pathways.
Nicotine enhances dopamine (DA) release through a balance of activation and desensitization of nicotinic acetylcholine receptors (nAChRs) located mainly in the ventral tegmental area and in the striatum14,28. There are also nAChRs and DA receptors on the retina, so it is not hard to understand that the use of nicotine would enhance attentional resources29–31. However, we did not observe improvements in color discrimination. So, is there any relationship between smoking and color discrimination? The answer may lie in desensitization, which is one of many brain changes caused by addiction32. In addition, chronic nicotine exposure leads to nAChRs desensitization through brain upregulation33,34. Another property of cigarettes is that the more exposure, the greater the need for it activate the receptors, which changes affinity and response properties of the nAChRs35,36. Whereas nicotine enhancing effects decay and remain unchanged after chronic exposure, this may explain the lower discrimination, but the small similarity, between smokers and non-smokers in some of our data (Figure 1).
Then, why did the deprived smokers group have less discrimination? This can be explained by the withdrawal effect, which induces a hypofunctional effect of DA release37,38, reflecting both visual processing39–41 and brain reward function42. Visual attention plays a role for detection of environmental stimuli43.
As stated, impairments observed at color discrimination can occur due to cones saturation, amplification of the signals that reach visual cortex or by the action of nicotine in parvocelular pathway44. In agreement with studies, color vision impairments may be related to ventral stream, which processes color45. However, our tests used pseudoisochromatic stimuli. Thus, color discrimination may have occurred through dorsal and ventral stream. Maybe it is too soon to conclude anything, but there may be nAChRs in both dorsal and ventral stream. In addition, both streams may suffer from the action of DA hypofunction, affecting directly visual processing38–40,42.
Knowing the existence of the expression of nAChRs in bipolar, amacrine and ganglionar cells28,46, we suggest that smoking affects visual processing, regardless of deprivation. Although the differences between smokers and non-smokers were small, we could not ignore the existence of many harmful compounds to vision in cigarettes. As noted in others studies, exposure to cigarette smoking47–51 and solvents52,53 affects vision. Thus, smoking can be harmful even for passive smokers.
Our limitations need to be considered. We evaluated cigarette smoking as a whole, not the nicotine-only effects49,50. Which brings us to the idea of further studies, using nicotine gum and the same paradigm used here. Clearly, further work is needed, but this study highlights the relationship between smoking and color discrimination, involving short, medium and long wavelengths. We conclude that cigarette compounds affect vision more than nicotine separately54,55.
Dataset 1: Patient demographics and Trivector results. Raw data of the subjects biosociodemographic and trivector (protan, deutan and tritan) results. doi, 10.5256/f1000research.10714.d15005959
| Views | Downloads | |
|---|---|---|
| F1000Research | - | - |
|
PubMed Central
Data from PMC are received and updated monthly.
|
- | - |
Click here to access the data.
Spreadsheet data files may not format correctly if your computer is using different default delimiters (symbols used to separate values into separate cells) - a spreadsheet created in one region is sometimes misinterpreted by computers in other regions. You can change the regional settings on your computer so that the spreadsheet can be interpreted correctly.
Provide sufficient details of any financial or non-financial competing interests to enable users to assess whether your comments might lead a reasonable person to question your impartiality. Consider the following examples, but note that this is not an exhaustive list:
Sign up for content alerts and receive a weekly or monthly email with all newly published articles
Already registered? Sign in
The email address should be the one you originally registered with F1000.
You registered with F1000 via Google, so we cannot reset your password.
To sign in, please click here.
If you still need help with your Google account password, please click here.
You registered with F1000 via Facebook, so we cannot reset your password.
To sign in, please click here.
If you still need help with your Facebook account password, please click here.
If your email address is registered with us, we will email you instructions to reset your password.
If you think you should have received this email but it has not arrived, please check your spam filters and/or contact for further assistance.
Comments on this article Comments (0)