Keywords
fluorescent proteins, mScarlet, yeast, polyglutamine toxicity, aggregation, Huntington’s disease
fluorescent proteins, mScarlet, yeast, polyglutamine toxicity, aggregation, Huntington’s disease
In this revised version, we added quantitative growth analysis in liquid cultures to compare toxicity of the different fluorescent fusions. We also added quantification for the dot blot experiments. Finally, to determine if the absence of toxicity of the yFusionRed-tagged 68Q construct was due to its lower expression, we expressed the fusion from a multicopy vector. This resulted in Httex1-yFusionRed toxicity and aggregation, albeit to a lower extent compared to the ymsfGFP-tagged counterpart.
In Figure 1 we have changed the statistical significance of the data in Figure 1D. In Figure 2 we added growth curves to 2B and have removed the dot blot which is now Figure 3. We generate a new Figure 4 in response to reviewer comments. Julie Genereaux, who generated the plasmids used in Figure 4, has been added as a contributing author. Additional raw data behind figures 1-4 has been added to Dataset 1.
See the authors' detailed response to the review by Fedor V. Subach
See the authors' detailed response to the review by Danny M. Hatters and Dezerae Cox
Following the development of the green fluorescent protein (GFP) from the jellyfish Aqueaora victoria (Chalfie et al., 1994), several other FPs with various spectral properties have been characterized (Thorn, 2017), allowing simultaneous detection of multiple fluorescent reporters. Among the most popular alternatives to GFP are the red fluorescent proteins (RFPs) isolated from Anthozoa coral and anemone species. One of the drawbacks of RFPs is that Anthozoa derived FPs are obligate tetramers (Baird et al., 2000; Verkhusha & Lukyanov, 2004). While development of RFPs into monomeric versions has been successful, it is often associated with reduced brightness of the fluorescent signal (Campbell et al., 2002) and therefore reduced overall performance of the resulting monomeric FPs. Moreover, RFPs such as TagRFP and mRuby2 reported as monomeric by passing purified proteins through sizing columns still display high tendency to oligomerize in living mammalian cells (Costantini et al., 2015; Costantini et al., 2012). Thus, under specific circumstances, FPs reported as monomeric can still be prone to oligomerization. Unwanted formation of oligomers could potentially significantly alter the function/localization of the protein of interest fused to the FP and render reporters unreliable (Costantini et al., 2015; Snapp et al., 2003; Zacharias et al., 2002). Indeed, various RFPs (mCherry, mKate2, mRuby, mKO2, mApple, TagRFP-T) have been shown to have differential effects on localization of cdc12 in yeast (Lee et al., 2013). Thus, being able to assess the behavior of fluorescent reporter in a given organism and/or cellular compartment is critical to help optimize fluorescent reporter design (Snapp, 2009).
We recently established a method to rapidly compare the behavior of FPs against a monomeric variant of superfolder GFP (msfGFP) in yeast (Jiang et al., 2017). The assays exploit the ability of polyglutamine expansions associated with Huntington’s disease (HD) to form toxic aggregates in yeast cells. The cause of HD can be traced back to abnormal expansion of a polyQ stretch within the first exon of the gene encoding the Huntingtin protein (Httex1) resulting in chorea and cognitive defects in patients (Gusella & MacDonald, 1995; Huntington, 1872; Penney et al., 1997). Expansion over 36 repeats is known to cause the Htt protein to misfold and aberrantly accumulate into detergent-insoluble amyloid-like aggregates in the cytoplasm of striatal neurons (Penney et al., 1997). Expression of expanded Httex1 in yeast results in severe polyQ aggregation and growth defect (Duennwald, 2013; Krobitsch & Lindquist, 2000; Mason & Giorgini, 2011; Meriin et al., 2002). Interestingly, the nature of the sequences flanking the polyQ regions (in this case fluorescent or epitope tags) greatly affects the propensity of the polyQ expansions to aggregate and to display significant growth defects in yeast (Duennwald et al., 2006). Using polyQ toxicity assays in yeast, we previously showed that a yeast-optimized version of mCherry (termed yemRFP (Keppler-Ross et al., 2008)) displays only a mild growth defects compared to yeast-optimized msfGFP (ymsfGFP) (Jiang et al., 2017). These results lead us to exploit the polyQ toxicity and aggregation assays to explore the effects of two of the most recently available RFPs. Here, we focused on FusionRed, a red monomeric fluorescent variant of mKate2 known for its low cytotoxicity in cells (Shemiakina et al., 2012) that displays low propensity to oligomerize in mammalian cells (Costantini et al., 2015). We also included mScarlet, a monomeric synthetic RFP that was recently shown to outperform other RFPs in terms of brightness of the fluorescent signal (Bindels et al., 2017). Both have yet to be characterized for expression in yeast.
All strains are derived from W303-1A (Thomas & Rothstein, 1989). All experiments were conducted in synthetic complete media (SC) at 30°C.
yemRFP (Keppler-Ross et al., 2008) was previously described. yFusionRed and ymScarlet were codon optimized for expression in yeast and synthetized by Genscript Inc. based on previously published sequences (Bindels et al., 2017; Shemiakina et al., 2012). RFPs were cloned into the SpeI/SalI site of p415 GPD. Alternatively, RFPs were cloned into the SpeI/SalI sites of p415 GAL1 25Q/68Q Httex1 lacking the proline rich domain, as previously described (Jiang et al., 2017). To generate 2µ vectors, the GAL1 25Q/68Q Httex1-ymsfGFP or GAL1 25Q/68Q Httex1-yFusionRed fragments were cloned into the SacI/SalI sites of pRS42N (Taxis & Knop, 2006). All Httex1 constructs lack the proline-rich domain since absence of this domain is required for Httex1 toxicity in yeast (Duennwald et al., 2006). We also noted that since the publication of our previous study (Jiang et al., 2017), the original 72Q Httex1 plasmid has mutated into 68Q. We, therefore, used the latter in this study. See Table 1 for a list of plasmids used in this study.
| Plasmids | Resistance marker | Source |
|---|---|---|
| P415 GPD | Leu | (Mumberg et al., 1995) |
| P415 GPD-yemRFP | This study | |
| P415 GPD-yFusionRed | ||
| P415 GPD-ymScarlet | ||
| P415 Gal1-FLAG-25Q-ymsfGFP | (Jiang et al., 2017) | |
| P415 Gal1-FLAG-68Q-ymsfGFP | This study | |
| P415 Gal1-FLAG-25Q-yemRFP | (Jiang et al., 2017) | |
| P415 Gal1-FLAG-68Q-yemRFP | This study | |
| P415 Gal1-FLAG-25Q-yFusionRed | ||
| P415 Gal1-FLAG-68Q-yFusionRed | ||
| P415 Gal1-FLAG-25Q-ymScarlet | ||
| P415 Gal1-FLAG-68Q-ymScarlet | ||
| PRS42N Gal1-FLAG-25Q-ymsfGFP | natNT2 | |
| PRS42N Gal1-FLAG-68Q-ymsfGFP | ||
| PRS42N Gal1-FLAG-25Q-yFusionRed | ||
| PRS42N Gal1-FLAG-68Q-yFusionRed |
Yeast growth was measured by spotting assay on agar plates. Briefly, cells were cultured overnight to saturation in appropriate selection media. The next day, cells densities were equalized to OD600 0.2 and 5x serial dilutions were spotted on agar plates. Alternatively, cell densities were equalized to OD600 0.1 and cells 300 µL of cell suspensions were transferred into a 96 well plate and incubated at 30oC for 24h with constant shaking in a Biotek Epoch 2 microplate spectrophotometer and OD600 was recorded every 15 minutes.
After induction in galactose media overnight, cells were lysed using glass beads in lysis buffer (100 mM Tris pH 7.5; 200 mM NaCl; 1 mM EDTA; 5% glycerol, 1 mM Dithiothreitol (DTT) 4 mM phenylmethylsulfonyl fluoride (PMSF) and protease inhibitor cocktail). Equal amount of proteins were spotted on a nitrocellulose membrane. Membranes were blocked for 30 min in PBS-0.05%Tween at room temperature were and then processed for immunoblot. Membranes were probed with anti-FLAG primary antibody (Sigma F3040, 1:5000 dilution) overnight at 4°C and subsequently with a secondary anti-mouse fluorescent antibody (Thermo Alexa 555 #A21424, 1:5000 dilution) for 1h at room temperature and imaged using a Bio-Rad ChemiDoc MP imaging system. Membranes were then stripped using the Gene Bio-Application stripping buffer and reprobed with an anti-Pgk1 primary antibody (Thermo 22C5D8) using the same secondary antibody. In Figure 3, for each individual antibody, both membranes were imaged simultaneously to allow direct comparison of fluorescent signal. Densitometric analysis was performed using Image J.
Under the different experimental conditions, cells were diluted 10x in growth media and plated in Lab-tek (Thermo Inc.) imaging chambers and processed for fluorescence microscopy. Images in Figure 1 were acquired using a Zeiss AxioVert A1 wide field fluorescence microscope equipped with a 63X NA 1.4 Plan Apopchromat objective, a 560 to 600nM excitation/630 to 705 nm emission bandpass filter and Zeiss Axiocam 506 mono camera. Images presented in Figure 2 and Figure 4 were collected using a Zeiss 800 confocal microscope equipped with 488 nm and 561 nm diode lasers and a 63x PlanApochromat NA 1.4 objective.

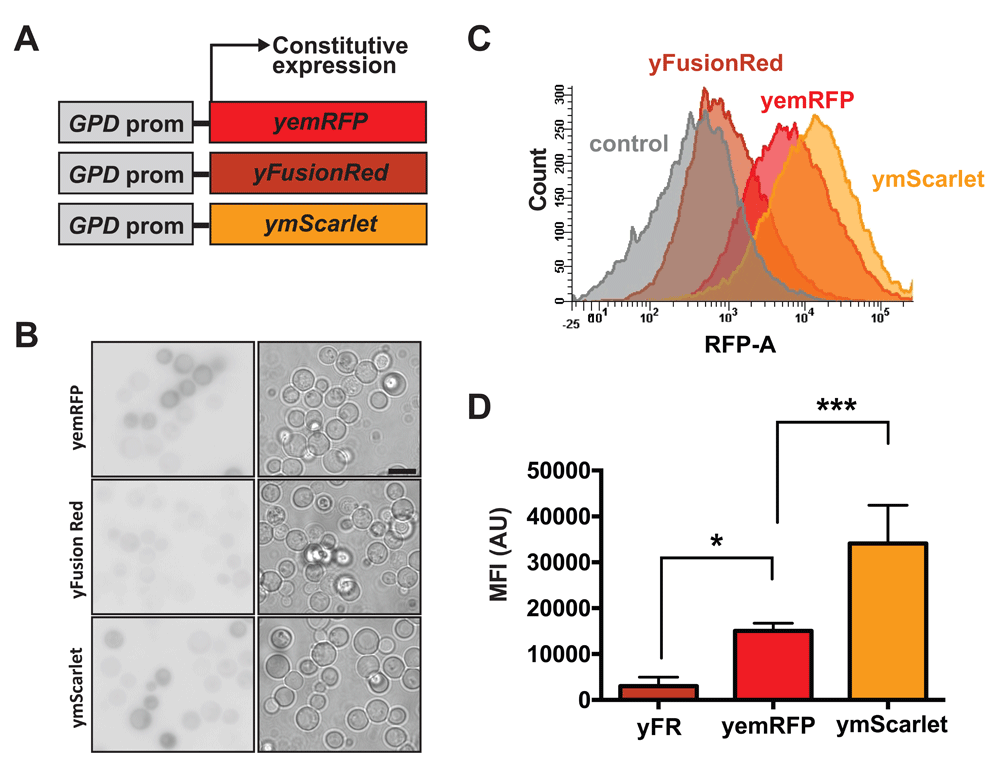
(A) Scheme of fluorescent proteins vectors. yemRFP, yFusionRed and ymScarlet were introduced into centromeric vectors under the control of a constitutive GPD promoter. (B) Representative images from 3 fields of yeast cells expressing different RFPs. Imaging conditions were kept constant between samples to allow direct comparison of fluorescent intensities. Inverted black and white images are shown for clarity. Bar: 5µm (C) Yeast cells expressing the different RFPs were analyzed by flow cytometry and compared to cells carrying an empty vector. (D) Median fluorescent intensities of the various RFPs were calculated from fluorescent data acquired using flow cytometry. *p<0.05 and ***p<0.001 according to a one way ANOVA followed by a Dunnett’s multiple comparison test comparing samples to yFusionRed.

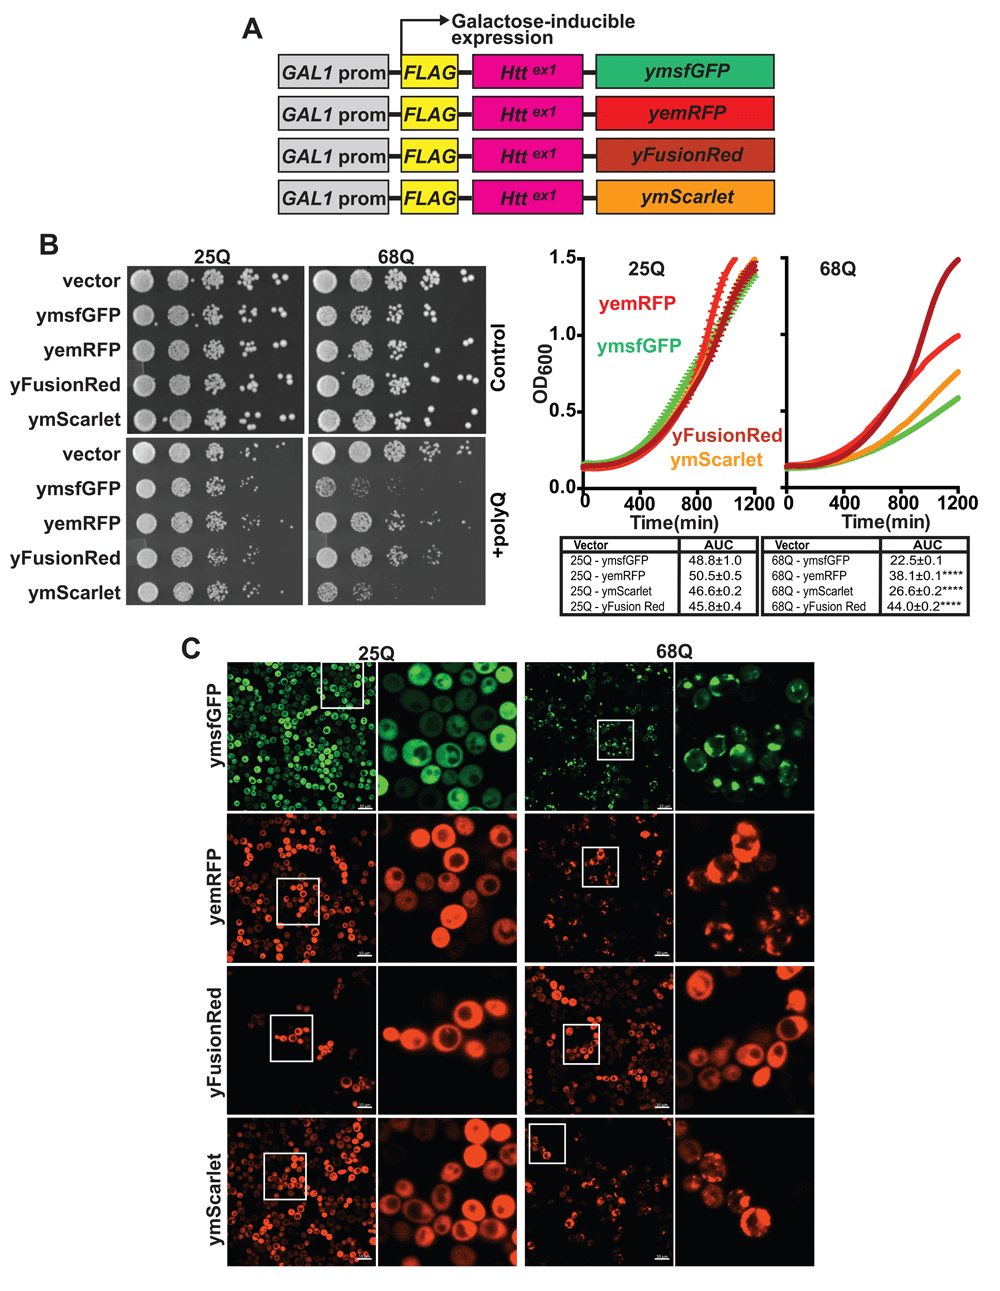
(A) Scheme of vectors encoding fluorescent Fluorescent proteins (FPs) were cloned in frame with FLAG-Httex1 into a centromeric vector carrying a GAL1 inducible promoter. (B) Images of yeast growth assays on agar plates. Yeast cells carrying an empty vector or 25/68Q Httex1 fused to either ymsfGFP, yemRFP, yFusionRed or ymScarlet were grown to saturation overnight in glucose (control) or galactose (polyQ induced) containing media. The next days, cell concentrations were equalized to OD600 0.2 and 5 fold serial dilutions of the cell suspension spotted on synthetic complete agar media plates containing either glucose or galactose. Alternatively, cells were cultured in liquid media and optical densities were recorded over time to generate growth curves. The area under the curve (AUC) was calculated from 3 experimental replicates. ****p<0.0001 according to a one way ANOVA followed by a Dunnett’s multiple comparison test comparing samples to ymsfGFP-tagged fusion of the same polyQ length. (C) Representative fluorescent images from 3 fields of yeast cells expressing 25/68Q Htt Httex1 fused to ymsfGFP, yemRFP, yFusionRed or ymScarlet after overnight induction in galactose-containing media.

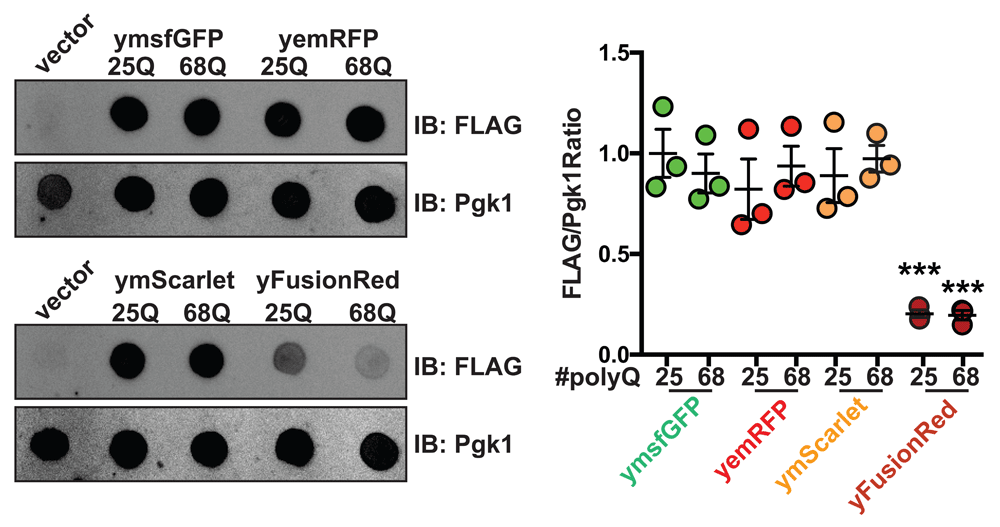
(A) Yeast cells carrying an empty vector or 25/68Q Httex1 fused to ymsfGFP, yemRFP, yFusionRed or ymScarlet or carrying an empty vector were induced overnight in galactose containing media and protein levels analyzed by dot blot using either an anti-FLAG (detection of fluorescent fusions) or anti-Pgk1 antibody (loading control). Quantification of the FLAG/Pgk1 ration is shown from 3 independent experiments. ***p<0.001 according to a one way ANOVA followed by a Tukey’s multiple comparison test comparing samples to ymsfGFP-tagged fusion of the same polyQ length.

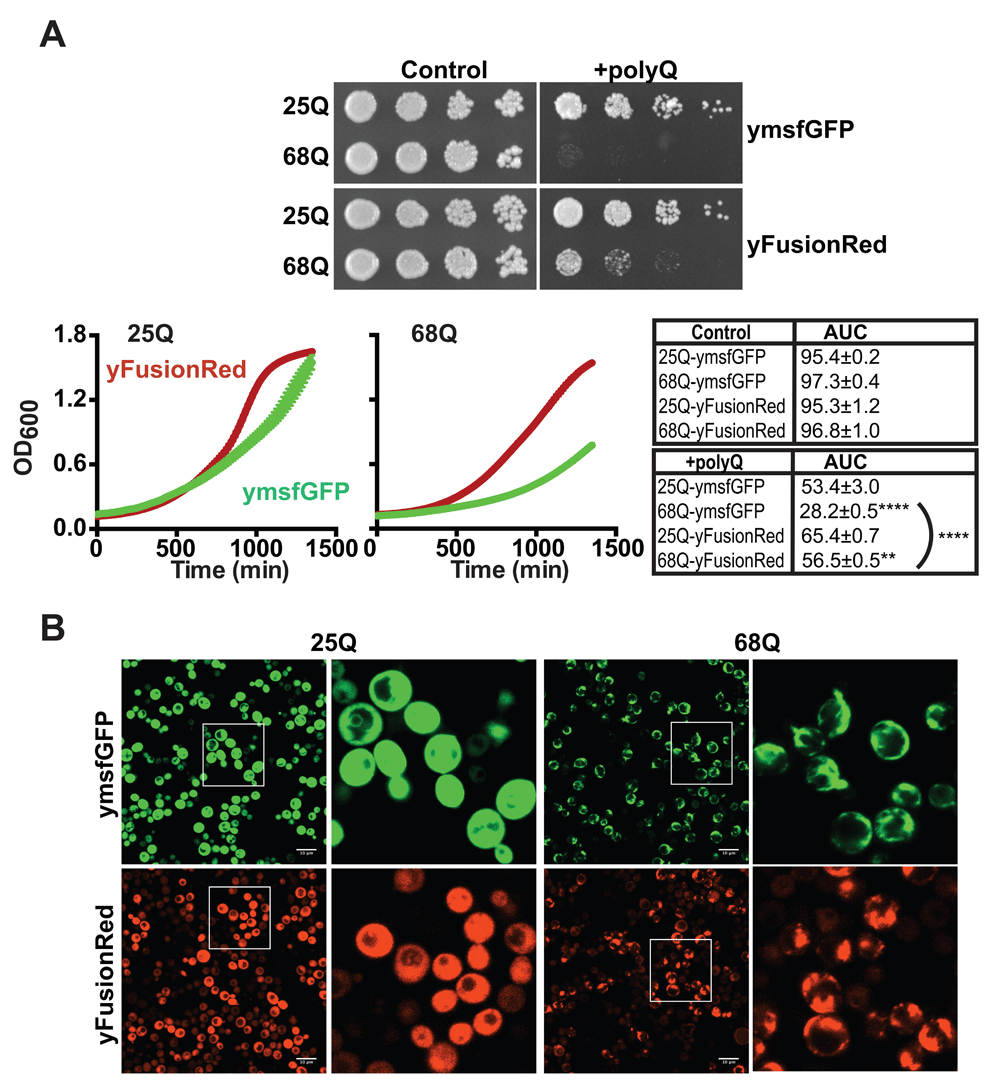
(A) Images of yeast growth assays on agar plates. Yeast cells carrying 25/68Q Httex1 fused to either ymsfGFP or yFusionRed in a 2µ multicopy vector were grown to saturation overnight in glucose (control). The next days, cell concentrations were equalized to OD600 0.2 and 5 fold serial dilutions of the cell suspension spotted on synthetic complete agar media plates containing either glucose (control) or galactose (+polyQ). Alternatively, cells were cultured in liquid media and optical densities were recorded over time to generate growth curves. The area under the curve (AUC) was calculated from 3 experimental replicates. **p<0.01 and ****p<0.0001 according to a one way ANOVA followed by a Tuckey’s multiple comparison test comparing the 68Q sample to its 25Q counterpart unless indicated otherwise. (B) Representative fluorescent images from 3 fields of yeast cells expressing 25/68Q Htt Httex1 fused to ymsfGFP or yFusionRed from a multicopy 2µ vector after overnight induction in galactose-containing media. Under these conditions, 68Q-yFusionRed displays robust aggregation.
Cell were cultured with appropriate media and processed for flow cytometry using a BD Bioscience FACS Celesta flow cytometer equipped with a 561 Yellow laser for imaging of RFPs. Data were analyzed using the BD FACS Diva software. All conditions were performed in triplicates, 20,000 cells were analyzed and median fluorescence intensities were calculated. No gates were applied.
To analyze the performance of the three different RFPs in yeast, we first generated codon optimized versions of both FusionRed and mScarlet (termed yFusionRed and ymScarlet, respectively) (Table 2). Centromeric plasmids encoding yFusionRed, yemRFP and ymScarlet under the control of the constitutive GPD promoter were transformed in yeast (Figure 1A). Fluorescence intensities were compared using wide-field fluorescence microscopy (Figure 1B). Median fluorescence intensity (MFI) was then quantified using flow cytometry. Quantification revealed that yFusionRed was significantly dimmer (~5x) than yemRFP (Figure 1C and D). This result was surprising given that previously published data reported a slightly increased brightness for FusionRed when compared to mCherry (Shemiakina et al., 2012). However, it is known that fluorescent brightness of FPs expressed in yeast can be different from the ones registered for pure purified proteins (Lee et al., 2013). As opposed to yFusionRed, ymScarlet displayed the strongest fluorescent signal (~2x brighter than yemRFP) (Figure 1C and D). These results are in agreement with previous studies reporting increased brightness of mScarlet compared to other RFPs variants (Bindels et al., 2017). Based on the intensity of the fluorescent signal, ymScarlet appears to be the optimal RFP for imaging in yeast.
Next, we sought to determine how the three different FPs affect their fusion partners in living yeast. To this end, we employed the polyQ toxicity assays. Each RFP was cloned in frame with a galactose inducible version of Httex1 carrying either 25Q (non-pathological length) or 68Q (HD-associated) (Figure 2A). 25Q constructs show no growth differences across the different FPs in both uninduced (glucose media) and polyQ-induced (galactose media) conditions indicating that expression of the different constructs results in similar growth phenotypes. When fused to 68Q Httex1, yFusionRed displayed no significant toxicity when compared to the non-toxic 25Q fusion (Figure 2B). Interestingly, ymScarlet displayed severe toxicity, showing a slow growth phenotype comparable to what was observed for ymsfGFP (Figure 2B). Based on these observations, we then investigated the effects of the different RFPs on polyQ aggregation using fluorescence microscopy. We found that yemRFP displayed robust 68Q aggregation similar to ymsfGFP as we previously described (Jiang et al., 2017). It is important to note that while prone to aggregation, yemRFP polyQ proteins were shown to form aggregates with different biophysical properties (increased detergent solubility) that can account for their moderately toxic nature (Jiang et al., 2017). In accordance with the absence of toxicity noted in the growth assay, 68Q-FusionRed did not form visible aggregates, while ymScarlet displayed strong aggregation propensity (Figure 2C). In addition, assessment of protein abundance for each constructs using dot blot revealed that both 25 and 68Q yFusionRed fusions were present at lower levels compared to other fluorescent counterparts (Figure 3A). The cause of this phenotype is unclear and could result from increased turnover rate of the fusions. Interestingly, expression of 69Q-yFusionRed from a multicopy 2µ vector resulted in a growth defect, albeit toxicity was reduced compared to ymsfGFP-tagged polyQ (Figure 4A). Moreover, under these conditions, 68Q-yFusionRed displayed robust aggregation. This indicates that the lower expression levels observed for yFusionRed constructs can potentially explain, at least partially, the absence of polyQ toxicity when expressed at lower levels. Reduced toxicity of the 68Q-yFusionRed is also consistent with our previous observation showing that yomTagBFP2, a blue fluorescent proteins similarly does not form toxic aggregates (Jiang et al., 2017). In fact, both FusionRed and mTagBFP2 (Subach et al., 2011) are evolved versions of the wild-type RFP from sea anemone Entacmaea quadricolor (Merzlyak et al., 2007). In the case of mScarlet, the protein was evolved from a synthetic template design for generating a monomeric protein. Therefore, based on our data, mScarlet appears to be an attractive alternative to mCherry, which minimizes the effect of the FP on its fusion partner.
F1000Research: Dataset 1. Raw data behind Figure 1, Figure 2, Figure 3 and Figure 4, https://doi.org/10.5256/f1000research.15829.d225385 (Albakri et al., 2018)
Both p415 GPD-yFusionRed and p415 GPD-ymScarlet are available from addgene (#111916/11917). All plasmids are available upon request from the corresponding author.
This study was supported by an operating grant (MOP-325538) from the Canadian Institutes for Health Research (CIHR). PL is the recipient of a John R. Evans Leaders Fund award (#35183) with matching fund from the Ontario Research Fund. YJ is supported by a M.Sc. to Ph.D. transfer scholarship from the Dean of the Schulich School of Medicine and Dentistry at The University of Western Ontario.
The funders had no role in study design, data collection and analysis, decision to publish, or preparation of the manuscript.
The authors would like to thanks Dr. Martin Duennwald and members of his laboratory as well as Sarah Chadwick for their help during the realization of this project. The authors also thank Neta Dean (Stony Brook University, New York) for the yemRFP plasmid.
| Views | Downloads | |
|---|---|---|
| F1000Research | - | - |
|
PubMed Central
Data from PMC are received and updated monthly.
|
- | - |
Competing Interests: No competing interests were disclosed.
Competing Interests: No competing interests were disclosed.
Is the work clearly and accurately presented and does it cite the current literature?
Yes
Is the study design appropriate and is the work technically sound?
Yes
Are sufficient details of methods and analysis provided to allow replication by others?
Yes
If applicable, is the statistical analysis and its interpretation appropriate?
Yes
Are all the source data underlying the results available to ensure full reproducibility?
Yes
Are the conclusions drawn adequately supported by the results?
Yes
Competing Interests: No competing interests were disclosed.
Is the work clearly and accurately presented and does it cite the current literature?
Yes
Is the study design appropriate and is the work technically sound?
Yes
Are sufficient details of methods and analysis provided to allow replication by others?
Yes
If applicable, is the statistical analysis and its interpretation appropriate?
No
Are all the source data underlying the results available to ensure full reproducibility?
Yes
Are the conclusions drawn adequately supported by the results?
No
Competing Interests: No competing interests were disclosed.
Reviewer Expertise: Experts in mammalian cell biology and Httex1 mechanisms.
Alongside their report, reviewers assign a status to the article:
| Invited Reviewers | ||
|---|---|---|
| 1 | 2 | |
|
Version 2 (revision) 26 Nov 18 |
read | read |
|
Version 1 10 Aug 18 |
read | read |
Click here to access the data.
Spreadsheet data files may not format correctly if your computer is using different default delimiters (symbols used to separate values into separate cells) - a spreadsheet created in one region is sometimes misinterpreted by computers in other regions. You can change the regional settings on your computer so that the spreadsheet can be interpreted correctly.
Provide sufficient details of any financial or non-financial competing interests to enable users to assess whether your comments might lead a reasonable person to question your impartiality. Consider the following examples, but note that this is not an exhaustive list:
Sign up for content alerts and receive a weekly or monthly email with all newly published articles
Already registered? Sign in
The email address should be the one you originally registered with F1000.
You registered with F1000 via Google, so we cannot reset your password.
To sign in, please click here.
If you still need help with your Google account password, please click here.
You registered with F1000 via Facebook, so we cannot reset your password.
To sign in, please click here.
If you still need help with your Facebook account password, please click here.
If your email address is registered with us, we will email you instructions to reset your password.
If you think you should have received this email but it has not arrived, please check your spam filters and/or contact for further assistance.
Comments on this article Comments (0)