Keywords
high-throughput sequencing, metagenome, metagenomics, next generation sequencing, alpha diversity, complex matrices
high-throughput sequencing, metagenome, metagenomics, next generation sequencing, alpha diversity, complex matrices
Shotgun metagenomics offers the possibility to assess the complete taxonomic composition of biological matrices and to estimate the relative abundances of each species in an unbiased way1,2. It allows for agnostic characterization of complex communities containing eukaryotes, fungi, bacteria and also viruses, using both DNA and RNA as a starting material. In addition, the whole metagenome approach can be used not only to simply identify DNA and RNA virus in a complex matrix, but also to study the genetic diversity in virus populations3–5, and to identify potential adventitious agents in biopharmaceutical manufacturing6,7.
Metagenome shotgun high-throughput sequencing has progressively gained popularity in parallel with the advancing of next-generation sequencing technologies8,9, which provide more data in less time at a lower cost than previous sequencing techniques. This allows the extensive application to study the most various biological mixtures such as environmental samples10,11, gut samples12–14, skin samples15, clinical samples for diagnostics and surveillance purposes16,19, food ecosystems20,21 and drugs manufactured using biological sources as vaccines22.
The aim of whole metagenome approaches is not only to study the taxonomic composition of biological substrates but also to identify which genes and metabolic pathways are present with the aim to understand functional capacities in the studied microbiota13,23. Recently the approach has been also used to analyze the ensemble of genes that may encode antibiotic resistance in various microbial ecosystems (i.e. soil), which are defined as the resistome24.
Another, more traditional approach currently used to assign taxonomy to DNA sequences is based on the sequencing of target conserved regions. Metabarcoding method relies on conserved sequences to characterize communities of complex matrices. These include the highly variable region of 16S rRNA gene in bacteria27, the nuclear ribosomal internal transcribed spacer (ITS) region for fungi28, 18S rRNA gene in eukaryotes29, cytochrome c oxidase sub-unit I (COI or cox1) for taxonomical identification of animals30, rbcL, matK and ITS2 as the plant barcode31. Considering the large amount of genetic diversity within and between virus families, a universal metabarcoding approach is not applicable to detect virus nucleic acids in complex biological samples.
The selection of conserved regions has the advantage of reducing sequencing needs, since it does not require sequencing of the full genome, just a small region. On the other hand, given the currently used approaches, characterization of microbial and eukaryotic communities requires different primers and library preparations32. In addition, several studies suggested that whole shotgun metagenome sequencing is more effective in the characterization of metagenomics samples compared to target amplicon approaches, with the additional capability of providing functional information regarding the studied sample33.
Current whole shotgun metagenome experiments are performed obtaining several million reads10,13. However, obtaining a broad characterization of the relative abundance of different species, might easily be achieved with lower number of reads.
To test this hypothesis, we performed sequencing using whole metagenomics approach of seven samples derived from different complex matrices to characterize their composition, and subsequently tested the accuracy of several measures when downsampling the number of reads used for analysis including the performance of de novo assembly in the ability to reconstruct both entire genomes and genes.
The following samples were used in the present work: two samples collected from a live attenuated virus vaccine (B1 and B2), two horse fecal samples (F1 and F2), and three food samples (M1, M2, and M3).
Biological medicines were two different lots of live attenuated MPRV vaccine (Prorix Tetra, Glaxo SmithKline) widely used for immunisation against measles, mumps, rubella and chickenpox in infants. Lyophilised vaccines were resuspended in 500 μl sterile water for injection and DNA extracted using Maxwell® 16 Instrument and the Maxwell® 16 Tissue DNA Purification Kit (Promega, Madison, WI, USA) according to the manufacturer's instructions.
Horse feces from two individuals were collected as follows: 100 mg of starting material stored in 70% ethanol were processed for DNA extraction using the QIAamp PowerFecal DNA Kit (QIAGEN GmbH, Hilden, Germany), according to the manufacturer's instructions.
Food samples were raw materials of animal and plant origin, used to industrially prepare bouillon cubes. DNA extractions from those three samples were performed starting from 2 grams of material each, using the DNeasy mericon Food Kit (QIAGEN GmbH, Hilden, Germany), according to the manufacturer's instructions.
DNA purity and concentration were estimated using a NanoDrop Spectrophotometer (NanoDrop Technologies Inc., Wilmington, DE, USA) and Qubit 2.0 fluorometer (Invitrogen, Carlsbad, CA, USA).
DNA library preparations were performed according to manufacturer’s protocol, using the kit Ovation® Ultralow System V4 1–96 (Nugen, San Carlos, CA). Library prep monitoring and validation were performed both by Qubit 2.0 fluorometer (Invitrogen, Carlsbad, CA, USA) and Agilent 2100 Bioanalyzer DNA High Sensitivity Analysis kit (Agilent Technologies, Santa Clara, CA).
Cluster generation, template hybridization, isothermal amplification, linearization, blocking and denaturization and hybridization of the sequencing primers was then performed on Illumina cBot and flowcell HiSeq SBS V4 250 cycle kit, loaded on HiSeq2500 Illumina sequencer producing 125bp paired-end reads (for samples B1, B2, M1, M2 and M3) and 250bp paired-end reads (for samples F1 and F2).
The CASAVA Illumina Pipeline version 1.8.2 was used for base-calling and de-multiplexing. Adapters were masked using cutadapt34. Masked and low quality bases were filtered using erne-filter version 1.4.635.
The bioinformatics analysis performed in the present work are summarized in Figure 1.
Different read lengths among samples may constitute an additional confounder in analysis. To obtain homogeneous read length across samples, reads sequenced belonging to F1 and F2 were trimmed to a length of 125 bp using fastx-toolkit version 0.0.13 before subsequent analysis.
Reduction in coverage was simulated by randomly sampling a fixed number of reads from the full set of reads. Subsamples of 10,000, 25,000, 50,000, 100,000, 250,000, 500,000 and 1,000,000 reads were extracted from the raw reads using seqtk version 1.3. To assess variability, subsampling was performed 5 times for each sample and forr each read abundance.
Classification of reads against the NCBI nt database downloaded on May 2018 was performed using Kraken 2 version 2.0.6-beta36 to estimate species abundance and Shannon diversity index. A simplified representation of species composition was obtained using Krona version 2.637.
Chao138 species richness and Shannon’s diversity39 were estimated using the R package vegan version 2.4.240.
Assembly of the metagenome was performed using megahit version 1.1.241. Completeness of the assembly was assessed using BUSCO version 3.0.242. The proportion of the reconstructed genes was measured as the proportion of genes that were fully reconstructed, plus the proportion of genes that were partially reconstructed. BUSCO analysis was performed on prokaryotic database for all the samples with the exception of M1 (mostly composed by fungi) for which the fungal database was used. Samples B1 and B2 were also compared against the eukaryotic BUSCO database; results for the prokaryotic database are reported.
Unless otherwise specified, all the analysis were performed using R 3.3.343.
Summary statistics for the full samples included in the study are shown in Table 1.
| Sample | N reads | N species | Singletons |
|---|---|---|---|
| B1 | 11,031,061 | 2508 | 1299 |
| B2 | 3,830,083 | 4598 | 1795 |
| F1 | 12,472,553 | 29661 | 14750 |
| F2 | 10,780,450 | 25608 | 12374 |
| M1 | 1,898,011 | 3207 | 1469 |
| M2 | 1,558,975 | 9638 | 3377 |
| M3 | 1,867,879 | 5567 | 1999 |
The number of reads obtained in the samples selected for the present study ranged from slightly more than 1 million (sample M2) to more than 12 million (sample F1). Our subsampling, ranging from 10,000 to 1,000,000 reads, led to a reduction in size of 36% (1,000,000 out of 1,558,975) in M2 to 0.08% of the original size (10,000 reads out of 12,472,553) in F1.
Samples used in this study had different levels of species composition (Figure 2). Some samples, such as M1, B1 and B2 were dominated by a single species, while others, in particular fecal samples, showed high heterogeneity in species composition.
Figure 3 shows the variation of the value of Chao1 estimator, representing the estimated number of species in each sample when varying the number of reads used for the estimation, from the smallest number on the left, to the full dataset on the right. The value of Chao1 estimator for the full dataset is plotted on the right side of the plot, at the rightmost fecal samples F1 and F2 had an estimated number of species greater than 40,000, much higher than all the other samples, for which less than 20,000 species were estimated (less than 10,000 B1, B2, M1 and M3).
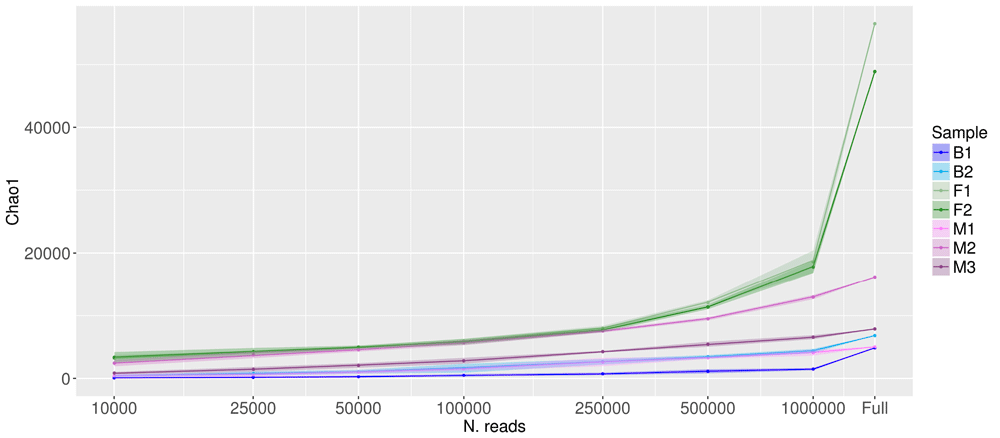
X axis is in log scale, Y axis is in linear scale. Shaded areas represent the confidence limits of resampling experiments. “Full” represents the values obtained with the full set of reads (number of reads per sample listed in column 2 of Table 1).
The effect of downsampling on the estimated number of species has different effects in different samples. For most samples, even a robust downsampling led to only a slight reduction in the estimated species richness. However, for samples F1 and F2, which were characterized by a high number of overall species and rare species, the downsampling led to a significant reduction in the estimated species richness.
Shannon’s diversity index is a widely used method to assess the biological diversity of ecological and microbiological communities. Figure 4 depicts the effect of subsampling on the Shannon’s diversity index. The effect of subsampling on Shannon’s diversity index is smaller than the effect on the estimated number of species. The variation in Shannon diversity index with subsampling is negligible for all samples, even reducing the number of reads from the full size to 100,000 or less.
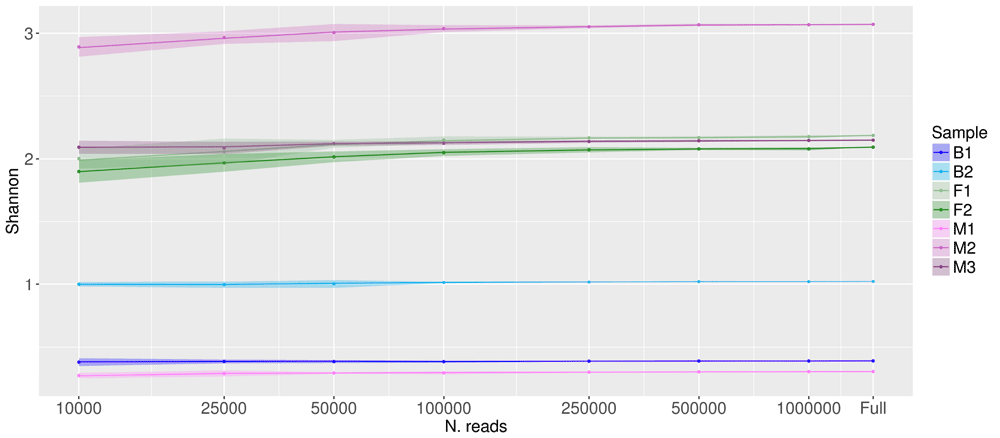
X axis is in log scale, Y axis is in linear scale. Shaded areas represent the confidence limits of resampling experiments. “Full” represents the values obtained with the full set of reads (number of reads per sample listed in column 2 of Table 1).
Figure 5 shows the correlation in species abundance estimation between the full dataset and a reduced dataset of 100,000 reads. The linear correlation coefficient between the two datasets is >0.99 in all the replicates. The plot is in log-log scale to emphasize differences in low abundance species. Only species with frequencies lower than 0.01% (i.e. species represented in 1 read out of 10,000) show some effect of subsampling on the relative abundance estimation. All the seven samples share a similar behavior.
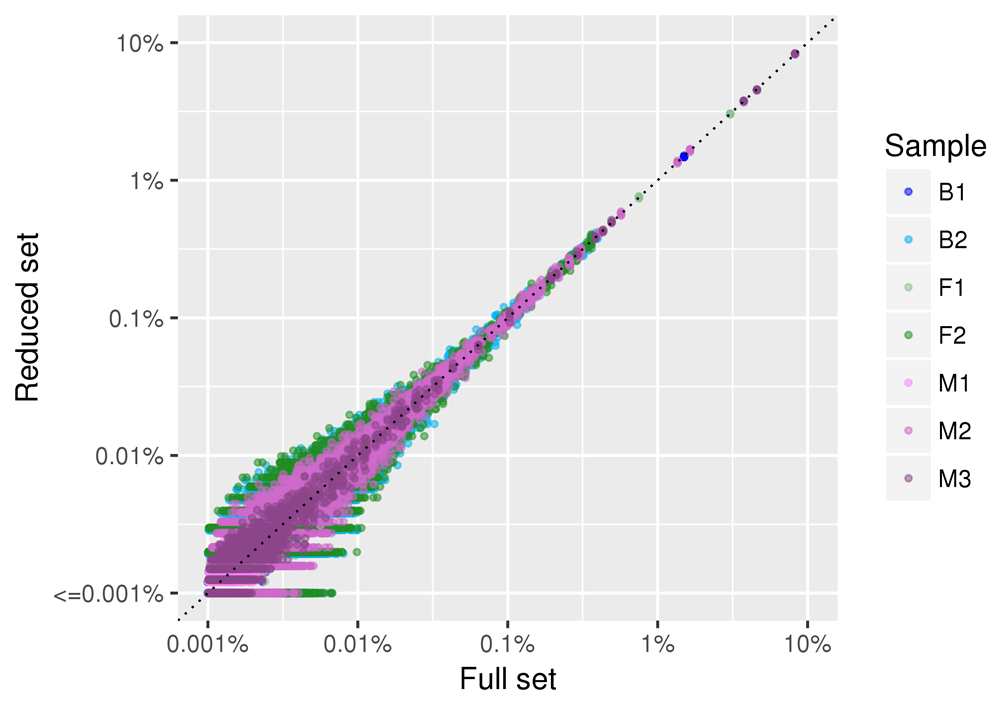
Data for all the five replicates of the subsampling are plotted. Each point (colored by sample of origin) represents a given species. The position on the X axis represents the relative abundance of the species in the full dataset, and the position on the Y axis represents the relative abundance of the species in the samples obtained by randomly sampling 100,000 reads. Both axis are plotted in log scale to facilitate visualization of low abundance species.
In Figure 6 we show the results obtained by reducing the number of sampled reads to 10,000 reads per sample. Similar to what we observed for larger subsamples, the linear correlation coefficient between species abundance estimate in the full and the reduced dataset was high in all the samples (r>0.95) and in all the replicated subsampling. The abundance of species with frequency greater than 1/1000 (0.1%) is correctly estimated in the subsamples, while for rare species the estimate is not precise. Species with frequencies <0.01% are by definition absent in the subsample obtained with 10,000 reads, and were arbitrarily set to a frequency of 0.001% to provide the reader with an idea on their abundance and distribution in the original sample.
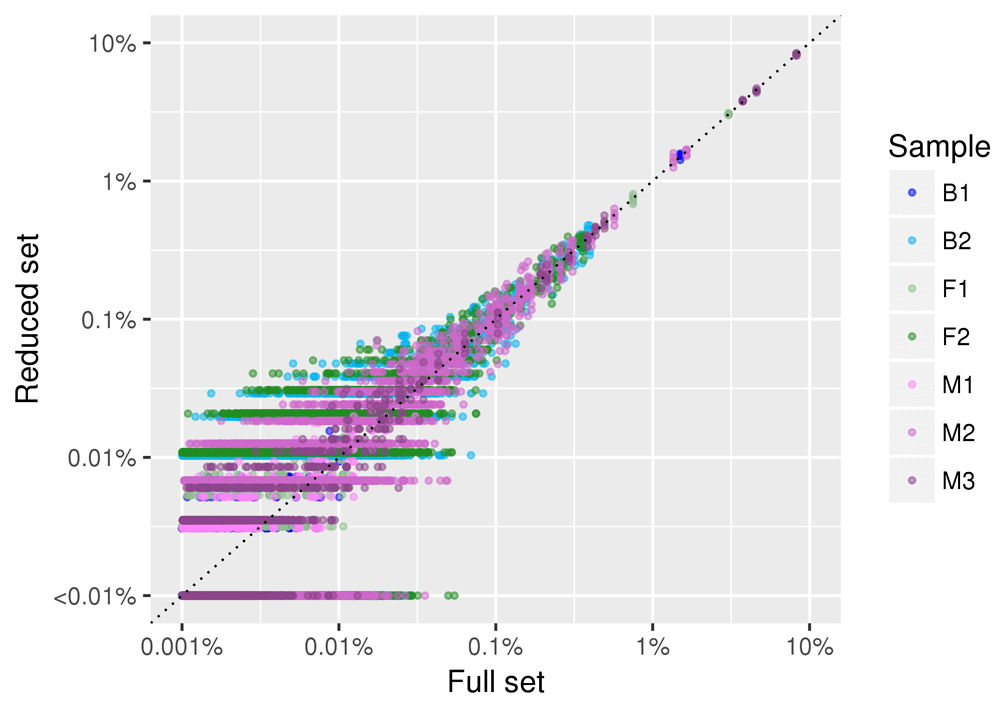
Data for all the five replicates of the subsampling are plotted. Each point (colored by sample of origin) represents a given species. The position on the X axis represents the relative abundance of the species in the full dataset, and the position on the Y axis represents the relative abundance of the species in the samples obtained by randomly sampling 10,000 reads. Both axis are plotted in log scale to facilitate visualization of low abundance species.
While characterizing and measuring species present in a complex matrix is an important task, some studies aim at reconstructing (partially or entirely) the metagenome via a de novo approach. We thus investigated the effect of coverage reduction on this task. We reconstructed de novo the metagenome of the full and reduced datasets, and compared the reconstructed genomes. Results are summarized in Figure 7. As expected, the size of the assembly is strongly influenced by the read number. Assemblies obtained using the full set of reads had a size ranging from slightly more than 1 Mb (sample B1) to nearly 100 Mb (F1 and F2). A decrease in the number of reads used for the assembly lead to a steady decrease in assembly size in all samples, although with different slopes. Assembly sizes obtained using 1,000,000 reads ranged from less than 1 Mb (F1 and F2) to slightly more than 10 Mb (M1), and those obtained using 100,000 reads ranged from less than 100 Kb (F1 and F2) to less than 1 Mb (all the remaining samples).
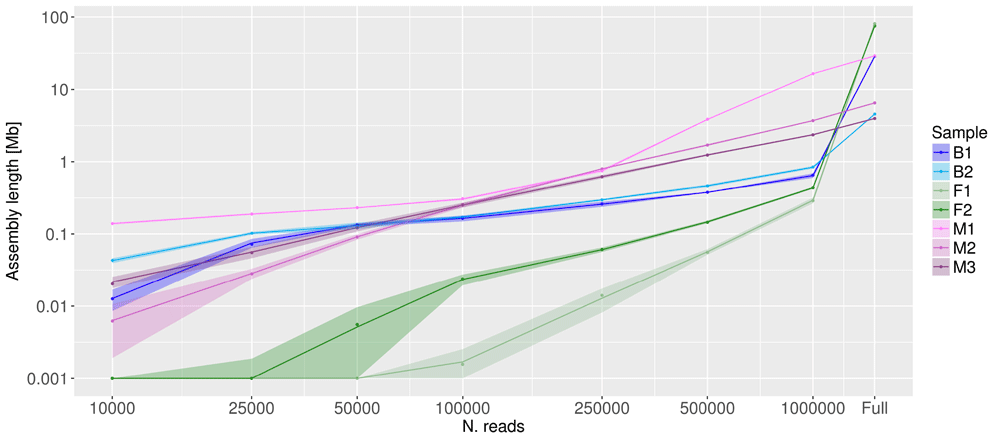
X and Y axes are in log scale. Shaded areas represent the confidence limits of resampling experiments. “Full” represents the values obtained with the full set of reads (number of reads per sample listed in column 2 of Table 1).
However, the total assembly length is not necessarily a sufficient measure to describe assembly goodness and completeness42,44. Since we are interested in assessing the completeness of the reconstructed metagenome, we used BUSCO to report the proportion of genes covered by any given assembly42. Figure 8 reports the proportion of metagenome completeness estimated by BUSCO from full and from the reduced dataset obtained by randomly sampling 1,000,000 reads. The prokaryotic BUSCO dataset was used for all samples with the exception of sample M1, composed prevalently by a mushroom, for which the fungal BUSCO database was used. The full samples F1 and F2 reconstructed a fairly complete proportion of the BUSCO genes (>90%), while the reduced dataset reconstructed less than 20%.
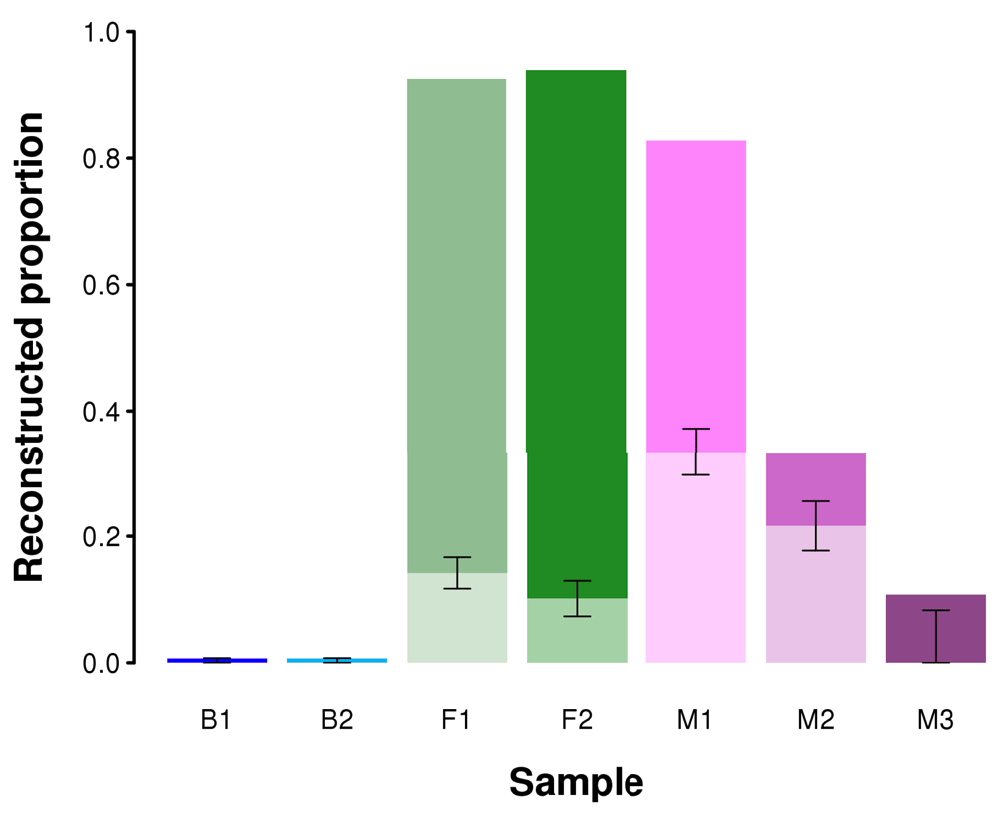
Error bars are based on the five replicate experiments performed for each sample.
Similar trends can be observed with other datasets. Given the lower number of reads sequenced in other samples, the performance in reconstructing the BUSCO genes was generally poor, but reducing to 1 million reads led to a further decrease in performance, suggesting that this is a clearly suboptimal number of reads. Samples B1 and B2 show a very poor performance because the prokaryotic organisms in the sample are very rare contaminants. Being derived from fetal human cell cultures, a large portion of the metagenome is constituted by human sequences, but given the very small ability in reconstructing de novo a genome as large as the human one, the proportion of reconstructed BUSCO genes is very low (<5% both for prokaryotic and eukaryotic BUSCO genes).
The aim of the present work was to assess the reliability of low-depth shotgun metagenome sequencing for the characterization of complex matrices, as follows: 1) determining diversity and species richness in complex matrices; 2) estimating abundance of the species present in the complex matrix, and 3) reconstructing de novo the genome of the species present in the samples. We selected seven heterogeneous complex samples, sequenced at varying coverage (ranging 1 to 12 million reads). Shotgun metagenomics experiments—often aiming at reconstructing de novo the studied metagenome—have a tendency to generate a very high number of reads per sample10. Compared to such studies, all of our samples have relatively shallow coverage of the metagenome, and we tested if even lower coverage could still provide reliable answers to the three main questions listed above.
We used Chao1 as an indicator of species richness and Shannon’s diversity index as an estimator of species diversity, and we measured their variation when reducing the number of reads used for the experiment.
An important detail to be considered here is the fact that the two indices behave differently in the full and the reduced samples. We provide an explanation regarding the reasons of this difference.
Chao1 estimator is obtained as
Where Sobs is the number of observed species in the sample, f1 is the number of species observed once, and f2 is the number of species observed twice.
Shannon diversity index is estimated as
Where N is the total number of species and pi is the frequency of the species i.
Thus, the Chao1 index is heavily affected by the number of rare species that are identified and not from the relative frequencies of the most abundant species, while the Shannon diversity index is affected more by variation in the frequencies of highly abundant species than by the disappearance of rare species.
Samples F1 and F2 are characterized by a very large number of observed species (29,661 and 25,608, respectively), while all the other samples have lower number of species, ranging from 2508 in B1 to 9638 in M2. Chao1 captures this differences, showing that F1 and F2 have greater diversity estimates. The Shannon diversity index, on the contrary, relies not only on the number of observed species, but also on the frequency distribution, and for a given number of species reaches its maximum for equifrequent species. Therefore, samples that have a relatively high number of common species with comparable frequencies tend to have high Shannon’s diversity indices.
As an example the number of species with a frequency greater than 0.1% was 23 in sample F1 and was 55 in sample M2. Thus, in spite of a much lower number of species in M2 compared to F1, the Shannon diversity is higher in M2 than in F1. Given the differences in behavior between the two indices in certain conditions, we decided to use both of them to have a more complete information on sample diversity when decreasing coverage. Our results show that a substantial reduction of coverage can be safely achieved without compromising the ability of estimating species richness and abundance (Figure 3 and Figure 4), although the estimated number of species is moderately affected by coverage reduction.
We then set out to assess the changes in the estimated relative frequency of each individual species when reducing the number of sequenced reads. Accurate estimate of the relative abundance of each species is an important task when the aim is a) to detect species with a relative abundance above any given threshold, b) to differentiate two samples based on different abundance of any given species composition, or c) to cluster samples based on their species composition. Our results show that even reducing sequencing to 100,000 reads, species abundances as low as 0.01% can be reliably estimated.
The last questions to which we sought to answer is if a reduction in the sequencing coverage would have a deleterious effect on the ability of de novo assembling the metagenome. Our results show that downsampling had a strongly negative effect on the total length of the reconstructed metagenome and on the proportion of BUSCO genes reconstructed with the metagenome assembly.
BUSCO is widely used for assessing the completeness of genome and transcriptome assemblies for individual organisms, and has benchmark datasets for several lineages. It is possible that using BUSCO for assessing completeness of a metagenomics assembly, including both eukaryotic and prokaryotic organisms, results in an underestimation of the completeness of the reconstruction. However, the aim of the present work is not the absolute estimation of the completeness of the metagenomics assembly, but rather the relative variation observed when using a subsample of reads. Our results indicate that even using 1,000,000 reads is clearly suboptimal in terms of fully sampling the genes present in the complex matrices. This observation needs to be taken into account in the phase of experimental design. Our conclusions also affect research aimed at reconstruction of an interesting part of the meta-genome, such as genes involved in antibiotic resistance24. The decrease in performance observed in the reconstruction of BUSCO genes will be likely observed for the reconstruction of other gene categories. Researchers aiming at a de novo reconstruction of the metagenome (although partial) must keep in mind that several millions of reads are needed to attain reliable results.
In the present work we tested the feasibility of using metagenome shotgun shallow high-throughput sequencing to analyze complex samples for the presence of eukaryotes, prokaryotes and virus nucleic acids with the aim of monitoring, diagnosis, surveillance, quality control and traceability.
We show that, if the aim of the experiment is a taxonomical characterization of the sample or the identification and quantification of species present in it, then a low-coverage WGS is a good choice. On the other hand, if one of the aims of the study relies on de novo assembly, then a higher number of reads is required. We do not provide here a suggestion on the number of reads that are needed when the aim is the (partial) reconstruction of the meta-genome, as it depends on several factors (number of species in the sample, their genome size, and their abundance, length of the sequencing reads, quality of the DNA) and this estimation needs to be performed for each experiment based on detailed understanding of the experiment aims and of sample characteristics.
Raw reads are available at NCBI Sequence Read Archive. Samples F1 and F2 are available under accession number SRP163102: https://identifiers.org/insdc.sra/SRP163102; samples B1 and B2 are available under accession number SRP163096: https://identifiers.org/insdc.sra/SRP163096; and samples M1, M2 and M3 are available under accession number SRP163007: https://identifiers.org/insdc.sra/SRP163007.
Metagenome sequencing of B1 and B2 (MPRV vaccines, Prorix Tetra, GlaxoSmithKline) was financed by Corvelva (non-profit association, Veneto, Italy), in the frame of a contract work with IGA Technology Services. No other grants were involved in supporting the work.
The funders had no role in study design, data collection and analysis, decision to publish, or preparation of the manuscript.
The authors would like to thank Dr Loretta Bolgan for fruitful scientific discussions and Corvelva (non-profit association, Veneto, Italy) to give us the permission to use their own metagenome sequencing data (samples B1 and B2) for the paper purposes; Dr Federica Cattapan (Mérieux NutriSciences Italia and Chelab S.r.l., Italia) to provide the DNAs of M1, M2, M3 samples and Dr Carol Hughes (Phytorigins Ltd., United Kindom) to give us the biological samples F1, F2 and to both of them to give us the permission to use their samples for whole metagenome sequencing and analysis.
| Views | Downloads | |
|---|---|---|
| F1000Research | - | - |
|
PubMed Central
Data from PMC are received and updated monthly.
|
- | - |
Is the rationale for developing the new method (or application) clearly explained?
No
Is the description of the method technically sound?
Partly
Are sufficient details provided to allow replication of the method development and its use by others?
No
If any results are presented, are all the source data underlying the results available to ensure full reproducibility?
Yes
Are the conclusions about the method and its performance adequately supported by the findings presented in the article?
Partly
Competing Interests: No competing interests were disclosed.
Reviewer Expertise: microbial ecology, metabarcoding sequencing, NGS data analysis, bacterial communities, fungal communities
Is the rationale for developing the new method (or application) clearly explained?
Yes
Is the description of the method technically sound?
No
Are sufficient details provided to allow replication of the method development and its use by others?
Partly
If any results are presented, are all the source data underlying the results available to ensure full reproducibility?
Yes
Are the conclusions about the method and its performance adequately supported by the findings presented in the article?
No
Competing Interests: No competing interests were disclosed.
Reviewer Expertise: Genomics, Transcriptomics, Metagenomics, Bioinformatics
Alongside their report, reviewers assign a status to the article:
| Invited Reviewers | ||||
|---|---|---|---|---|
| 1 | 2 | 3 | 4 | |
|
Version 4 (revision) 22 Jan 20 |
read | read | ||
|
Version 3 (revision) 29 Jul 19 |
read | read | ||
|
Version 2 (revision) 22 Mar 19 |
read | read | ||
|
Version 1 08 Nov 18 |
read | read | ||
Provide sufficient details of any financial or non-financial competing interests to enable users to assess whether your comments might lead a reasonable person to question your impartiality. Consider the following examples, but note that this is not an exhaustive list:
Sign up for content alerts and receive a weekly or monthly email with all newly published articles
Already registered? Sign in
The email address should be the one you originally registered with F1000.
You registered with F1000 via Google, so we cannot reset your password.
To sign in, please click here.
If you still need help with your Google account password, please click here.
You registered with F1000 via Facebook, so we cannot reset your password.
To sign in, please click here.
If you still need help with your Facebook account password, please click here.
If your email address is registered with us, we will email you instructions to reset your password.
If you think you should have received this email but it has not arrived, please check your spam filters and/or contact for further assistance.
Comments on this article Comments (0)