Keywords
Influenza, influenza epidemic, child, adolescent, school closure, school holidays, absenteeism
This article is included in the Emerging Diseases and Outbreaks gateway.
Influenza, influenza epidemic, child, adolescent, school closure, school holidays, absenteeism
In 2009, the United Kingdom experienced a summer influenza pandemic, with the National Health Service resorting to pharmacy dispensed oseltamivir to slow the growth. However, when schools closed in August for the six-week summer break, the epidemic dropped to almost zero within a few weeks1. This was an extreme example of an association that has been documented in other countries, though generally for shorter closures2–4. A 2013 review of both deliberate and non-deliberate school closures concluded that even without co-interventions, closure of schools could reduce flu transmission during an outbreak3,5.
The association of school closure and influenza rates has been only sparsely documented in Australia, partly because school holidays generally fall outside the peak influenza period. However, 2019 saw an early epidemic of influenza in Australia with rates around five times normal for the May-July period, with consequent hospitalisation and deaths also increased. Because of the early high rates, winter influenza in 2019 also coincided with the mid-year school breaks, which appeared to be associated with a dip in influenza incidence.
To explore any relationship between the holiday school closure and influenza cases, we examined the relationship between changes in influenza incidence with the school closure dates in 2019 using the different holiday dates that apply in the Australian states and territories.
Influenza is a notifiable disease in all Australian states and territories6. We collected influenza data notified weekly to state and territory health departments, for the period of week 19 (mid-May) to week 35 (early September) 2019, which corresponds to the flu season in Australia.
We included data from five states (New South Wales, Queensland, Victoria, South Australia, Western Australia) and one territory (Australian Capital Territory); we excluded data from one state (Tasmania) and one territory (Northern Territory) due to paucity of available data and small population sizes.
States and territories differ in how they collect and report data on flu cases. New South Wales7 and Queensland8 report the number of samples that test positive for Influenza A and B (lab-confirmed); Australian Capital Territory9 reports the number of influenza (lab) notifications to the state; and Western Australia10, Victoria11 and South Australia12 report the number of lab-confirmed influenza cases (strains unspecified).
We collected flu data as it was reported by each jurisdiction. We collected data on public school closures between week 19 and week 35 from each state or territory’s education department website.
Weekly, numerical flu data were available from reports produced by the Health Departments in New South Wales, Queensland, Western Australia, Victoria, and Australian Capital Territory. For South Australia, the number of lab-confirmed influenza cases for weeks 19–24 were extracted from a figure (using webplotdigitiser13) since weekly numerical data were available only for weeks 25–35. Data on school holidays were extracted from each state or territory’s website. Raw data are provided (see Data availability section)14.
Due to differences in the population numbers of each state and territory, differences in the methods of data collection, and insufficient number of states to reliably fit a random effects model, analysis was conducted separately by state.
We used segmented regression15 to model the weekly counts and specified a negative binomial distribution to account for overdispersion due to autocorrelation. Explanatory factors included the linear effect of week (slope), initial effect of vacation (change in level), change in linear effect of week after start of vacation (change in slope), initial effect of returning to school, and change in linear effect of week after school return (Appendix 2, Extended data)16. Goodness-of-fit of the models was assessed by plots of observed versus expected counts, plots of residuals versus predicted values, and Pearson’s Chi-square test. The main exposure for our analysis was the July school vacation period of two weeks. Due to the delay from exposure to the virus to confirmation of infection status, we included a lag of one week17. The effect of school vacation is reported as a percentage change in level (with 95% confidence interval) as well as a percentage change in slope (with 95% confidence interval). We hypothesized that the vacation period (lagged by one week) would lead to reductions in weekly counts of influenza cases.
In a separate analysis, for each state, we calculated the change in weekly counts from the previous week and dichotomized into decreases versus increases (or no change). For example, a change from 100 influenza cases in the previous week to 50 influenza cases in the current week would be classified as a decrease. The proportion of decreases were then compared for each of three periods (pre-vacation, vacation, post-vacation) using Fishers exact test.
Statistical analysis was conducted using SAS University Edition 9.4 for Windows.
Figure 1 shows the rates of influenza for the included states and territory. Figures for each individual state or territory are provided in Appendix 3, Extended data16.
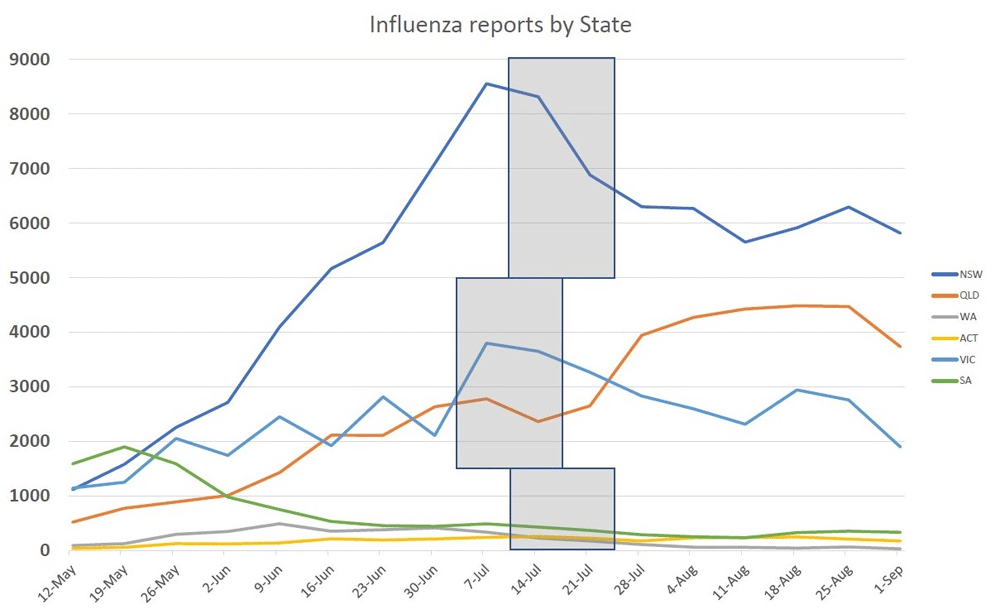
NSW, New South Wales; QLD, Queensland; WA, Western Australia; ACT, Australian Capital Territory; VIC, Victoria; SA, Southern Australia.
The estimates for the initial effect and the subsequent slopes (Table 1) show significant declines for all states except South Australia, which had already passed its peak by the time of the school holidays (Appendix 3, Extended data)16. The models showed acceptable goodness-of-fit (Appendix 4, Extended data)16 with Pearson’s Chi-square tests all indicating insufficient evidence of lack of fit (P>0.05).
| State | Change in level due to school vacation* | Change in slope due to vacation* |
|---|---|---|
| NSW | -50% (-35%, -61%); P<0.0001 | -27% (-2%, -46%); P=0.037 |
| QLD | -41% (-27%, -52%); P<0.0001 | -9% (15%, -29%); P=0.41 |
| VIC | -2% (41%, -32%); P=0.91 | -21% (20%, -48%); P=0.27 |
| WA | -65% (-20%, -85%); P=0.012 | -44% (43%, -78%); P=0.22 |
| SA | 28% (-13%, 90%); P=0.21 | -6% (50%, -41%); P=0.80 |
| ACT | -41% (-11%, -61%); P=0.011 | -35% (5%, -60%); P=0.08 |
For the analysis of changes in weekly influenza counts from the previous week (as described in the statistical methods section, third paragraph) for all states combined, there were 19 (33%) decreases pre-vacation; 11 (92%) decreases during the vacation; and 19 (59%) decreases post-vacation (P=0.0002).
The data on influenza rates by age group (Figure 2) show the first decline during school holidays is seen in the school aged (5–19 years) population, with the decline in the adult (20–64 years) population being smaller and following a further week later, and with even smaller and delayed drops in the infant (1–4) and elderly (65+ years) age groups. We did not have access to the state specific age bands, and hence have indicated the school closure dates with the largest population groups.
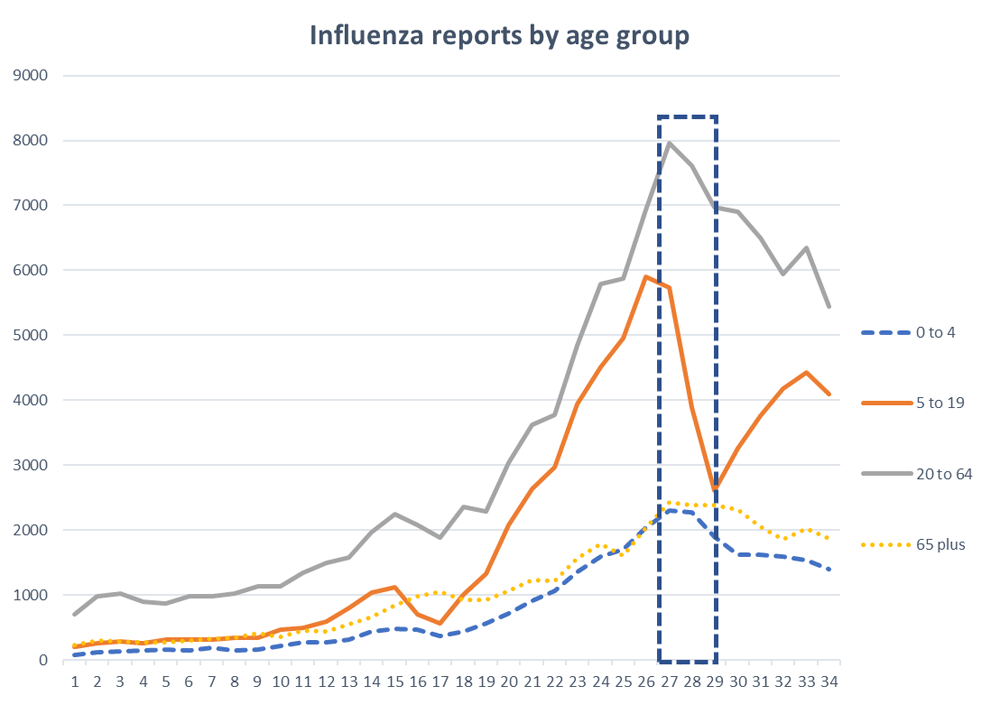
The 2019 Australia influenza notification data show a significant association between school holidays and declines in influenza incidence in most states in Australia. We also found the earliest and largest declines in influenza incidence were in the school aged group (5–19 years), with still later and smaller declines in the adult group (20–64), and least impact on the preschool and over 65’s.
Our findings are consistent with previous reports3 of school closure for both usual holiday periods and emergency closure for epidemics.
The size of the declines is also consistent with those predicted by models of transmission for school closures18. Some states experienced a rebound within weeks of school restarting whereas others saw a continued decline. We do not have a simple explanation for this difference.
The association of school closure with declines in influenza has several potential explanations besides a causal effect. First, cases of influenza might be underreported because of delayed presentation or non-presentation during the school holiday period, for example, because with parents able to care for them they do not attend for medical certificates. However, if this were true, we would expect to see an immediate restart after school returns, which is not the case. Second, it could be because of other societal changes, such as parents also being on holiday and hence less transmission at work. However, if this were true, we would expect to see a simultaneous reduction in both child and adult cases. A final issue is that, even if reduction in incidence is real, it not clear whether there is a net annual decrease or merely a delay in total annual cases.
There are some limitations to both our data and the analysis. Good quality, numerical weekly flu data were unavailable for all states – e.g., South Australia reports its data as a mix of figures and numbers. This may have introduced some errors into the accuracy of the numbers for those states. We contacted the Australian National Notifiable Diseases Surveillance System, which coordinates the national surveillance of influenza in Australia, to obtain raw data for each state and territory. However, the raw data underlying the notifications for 2019 will not be available for release until July 2020. There is also likely to be differences in the accuracy of different states’ data, due to the different methods of collection. For the analysis, we used a lag of one week to allow for the delay from exposure to the virus to confirmation of infection status17. In a sensitivity analysis we refitted the model without a lag and produced consistent results (Appendix 5, Extended data)16.
Given the size of the effect, these results have important public health implications as no other intervention has comparable effects. Hence closure or extension of holiday periods could be an emergency option for state governments. In addition to encouraging flu vaccination, the Centres for Disease Control has a number of suggestions in their guidance, such as encouraging students and staff to stay home when sick, liberalising sickness policies during epidemics, encouraging respiratory etiquette, encouraging hand hygiene, regular cleaning of shared surfaces such as door handles and faucets, and providing a “sick room” to quarantine students with flu-like illnesses19. An additional strategy is to consider face masks, which, with hand hygiene, appear to substantially reduce transmission. All these strategies would need to be triggered by health departments to schools at an appropriate point in an epidemic or pandemic.
Bond University Research Portal: Australian state influenza notifications and school closures in 2019: Appendix 1 – Underlying data. https://doi.org/10.26139/5c47ae4cd8e1614
Bond University Research Portal: Australian state influenza notifications and school closures in 2019: Appendix 2–5 – Extended data. https://doi.org/10.4225/57/555d781f8f2a316
Data are available under the terms of the Creative Commons Attribution 4.0 International license (CC-BY 4.0).
| Views | Downloads | |
|---|---|---|
| F1000Research | - | - |
|
PubMed Central
Data from PMC are received and updated monthly.
|
- | - |
Provide sufficient details of any financial or non-financial competing interests to enable users to assess whether your comments might lead a reasonable person to question your impartiality. Consider the following examples, but note that this is not an exhaustive list:
Sign up for content alerts and receive a weekly or monthly email with all newly published articles
Already registered? Sign in
The email address should be the one you originally registered with F1000.
You registered with F1000 via Google, so we cannot reset your password.
To sign in, please click here.
If you still need help with your Google account password, please click here.
You registered with F1000 via Facebook, so we cannot reset your password.
To sign in, please click here.
If you still need help with your Facebook account password, please click here.
If your email address is registered with us, we will email you instructions to reset your password.
If you think you should have received this email but it has not arrived, please check your spam filters and/or contact for further assistance.
Comments on this article Comments (0)