Keywords
COVID-19 Pandemic, Beta Regression, Lethality, social determinants.
This article is included in the Emerging Diseases and Outbreaks gateway.
This article is included in the Coronavirus (COVID-19) collection.
COVID-19 Pandemic, Beta Regression, Lethality, social determinants.
COVID-19 is an infectious disease caused by the SARS-CoV-21,2 virus that originated in early December 2019 from the city of Wuhan, the capital of Hubei Province, in China3,4. Its virulence and reproducibility gave the virus a special character, and the WHO declared the disease a pandemic on March 11, 20205, due to the high number of infected people and deaths that it had caused around the world. In comparison, the 2003 outbreak of severe acute respiratory syndrome (SARS) had a fatality rate of about 10% (8,098 cases and 774 deaths), and Middle East respiratory syndrome (MERS) killed 34% of people with the disease between 2012 and 2019 (2,494 cases and 858 deaths)6.
However, even though its death rate is minuscule, COVID-19 so far has caused more deaths (1871) than SARS and MERS combined (1632)6. As such, many epidemiologists, statisticians, mathematicians, and other researchers have focused on forecasting the number of new cases at the regional or global level4,5,7–9 and on detecting possible measures to decrease the probability of contagion and death in the most vulnerable populations3,10. Few studies can determine with sufficient statistical rigour which factors decrease the probability of death from COVID-19 with any level of statistical significance.
The SIR model is on the simplest compartmental models, and many models are derivatives of this basic form. The model consists of three compartments:
S: The number of susceptible individuals. When a susceptible and an infectious individual come into "infectious contact", the susceptible individual contracts the disease and transitions to the infectious compartment. I: The number of infectious individuals. These are individuals who have been infected and are capable of infecting susceptible individuals. R for the number of removed (and immune) or deceased individuals. These are individuals who have been infected and have either recovered from the disease and entered the removed compartment, or died. It is assumed that the number of deaths is negligible with respect to the total population. This compartment may also be called "recovered" or "resistant". This model is reasonably predictive for infectious diseases that are transmitted from human to human.5. With these models, indicators of lethality are also calculated by dividing the number of deaths by the total number of those infected. This simple calculation is called the case fatality rate (CFR).
In practice, when a pandemic enters a territory, the susceptible often do not get sick, do not infect themselves, and do not die as established in the SIR model. Thus, one assumes that other factors are included in the SIR or susceptible, exposed, infected, recovered (SEIR) models (a compartmental deterministic model) that determine the infection and mortality. This would substantially modify the CFR, which is a measure of a disease’s severity and indicates the disease’s importance in terms of its ability to produce death. Given this order of ideas, lethality is calculated as CFR:
Where Nd=Number of deaths from a disease in a given period and Nc=Number of cases diagnosed with the same disease in the same period.
Since each country has different characteristics in terms of the social determinants and the cases and deaths COVID-19 pandemic report is uniform, it is necessary to collect the available information to model the virus’s CFR and identify the factors that statistically increase or modify the risk of death. A model will give researchers a powerful tool to estimate the probability of death from COVID-19 and its causes will give researchers a powerful tool, alongside the existing ones for predicting the number of cases, for decision-making aimed at alleviating the consequences of deadly events. That is why, in this article, we propose to model the CFR for COVID-19 using a mixed beta model and adjust it for some social, geographic, economic, health and demographic variables as social determinants in the global context of the COVID-19 pandemic.
Based on the assumptions that the CFR by country can be affected by socioeconomic factors and by health and non-pharmaceutical measures, and that its behaviour may have varied since the start of the pandemic, a mixed beta11 regression model with random intercept was used to estimate the effects of the explanatory variables on the CFR for COVID-19 in 67 countries. A significance level of 10% was used to identify factors that had a statistically significant relationship with the COVID-19 CFR worldwide, see Table 1.
Data on the number of daily cases and deaths from COVID-19 were obtained from the Johns Hopkins University repository to construct the CFRs by country. The possible predictors of the CFR by country were obtained from the repositories of Population Pyramid, the Word Bank, the World Health Organization and the Topographic Mission Radar Shuttle, as well as from health policy, news and macro data. The seven-day corrected fatality rate was calculated nine times: on April 8, 15, 22 and 29; May 6, 13, 20 and 27; and June 3.
The parameterized beta probability density function, denoted by Y ∼ β(µ, ϕ), in terms of its mean (µ) and precision (ϕ) parameters,12, is given by
0 < y < 1, with 0 < µ < 1,ϕ > 0, E(Y) = µ, Var(Y) = µ(1 − µ)/(1 + ϕ), and γ is as the Gamma function. For a random sample from Yi ∼ β(µ, ϕ), and assuming ϕ is constant, the beta regression model13 is specified by with β =(β1, β2, ..., βp)τ being a vector of the (p) unknown regression coefficients, xi = (xi1 ,..., xip)τ being a vector of (p) known covariates and ηi being a linear prediction. The model specification is completed by the choice of a link function, g(∗) : (0, 1) → IR. We adopt the Logit function g(µ) = log(µ/(1 − µ)). This model does not contemplate possible dependencies such as those induced by multiple measurements on the same observational unit or time.
Including latent random effects on a grouped data structure is a parsimonious strategy, as compared to adding parameters to the fixed part of the model, while still accounting for nuisance effects.
Let Yij denote an observation j = 1, . . . , ni within group i = 1, . . . , q and yi denote a ni -dimensional vector of measurements from the i-th group. Let bi be a q-dimensional vector of random effects, and assume the responses Yi j are conditionally independent with density
and a link function vectors of known covariates xi j and zi j with dimensions (p) and (q), respectively, a (p) -dimensional vector of unknown regression parameters β and the precision parameter ϕ. The model specification is completed by bi|Σ ∼ N(0, Σ) Gaussian random effects.
A model was developed that accounted for the variables’ nature, which is bounded in the interval [0, 1]. A mixed beta model was then assumed to model the CFR, and a step procedure did what for the final selection. The statistical software R version 3.6.3 was used to fit the model, specifically the GAMLSS function. See 14 for more technical details.
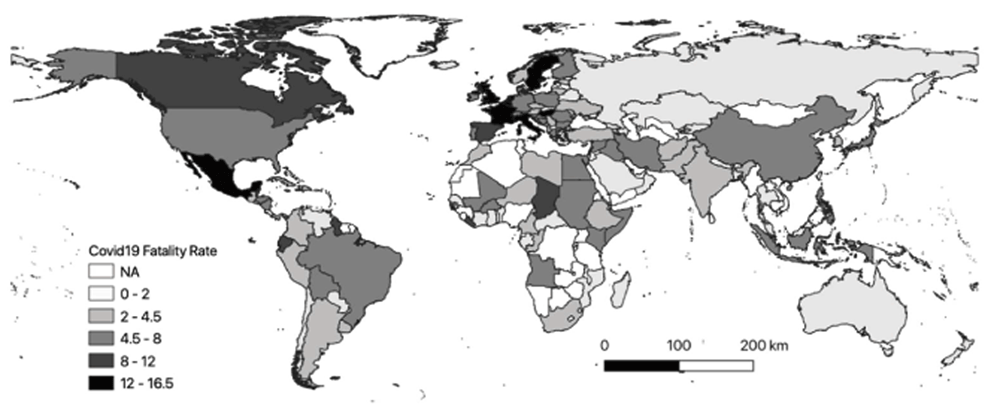
The distribution of CFR by country is shown in Figure 1. For June 3, high CFR stand out in countries like Belgium, France, Mexico, England, Italy, Hungary, Holland and Sweden, as do the low values in Russia, Australia, New Zealand, Malaysia, Chile and Israel.
According to the adjusted model (Figure 2), The variables with greater statistical significance in the model were three (60years, Health and Sex), the CFR increases inversely with health expenditure; and directly the CFR is higher where more people over 60 years of age live and there is a male population predominance.
So too does CFR increase, if the number of beds increases, if there are more diabetes mortality or greater death rate from cardiovascular diseases or death rate from respiratory infections. The CFR increase if there are a greater number of tests for SARS-CoV-2. The register lethality change with the literacy proportion in the country; the CFR increase with poverty, with a greater number of air passengers mobilised, number of days from the first case reported until the beginning of the quarantine, and percentage of people living in the urban area.
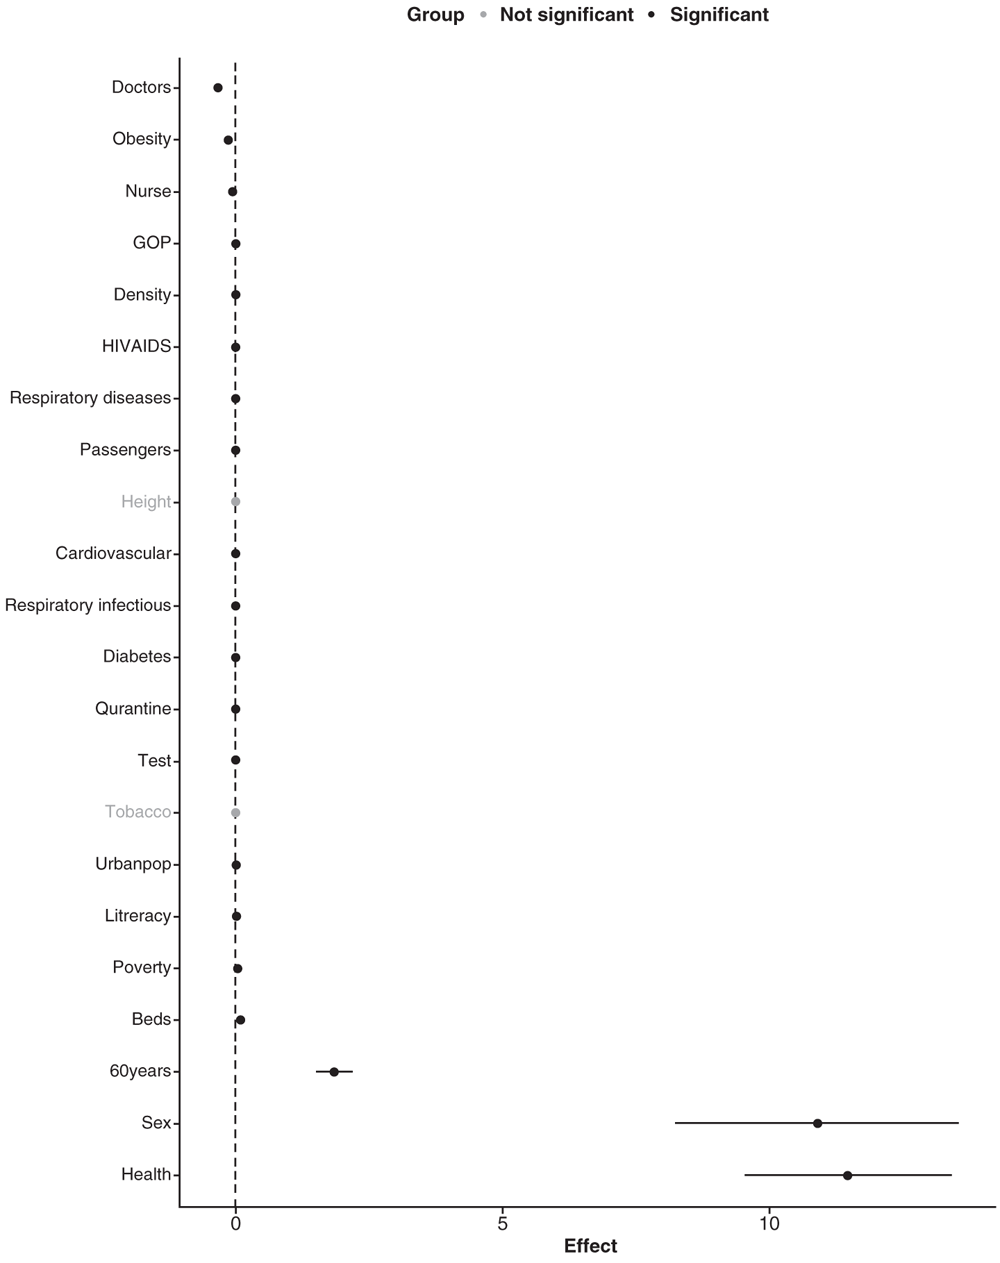
According to the model, the CFR decreased in the countries with the low death rate from respiratory diseases, low obesity rate, low death rate from HIV/AIDS, low physicians per thousand inhabitants, low GDP in health care, low population density and a high number of nurses per thousand inhabitants.
Economic Commission for Latin America and the Caribbean (ECLAC) studied the relationship between mortality in Latin American countries with some characteristics of their social development. A set of four social indicators (hospital beds per 1000 inhabitants, protein consumption, literacy and proportion of households with drinking water) have high linear correlations with life expectancy at birth (r = 0.94)15.
This global analysis of the socioeconomic determinants of COVID-19 mortality had several limitations. Countries had clear differences in their stage of historical development, with different modes of production being found. On the other hand, mortality was highly heterogeneous mortality between countries and in different populations within each country. Finally, the review of the available information indicates that the analysis is not systematic or complete, particularly for the most important analysis categories.
Nevertheless, the available data allow us to reach some important conclusions. For example, adjustment of the presented model allows factors related to COVID-19 case fatality to be identified. The methodology can be replicated with different cut-off dates, include more related factors or be used at sub-national levels.
The calculated case fatality differs from another model’s fatality proposed by researchers at the University Hospital of Lausanne and collaborators (15), who estimated a CFR of 3.59% as of March 1, 2020, considering that an adjustment must be made for the 14 previous days before death to coincide with the date of infection spread and infection, representing the maximum incubation period for the virus. The findings show that current figures may underestimate the potential threat of COVID-19 in symptomatic patients16.
The statistical model used to model fatalities is novel because it allows to analyse the magnitude of the fatality rate over a logistic model that classifies the countries considering the presence and absence of fatalities. Additionally, when considering a beta distribution with excess zeros, countries without reported deaths due to COVID-19 at the analysed cut-off date can be included. Finally, the variability obtained from the partial estimates made by the countries on different dates can be analysed.
The model’s results may have a high sensitivity to the data on reported case fatality from COVID-19, due to the sub-registry inherent to the measurement of infected people, because of the small number of tests carried out in some countries. However, the modelling strategy used is optimal for the type of information considered and can be replicated with new updates to the lethality measurement17.
The population, cases, test number and deaths number by country were obtained from the repository Johns Hopkins University (JHU) at https://github.com/CSSEGISandData/COVID-19/tree/master/csse_covid_19_data.
World Bank data were obtained using the following program: https://github.com/vincentarelbundock/WDI.
R analysis code for this study is available at: https://github.com/DataStatistic/covid19model.
Archived code at time of publication: http://doi.org/10.5281/zenodo.400700518.
License: Creative Commons Attribution 4.0 International license.
| Views | Downloads | |
|---|---|---|
| F1000Research | - | - |
|
PubMed Central
Data from PMC are received and updated monthly.
|
- | - |
Provide sufficient details of any financial or non-financial competing interests to enable users to assess whether your comments might lead a reasonable person to question your impartiality. Consider the following examples, but note that this is not an exhaustive list:
Sign up for content alerts and receive a weekly or monthly email with all newly published articles
Already registered? Sign in
The email address should be the one you originally registered with F1000.
You registered with F1000 via Google, so we cannot reset your password.
To sign in, please click here.
If you still need help with your Google account password, please click here.
You registered with F1000 via Facebook, so we cannot reset your password.
To sign in, please click here.
If you still need help with your Facebook account password, please click here.
If your email address is registered with us, we will email you instructions to reset your password.
If you think you should have received this email but it has not arrived, please check your spam filters and/or contact for further assistance.
Comments on this article Comments (0)