Keywords
facility-based delivery, safe delivery, skilled birth delivery.
facility-based delivery, safe delivery, skilled birth delivery.
Maternal morbidity and mortality is a global health concern (World Health Organization, 2017). Every day in 2017, around 830 mothers died due to pregnancy and childbirth (World Health Organization, 2018). The United Nations Sustainable Development Goals set a target to reduce maternal deaths to 70 per 100,000 live births by 2030 (Nations, 2015). In Indonesia, the maternal mortality rate is still high, at 305 per 100,000 live births (BPS, 2015b). A higher rate was found in the eastern part of Indonesia, namely Nusa Tenggara, Maluku, and Papua Island, than in the other islands (BPS, 2015a). One of the major causes of maternal mortality is bleeding, which is followed by eclampsia (Tejayanti et al., 2012). Safe delivery as the critical policy of making motherhood safer requires skilled health professionals and facility-based delivery across the provinces of Indonesia (Efendi et al., 2019; Kementrian Kesehatan RI, 2014). As an archipelago country, institutional delivery and skilled assistant delivery are still a challenge because of the geographical situation (Belton et al., 2014; Ministry of Health [MoH], 2012). To increase safe delivery for Indonesian mothers, the government has set a goal to reach 85% of institutional deliveries in 2019 (Kementrian Kesehatan RI, 2017). Even though the government has not yet set a goal for skilled attendant delivery specifically in this document, it should be assumed that the government demands the highest standard of health attainment.
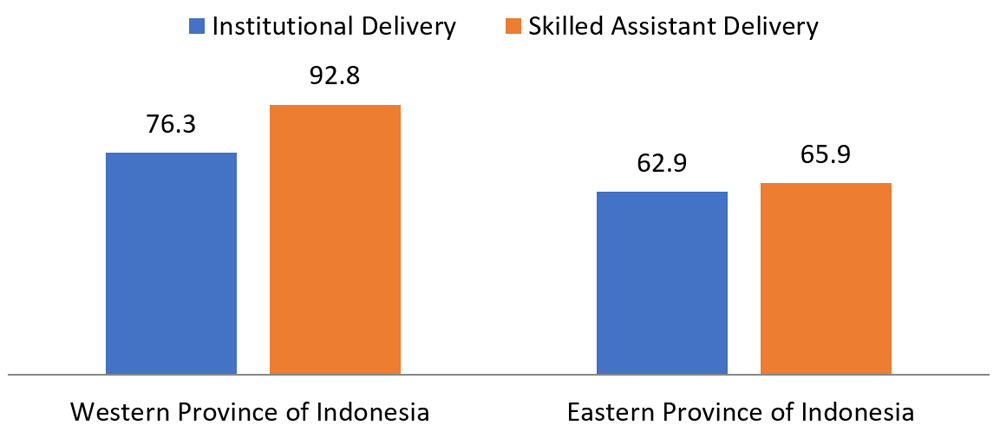
The 2017 IDHS found that there is a gap in coverage of institutional delivery and skilled assistant delivery between western provinces and eastern provinces of Indonesia. Eastern provinces of Indonesia, including Bali, Nusa Tenggara Island, Sulawesi Island, Maluku, and Papua Island, have not reached 70% coverage of safe delivery in either institutional delivery or skilled assistant delivery, as depicted in Figure 1 (BPS et al., 2018).
Studies that examine safe delivery have been conducted in some countries. A study conducted in Ethiopia found that residence, religion, educational level, age at first pregnancy, parity, and antenatal care (ANC) attendance have a significant association with safe delivery service utilization (Abera et al., 2011). Another study conducted in Tanzania reported that in addition to socio-demographic factors, women’s empowerment status contributed to the decision to give birth with a health professional (Shimamoto & Gipson, 2015). In a similar vein, studies in 13 sub-Saharan African countries found that living conditions and women’s autonomy are key factors of maternal healthcare utilization (Iacoella & Tirivayi, 2019). In Indonesia, a study about facility-based childbirth found that educational level, place of residence, working status, involvement in decision-making, economic status, and ANC visits are significantly associated with health facility delivery among women (Efendi et al., 2019). Furthermore, the gap in age and education between a woman and her husband/partner, women’s self-esteem, age at first marriage, and age at pregnancy were found have a high association with institutional delivery among Indonesian women (Kurniati et al., 2018).
The gap in coverage of safe delivery, including institutional delivery and skilled assistant delivery, in western and eastern provinces of Indonesia should be resolved to attain the Sustainable Development Goals by 2030. Therefore, this study aimed to determine safe delivery utilization among Indonesian women in the eastern part of Indonesia.
IDHS ethical clearance was obtained from the Indonesian Ministry of Health (MoH). For this study, permission to use the data was obtained from Inner City Fund (ICF) International. This study used existing IDHS data and re-analysis was done under the original consent provided by the participants. Thus, no further consent was obtained from the participants.
This was an analytical cross-sectional study that used data from the 2017 IDHS. The 2017 IDHS was conducted in 34 provinces in Indonesia from July to December 2017 by the Central Statistics Agency (BPS), National Population and Family Planning Board (BKKBN), and the Ministry of Health with technical help from ICF. The Individual Recode (IR) dataset was downloaded from www.dhsprogram.com after completing registration.
In the 2017 IDHS, a total of 49,627 women were finished the survey. Two-stage cluster sampling was used to select the respondents. Interviews were performed as privately as possible with a detailed manual as reported by ICF (ICF Macro, 2020).
The inclusion criteria for this study were women aged 15–49 years who had their last child in the five years preceding the survey and lived in the eastern provinces of Indonesia. For the purpose of analysis, we divided Indonesia into two greater parts, western and eastern, based on the geographical location. The eastern provinces included Bali, West Nusa Tenggara, East Nusa Tenggara, North Sulawesi, Central Sulawesi, South Sulawesi, Southeast Sulawesi, Gorontalo, West Sulawesi, Maluku, North Maluku, West Papua and Papua. In total, survey data from 2,162 women meeting the criteria were accessed for this study’s analysis.
The dependent variables in this study were facility-based delivery and assisted delivery. Facility-based delivery was divided into two categories: health facility and non-health facility. Health facility delivery or institutional delivery is delivery that is carried out at a heath facility, including public health centers, clinics or maternity homes, and hospitals. The assisted delivery variable was also divided into two categories: health professional and non-health professional. Health professional or skilled assistant delivery is defined as birth delivered with the assistance of skilled providers such as general practitioners, obstetricians, midwives, and skilled nurses.
There were several independent variables in this study. Age difference between man and woman was divided into four categories: woman older than husband, 0–4 years younger, 5–7 years younger, and >7 years younger. Birth rank and interval was divided into five categories: second or third child with interval >2 years; first birth, second or third child with interval ≤2 years; fourth or higher child with interval >2 years; and fourth or higher child with interval ≤2 years. Planning status of births, women who had a birth or several births in the five years prior to their interview were asked whether the pregnancy had been wanted at the time it occurred (wanted then) or whether it had been wanted but had occurred sooner than wanted (wanted later), or whether the woman had wanted no further children at the time (unwanted). Husband/partner’s education attainment was divided into three categories: incomplete primary education/none, complete primary or some secondary, and completed secondary or higher. Husband/partner’s occupation was divided into two categories: agricultural and non-agricultural. Wealth quintile was categorized as poorest, poorer, middle, richer, and richest (Rutstein & Johnson, 2004). Number of household members was divided into two categories: households that have less than four members and households with four or more members. Number of ANC visits was categorized as less than four times and four times or more. Covered by health insurance was divided into two categories: yes and no. Residence was categorized as urban and rural. Women’s empowerment variables, including composite labor force participation, attitude towards domestic violence (wife-beating), decision-making power, and women’s knowledge level, were divided into three categories: poor, moderate, and good. Further details on how these variables were assessed can be found in study as conducted by Sebayang et al. (2019).
The determinants of safe delivery were analyzed using a Chi-square test and binary logistic regression. Both analyses were performed in Stata version 14. The variables were significant at a p-value of 0.05, and the strength of the association was assessed using odds ratio (OR) with a 95% confidence interval (CI).
Among the women who were included in this study, 71.6% used a health facility and 86.2% were assisted by a health professional at their last birth. The majority of the respondents are 0–4 years younger than their husband (41.2%), from the poorest wealth quintile (41.8%), have four or more members in the household (87.6%), are covered by health insurance (64.3%), and live in a rural residence (66.7%). Concerning the husband/partner’s education and occupation, 47.3% have completed secondary or higher education and more than half work in an agricultural occupation (54.1%). For almost half the respondents, their last child was a second or third child with an interval more than two years (44.9%). The majority of respondents had more than four ANC visits (88.4) and their pregnancy was wanted when they became pregnant (82.1%). In terms of women’s empowerment, most respondents have good composite labor force participation (35.7%), a moderate attitude towards domestic violence (34.8%), poor decision-making power (35.3%), and a poor level of knowledge (34.6%). Details about the descriptive characteristics of the respondents are shown in Table 1.
In the bivariate analysis, most of the variables showed a significant association with a p-value of 0.05 with both outcomes: facility-based delivery and assisted delivery. For the facility-based delivery outcome, three variables have a p-value of more than 0.05 (pregnancy was wanted at time of becoming pregnant, number of household members, decision-making power), while for the assisted delivery outcome, four variables were not significant (age difference between man and woman, pregnancy was wanted at time of becoming pregnant, number of household members, decision-making power). Details about the bivariate analysis are shown in Table 2 and Table 3.
| Variable | Non-health facility | Health facility | X2 | ||
|---|---|---|---|---|---|
| N | % | N | % | ||
| Age difference between man and woman | |||||
| Woman older than man | 117 | 26.1 | 333 | 73.9 | 17.23** |
| 0–4 years | 262 | 29.4 | 628 | 70.6 | |
| 5–7 years | 108 | 24.8 | 326 | 75.2 | |
| >7 years | 127 | 32.8 | 261 | 67.2 | |
| Birth rank and interval | |||||
| Second or third child, interval >2 years | 241 | 24.9 | 729 | 75.1 | 200.57*** |
| First birth | 124 | 20.6 | 479 | 79.4 | |
| Second or third child, interval ≤2 years | 48 | 36.8 | 83 | 63.2 | |
| Fourth or higher child, interval >2 years | 156 | 40.6 | 228 | 59.4 | |
| Fourth or higher child, interval ≤2 years | 45 | 60.2 | 29 | 39.8 | |
| Planning status of births | |||||
| Then | 513 | 28.9 | 1261 | 71.1 | 3.51 |
| Later | 68 | 27.8 | 178 | 72.2 | |
| No more | 34 | 23.9 | 108 | 76.1 | |
| Husband/partner’s education attainment | |||||
| Incomplete primary education/none | 143 | 47.9 | 156 | 52.1 | 233.59*** |
| Complete primary or some secondary | 277 | 32.9 | 564 | 67.1 | |
| Completed secondary or higher | 194 | 19.0 | 828 | 81.0 | |
| Husband/partner’s occupation | |||||
| Agricultural | 423 | 36.2 | 746 | 63.8 | 162.94*** |
| Non-agricultural | 191 | 19.2 | 802 | 80.8 | |
| Wealth quintile | |||||
| Poorest | 423 | 46.8 | 480 | 53.2 | 607.20*** |
| Poorer | 105 | 23.2 | 349 | 76.8 | |
| Middle | 45 | 14.3 | 270 | 85.7 | |
| Richer | 29 | 11.3 | 224 | 88.7 | |
| Richest | 13 | 5.6 | 224 | 94.4 | |
| Number of household members | |||||
| <4 members | 67 | 25.2 | 201 | 74.8 | 3.40 |
| ≤4 members | 547 | 28.9 | 1,347 | 71.1 | |
| Number of antenatal care visits | |||||
| <4 visits | 153 | 61.6 | 98 | 38.4 | 328.54*** |
| ≤4 visits | 461 | 24.1 | 1,450 | 75.9 | |
| Covered by health insurance | |||||
| No | 242 | 31.3 | 530 | 68.7 | 10.16* |
| Yes | 373 | 26.8 | 1,017 | 73.2 | |
| Residence | |||||
| Urban | 88 | 12.2 | 631 | 87.8 | 296.56*** |
| Rural | 527 | 36.5 | 916 | 63.5 | |
| Composite labor force participation | |||||
| Poor | 248 | 35.8 | 444 | 64.2 | 123.78*** |
| Moderate | 221 | 31.7 | 477 | 68.3 | |
| Good | 145 | 18.8 | 627 | 81.2 | |
| Attitude toward domestic violence | |||||
| Poor | 237 | 35.1 | 437 | 64.9 | 46.49*** |
| Moderate | 194 | 25.8 | 559 | 74.2 | |
| Good | 184 | 25.0 | 551 | 75.0 | |
| Decision making power | |||||
| Poor | 218 | 28.5 | 546 | 71.5 | 0.64 |
| Moderate | 195 | 27.7 | 508 | 72.3 | |
| Good | 202 | 29.0 | 493 | 71.0 | |
| Women’s knowledge level | |||||
| Poor | 290 | 38.8 | 458 | 61.2 | 145.48*** |
| Moderate | 187 | 26.2 | 527 | 73.8 | |
| Good | 137 | 19.6 | 563 | 80.4 | |
| Variable | Non-health professional | Health facility | X2 | ||
|---|---|---|---|---|---|
| N | % | N | % | ||
| Age difference between man and woman | |||||
| Woman older than man | 56 | 12.4 | 394 | 87.6 | |
| 0–4 years | 125 | 14.0 | 765 | 86.0 | 7.55 |
| 5–7 years | 54 | 12.5 | 380 | 87.5 | |
| >7 years | 63 | 16.3 | 325 | 83.7 | |
| Birth rank and interval | |||||
| Second or third child, interval >2 years | 113 | 11.6 | 857 | 88.4 | |
| First birth | 53 | 8.8 | 550 | 91.2 | 136.16*** |
| Second or third child, interval ≤2 years | 22 | 16.6 | 109 | 83.4 | |
| Fourth or higher child, interval >2 years | 87 | 22.7 | 297 | 77.3 | |
| Fourth or higher child, interval ≤2 years | 24 | 31.9 | 50 | 68.1 | |
| Planning status of births | |||||
| Then | 254 | 14.3 | 1,520 | 85.7 | 5.43 |
| Later | 29 | 11.8 | 217 | 88.2 | |
| No more | 15 | 10.5 | 127 | 89.5 | |
| Husband/partner’s education attainment | |||||
| Incomplete primary education/none | 106 | 35.4 | 193 | 64.6 | 367.17*** |
| Complete primary or some secondary | 130 | 15.5 | 711 | 84.5 | |
| Completed secondary or higher | 61 | 6.0 | 961 | 94.0 | |
| Husband/partner’s occupation | |||||
| Agricultural | 229 | 19.6 | 940 | 80.4 | 155.85*** |
| Non-agricultural | 69 | 6.9 | 924 | 93.1 | |
| Wealth quintile | |||||
| Poorest | 243 | 26.9 | 660 | 73.1 | |
| Poorer | 39 | 8.6 | 415 | 91.4 | 509.25*** |
| Middle | 11 | 3.4 | 304 | 96.6 | |
| Richer | 3 | 1.3 | 250 | 98.7 | |
| Richest | 2 | 0.7 | 235 | 99.3 | |
| Number of household members | |||||
| <4 members | 30 | 11.3 | 238 | 88.7 | 3.24 |
| ≤4 members | 267 | 14.1 | 1,627 | 85.9 | |
| Number of antenatal care visits | |||||
| <4 visits | 102 | 40.5 | 149 | 59.5 | 364.74*** |
| ≤4 visits | 197 | 10.3 | 1,714 | 89.7 | |
| Covered by health insurance | |||||
| No | 121 | 15.7 | 651 | 84.3 | 8.03* |
| Yes | 177 | 12.7 | 1,213 | 87.3 | |
| Residence | |||||
| Urban | 38 | 5.3 | 681 | 94.7 | 139.61*** |
| Rural | 260 | 18.0 | 1,183 | 82.0 | |
| Composite labor force participation | |||||
| Poor | 125 | 18.0 | 567 | 82.0 | |
| Moderate | 119 | 17.0 | 579 | 83.0 | 95.35*** |
| Good | 56 | 7.2 | 716 | 92.8 | |
| Attitude toward domestic violence | |||||
| Poor | 111 | 16.5 | 563 | 83.5 | 20.25** |
| Moderate | 106 | 14.1 | 647 | 85.9 | |
| Good | 80 | 10.9 | 655 | 89.1 | |
| Decision-making power | |||||
| Poor | 119 | 15.6 | 645 | 84.4 | 7.34 |
| Moderate | 92 | 13.1 | 611 | 86.9 | |
| Good | 86 | 12.4 | 609 | 87.6 | |
| Women’s knowledge level | |||||
| Poor | 180 | 24.1 | 568 | 75.9 | 231.52*** |
| Moderate | 74 | 10.4 | 640 | 89.6 | |
| Good | 43 | 6.1 | 657 | 93.9 | |
In the binary logistic regression analysis, delivery at a health facility was associated with several variables. Women who lived in a rural residence [AOR=0.49; 95% CI=0.36-0.66] were less likely to deliver in a health facility. A similar result was found for women whose last child was a fourth or higher child with an interval of two years or under [AOR=0.30; 95% CI=0.19-0.47]. Women from the richest wealth quintile family and those who had four or more ANC visits were five [AOR=5.59; 95% CI=3.37-9.30] and three times more likely to deliver in a health facility [AOR=3.62; 95% CI=2.73-4.79], respectively.
Women who have good composite labor force participation [AOR=1.47; 95% CI=1.15-1.89] and a moderate attitude towards domestic violence [AOR=1.38; 95% CI=1.10-1.73] were more likely to deliver in a health facility. Women whose pregnancy was unwanted when they became pregnant [AOR=1.48 95% CI=1.05-2.08] were also more likely to deliver in a health facility. Details about the binary logistic regression analysis with a facility-based delivery outcome are shown in Table 4.
| Variable | AOR | CI | |
|---|---|---|---|
| Lower | Upper | ||
| Age difference between man and woman | |||
| Woman older than man | Ref | ||
| 0–4 years | 0.88 | 0.69 | 1.11 |
| 5–7 years | 1.14 | 0.88 | 1.46 |
| >7 years | 0.96 | 0.73 | 1.26 |
| Birth rank and interval | |||
| Second or third child, interval >2 years | Ref | ||
| First birth | 1.37** | 1.09 | 1.71 |
| Second or third child, interval ≤2 years | 0.60** | 0.43 | 0.84 |
| Fourth or higher child, interval >2 years | 0.66*** | 0.52 | 0.82 |
| Fourth or higher child, interval ≤2 years | 0.30*** | 0.19 | 0.47 |
| Planning status of births | |||
| Then | Ref | ||
| Later | 1.01 | 0.77 | 1.32 |
| No more | 1.48* | 1.05 | 2.08 |
| Husband/partner’s education attainment | |||
| Incomplete primary education/ none | Ref | ||
| Complete primary or some secondary | 1.23 | 0.94 | 1.60 |
| Completed secondary or higher | 1.26 | 0.94 | 1.69 |
| Husband/partner’s occupation | |||
| Agricultural | Ref | ||
| Non-agricultural | 1.17 | 0.93 | 1.47 |
| Wealth quintile | |||
| Poorest | Ref | ||
| Poorer | 1.94*** | 1.53 | 2.47 |
| Middle | 2.85*** | 2.06 | 3.94 |
| Richer | 3.23*** | 2.25 | 4.64 |
| Richest | 5.59*** | 3.37 | 9.30 |
| Number of household members | |||
| <4 members | Ref | ||
| ≥4 members | 1.02 | 0.75 | 1.39 |
| Number of antenatal care visits | |||
| <4 visits | Ref | ||
| ≥4 visits | 3.62*** | 2.73 | 4.79 |
| Covered by health insurance | |||
| No | Ref | ||
| Yes | 1.15 | 0.95 | 1.38 |
| Residence | |||
| Urban | Ref | ||
| Rural | 0.49*** | 0.36 | 0.66 |
| Composite labor force participation | |||
| Poor | Ref | ||
| Moderate | 1.14 | 0.93 | 1.40 |
| Good | 1.47** | 1.15 | 1.89 |
| Attitude toward domestic violence | |||
| Poor | Ref | ||
| Moderate | 1.38** | 1.10 | 1.73 |
| Good | 1.33* | 1.04 | 1.69 |
| Decision-making power | |||
| Poor | Ref | ||
| Moderate | 0.85 | 0.69 | 1.06 |
| Good | 0.84 | 0.66 | 1.06 |
| Women’s knowledge level | |||
| Poor | Ref | ||
| Moderate | 1.13 | 0.92 | 1.40 |
| Good | 1.17 | 0.93 | 1.47 |
According to the assisted delivery outcome, women whose last child was a fourth or higher child with an interval of two years or under [AOR=0.49; 95% CI=0.29-0.83] were less likely to deliver with a health professional. Women whose husband completed secondary or higher education were two times [AOR=2.18; 95% CI=1.48-3.22] more likely to deliver with a health professional. Likewise, women who had four or more ANC visits and were from the richest wealth quintile were three [AOR=3.83; 95% CI=2.77-5.30] and 15 times [AOR=15.69; 95% CI= 5.53-44.50] more likely to be helped by a health professional, respectively.
Women whose husband worked in a non-agricultural occupation [AOR=1.35; 95% CI=1.00-1.81] were more likely to deliver with a health professional. A similar result was found for women with good composite labor force participation [AOR=1.58; 95% CI=1.11-2.26] and a good level of knowledge [AOR=1.76; 95% CI=1.25-2.46] (Table 5).
| Variable | AOR | CI | |
|---|---|---|---|
| Lower | Upper | ||
| Age difference between man and woman | |||
| Woman older than man | Ref | ||
| 0–4 years | 0.89 | 0.65 | 1.22 |
| 5–7 years | 0.99 | 0.71 | 1.36 |
| >7 years | 1.01 | 0.72 | 1.42 |
| Birth rank and interval | |||
| Second or third child, interval >2 years | Ref | ||
| First birth | 1.28 | 0.93 | 1.76 |
| Second or third child, interval ≤2 years | 0.80 | 0.48 | 1.33 |
| Fourth or higher child, interval >2 years | 0.73 | 0.53 | 1.00 |
| Fourth or higher child, interval ≤2 years | 0.49** | 0.29 | 0.83 |
| Planning status of births | |||
| Then | Ref | ||
| Later | 1.12 | 0.74 | 1.68 |
| No more | 1.58 | 0.96 | 2.59 |
| Husband/partner’s education attainment | |||
| Incomplete primary education/ none | Ref | ||
| Complete primary or some secondary | 1.90*** | 1.42 | 2.55 |
| Completed secondary or higher | 2.18*** | 1.48 | 3.22 |
| Husband/partner’s occupation | |||
| Agricultural | Ref | ||
| Non-agricultural | 1.35* | 1.00 | 1.81 |
| Wealth quintile | |||
| Poorest | Ref | ||
| Poorer | 2.33*** | 1.70 | 3.18 |
| Middle | 5.14*** | 3.19 | 8.28 |
| Richer | 10.84*** | 5.34 | 22.01 |
| Richest | 15.69*** | 5.53 | 44.50 |
| Number of household members | |||
| <4 members | Ref | ||
| ≥4 members | 0.87 | 0.56 | 1.35 |
| Number of antenatal care visits | |||
| <4 visits | Ref | ||
| ≥4 visits | 3.83*** | 2.77 | 5.30 |
| Covered by health insurance | |||
| No | Ref | ||
| Yes | 1.19 | 0.94 | 1.51 |
| Residence | |||
| Urban | Ref | ||
| Rural | 0.84 | 0.54 | 1.30 |
| Composite labor force participation | |||
| Poor | Ref | ||
| Moderate | 0.99 | 0.76 | 1.29 |
| Good | 1.58* | 1.11 | 2.26 |
| Attitude toward domestic violence | |||
| Poor | Ref | ||
| Moderate | 1.24 | 0.94 | 1.63 |
| Good | 1.30 | 0.96 | 1.77 |
| Decision-making power | |||
| Poor | Ref | ||
| Moderate | 0.89 | 0.69 | 1.14 |
| Good | 0.99 | 0.73 | 1.34 |
| Women’s knowledge level | |||
| Poor | Ref | ||
| Moderate | 1.54** | 1.13 | 2.11 |
| Good | 1.76** | 1.25 | 2.46 |
Delivery was regarded as safe when it was attended by a skilled birth attendant and took place in a health facility. This study found that several variables have a significant association with facility-based delivery and assisted delivery. Women from the richest wealth quintile were more likely to have a delivery in a health facility than those from the poorest wealth quintile. This finding is consistent with that of a previous study in Indonesia. The wealth index of the household would contribute to the access to health care services, including institutional delivery (Caulfield et al., 2016; Do et al., 2015; Efendi et al., 2019; Roro et al., 2014). Women from the richest wealth quintile were more likely to have a delivery with a skilled assistant than those from the poorest wealth quintile. This finding is consistent with that of a previous study conducted in Bangladesh (Muhammed et al., 2017). Women from low-income families may find it difficult to pay for a skilled assistant delivery, so they prefer to give birth without professional assistance (Muhammed et al., 2017). Therefore, the coverage of health insurance must be enhanced so that women in all the wealth quintiles can have equal access to health care services.
A higher child rank and interval of ≤2 years was associated with a lower chance of women having a delivery in a health facility and being assisted by a health professional. This result is similar to those of studies conducted in Ethiopia and Nigeria (Abera et al., 2011; Ononokpono & Odimegwu, 2014). Women with a higher child rank will have more experience with pregnancy and delivery, so they feel that they have the confidence to have a delivery outside a health facility (Abera et al., 2011). Another argument is that women have limited access to health services due to the burden of their economic situation (Ononokpono & Odimegwu, 2014). The results for delivery with a skilled birth attendant are similar to those of studies conducted in Sudan and Ethiopia (Mustafa & Mukhtar, 2015; Wilunda et al., 2015). Women with a higher birth rank tend to rely on their experience from previous pregnancies, believing they already know about childbirth. Consequently, they choose to give birth without professional assistance (Mustafa & Mukhtar, 2015). Review studies conducted in African countries also highlighted the link between higher parity and lower likelihood of facility-based delivery (Moyer & Mustafa, 2013). Therefore, health education about safe delivery should prioritize mothers with a high child rank by giving them greater access to free health care services.
Women who had more than four ANC visits during their pregnancy were found to be three times more likely to have a safe delivery. This is consistent with the results of studies conducted in Uganda and Ethiopia (Abera et al., 2011; Atusiimire et al., 2019). Furthermore, a population-based study conducted in Bangladesh had a similar result, which emphasized the positive effect of the ANC on utilization of health facility-based delivery (Pervin et al., 2012). The ANC can prevent unsafe delivery because it will provide health education for the mother, giving information and recommending the place of delivery according to the mother’s and fetus’s condition (Atusiimire et al., 2019). Women who had more than four ANC visits during their pregnancy were found to be more likely to have a skilled assistant delivery. This is consistent with the result of a study that was conducted in Kenya (Gitimu et al., 2015). ANC attendance will influence the decision of the mother to have an assisted delivery because the ANC emphasizes the importance of safe delivery (Gitimu et al., 2015). ANC visits must be optimized for pregnant women so that mothers are more exposed to information about safe delivery. The information that the mother receives will influence the decision on where to deliver the baby. Therefore, a minimum number of ANC visits should be given to all pregnant women so they can monitor the condition of the baby and have more knowledge about safe pregnancy and delivery.
Another finding was that women who wanted no more pregnancies when they became pregnant were more likely to give birth in a health facility. This finding is consistent with that of a study conducted in Egypt (Marston & Cleland, 2003). However, it is inconsistent with the results of a study conducted in Bangladesh, which showed that women who have an unintended pregnancy were less likely to visit an ANC service and more likely to have a home delivery (Kamal, 2013). There was no study that explained this issue, as it may be related to the social norms and health system of the country itself. Therefore, this topic should be analyzed further by considering other variables.
Women from a rural residence were found to be less likely to have a delivery in a health facility. This finding is similar to those of previous studies conducted in Bangladesh and Indonesia (Efendi et al., 2019; Kamal, 2013; Kenea & Jisha, 2017). Living in an urban residence allows easier access to health facilities than living in rural areas. In addition, access to information is easier in urban areas so information about safe delivery can be spread more easily (Kamal, 2013). Therefore, the gap between rural and urban areas should be taken into consideration by the government regarding the issue of maternal and child health.
Women who had good composite labor force participation and a good attitude towards domestic violence were more likely to have a delivery in a health facility and be assisted by a health professional. This is consistent with the result of studies conducted in Ethiopia and Bangladesh (Kamal, 2013; Tiruneh et al., 2017). In Bangladesh, women who were against domestic violence and more independent economically were more likely to have four or more ANC service visits, which may lead the women to have a delivery in a health facility (Kamal, 2013). Women who had good composite labor force participation and a good knowledge level were more likely to have a delivery with a skilled assistant. This is consistent with the result of studies conducted in Senegal and Tanzania (Shimamoto & Gipson, 2015). If women have greater empowerment, in terms of knowledge and economic power, this will lead to improvement in their health. They can choose the best for their health, including choosing to have a safe delivery (Prata et al., 2017). Therefore, gender equality needs to be improved so women can make decisions about their health.
Husband/partner’s education attainment was found to be significantly associated with skilled assistant delivery. Women whose husband/partner had completed secondary or higher education were more likely to have a skilled assistant delivery. This is consistent with the results of studies conducted in Kenya and Somalia (Gitimu et al., 2015; Yusuf et al., 2017). Husbands with a higher level of education will have more knowledge about health, including safe delivery (Kifle et al., 2018). As the head of the household, the husband’s knowledge will affect the reproductive health decisions (Yusuf et al., 2017). Engagement of the husband in the issue of maternal health should be expanded in all levels of the community.
Women whose husband/partner’s occupation was non-agricultural were found to be significantly more likely to have a delivery with professional assistance. This finding is similar to those of studies conducted in Nigeria and Ethiopia (Adewemimo et al., 2014; Fekadu & Regassa, 2015). The husband’s occupation will affect the family’s income. If the family income increases, the decision to have a skilled assistant delivery will also be affected. In addition, another study conducted in Ethiopia found that women whose husbands work in a non-agricultural occupation tend to use an ANC service, which encourages the decision to give birth with professional assistance (Tsegay et al., 2013). Therefore, health promotion about safe delivery is important for the husband/partner, especially for husbands/partners whose occupation is agricultural.
This study used secondary data from the 2017 IDHS, so the selection of the variables was determined by the availability of the data. Another limitation is that some questions in the survey needed respondents to recall what happened five years preceding the survey, so the information may not be precisely stated. In addition to the limitations, however, this study has strengths. The sample of this study was selected using two-stage cluster sampling, so the data were nationally representative. Therefore, the results can provide recommendations for policymakers to develop effective regulation so the coverage gap of safe delivery between western and eastern provinces in Indonesia can be reduced.
Safe delivery was found to be determined by several factors, which reflected the need for multi-stakeholder intervention in increasing the practice of safe delivery across the country. Programmatic and structured policies that target poor women and those with a low education level and encourage husbands/partners’ participation in this issue may help increase the prevalence of safe delivery in the eastern part of Indonesia. This study gives some recommendations to the policymakers, such as health promotion about safe delivery should be prioritized for women who have a high birth rank. Moreover, not only the women, but also their husband/partner should be involved in health education. The coverage of health insurance and health facilities should be enhanced so that everyone can have equal access to health services. Furthermore, the women’s empowerment program should be maximized so that all the women can choose the best for their health.
Data used in this study is available online from the Indonesian 2017 Demographic and Health Survey (DHS) website under the ‘Individual Recode’ section. Access to the dataset requires registration and is granted only for legitimate research purposes. A guide for how to apply for dataset access is available at: https://dhsprogram.com/data/Access-Instructions.cfm.
| Views | Downloads | |
|---|---|---|
| F1000Research | - | - |
|
PubMed Central
Data from PMC are received and updated monthly.
|
- | - |
Provide sufficient details of any financial or non-financial competing interests to enable users to assess whether your comments might lead a reasonable person to question your impartiality. Consider the following examples, but note that this is not an exhaustive list:
Sign up for content alerts and receive a weekly or monthly email with all newly published articles
Already registered? Sign in
The email address should be the one you originally registered with F1000.
You registered with F1000 via Google, so we cannot reset your password.
To sign in, please click here.
If you still need help with your Google account password, please click here.
You registered with F1000 via Facebook, so we cannot reset your password.
To sign in, please click here.
If you still need help with your Facebook account password, please click here.
If your email address is registered with us, we will email you instructions to reset your password.
If you think you should have received this email but it has not arrived, please check your spam filters and/or contact for further assistance.
Comments on this article Comments (0)