Keywords
Molecular signature, Distance Matrix, Differential Gene Expression, Gene Signature, Rank statistics
This article is included in the Bioinformatics gateway.
Molecular signature, Distance Matrix, Differential Gene Expression, Gene Signature, Rank statistics
In the new version we have expanded the definition and introduction for our approach.
We have added additional analysis for Methylation data type to illustrate and validate our approach. New figures were added to demonstrate this.
Several minor editions to improve the manuscript were added.
See the authors' detailed response to the review by Roberto Malinverni
See the authors' detailed response to the review by Shailesh Tripathi
A signature based on a predefined Molecular Features Set (MFS), which is designed to distinguish biological conditions or phenotypes from each other, is a crucial concept in bioinformatics and precision medicine. In this context, signatures typically originate from MFS from contrasting experimental data from two or more sample groups, which differ phenotypically. These MFS incorporate information on the differences between the groups. The nature of the MFS depends on the modality of the original data. For instance, the MFS provided by the Differential Gene Expression approach is a list of Differentially Expressed genes (DEG); Differential Methylation analysis provides Differentially Methylated Cytosines or regions (DMC and DMR) as MFS.
A significant number of mutational, expression and methylation-based signatures have recently been published and they are actively used in research and translational medicine. Examples of expression-based signatures involve gene sets for clinical prognosis (e.g., PAM50,1 MammaPrint2), for pathways and gene enrichment analysis (e.g., MsigDB collections3), and for drug re-purposing (e.g., LINCS project4).
Direct quality assessment for MFS is currently hardly possible, since there are no ‘gold standard’ datasets where active Molecular Features are explicitly known. In this manuscript, we propose a novel approach - Hobotnica, that allows for measurement of MFS quality by addressing the key property of the signature, namely, its quality for data stratification.
Hobotnica leverages the quality of distance matrices obtained from any source, in order to assess the quality of the MFS from any data modality compared to a random MFS. In this study, we demonstrate its application to transcriptomic and methylation signatures.
The Hobotnica approach is as follows: For a given data set and a given MFS () we derive the inter-sample distance matrix (). Then we assess the quality of (and, thus, of ) with a summarizing function ( or by abuse of notation ) where () represents the labels of samples. In shorter notation,
We desire the function to gauge if the inner-class samples are closer to each other than to outer-class samples. If no difference exists from one class to another, must be close to zero and as the difference grows, grows. In the ideal case of a perfect separation, reaches its maximum at 1:
Under the null hypothesis of Hobotnica (()), no significant difference exists between and the of an equal-sized general random set. On the contrary, the alternative () hypothesizes that generates higher than most random of the same size. To estimate a null distribution for Hobotnica’s , we applied a permutation test. As our default options, we use Kendall distance as the distance measure and Mann-Whitney-Wilcoxon test as the summarizing function.
When instead of a single a set of hypotheses is in place, for each Molecular Feature Set corresponding Distance Matrix can be generated, and than, in turn, particular value of the measure :
Thus, for every MFS from set of hypotheses H-score may be computed, resulting in a set . Comparing values allows for corresponding Feature Sets qualities ranking and selecting the most informative Signatures for the Data .
For two groups of samples, R and G, taking into account the nature of Distance Matrix (0-diagonal and symmetry), the corresponding lower triangle matrix may be considered (Figure 1A). The distance values of this matrix dpq can be ranked (Figure 1B), producing new matrix with natural values rpq (Figure 1C).
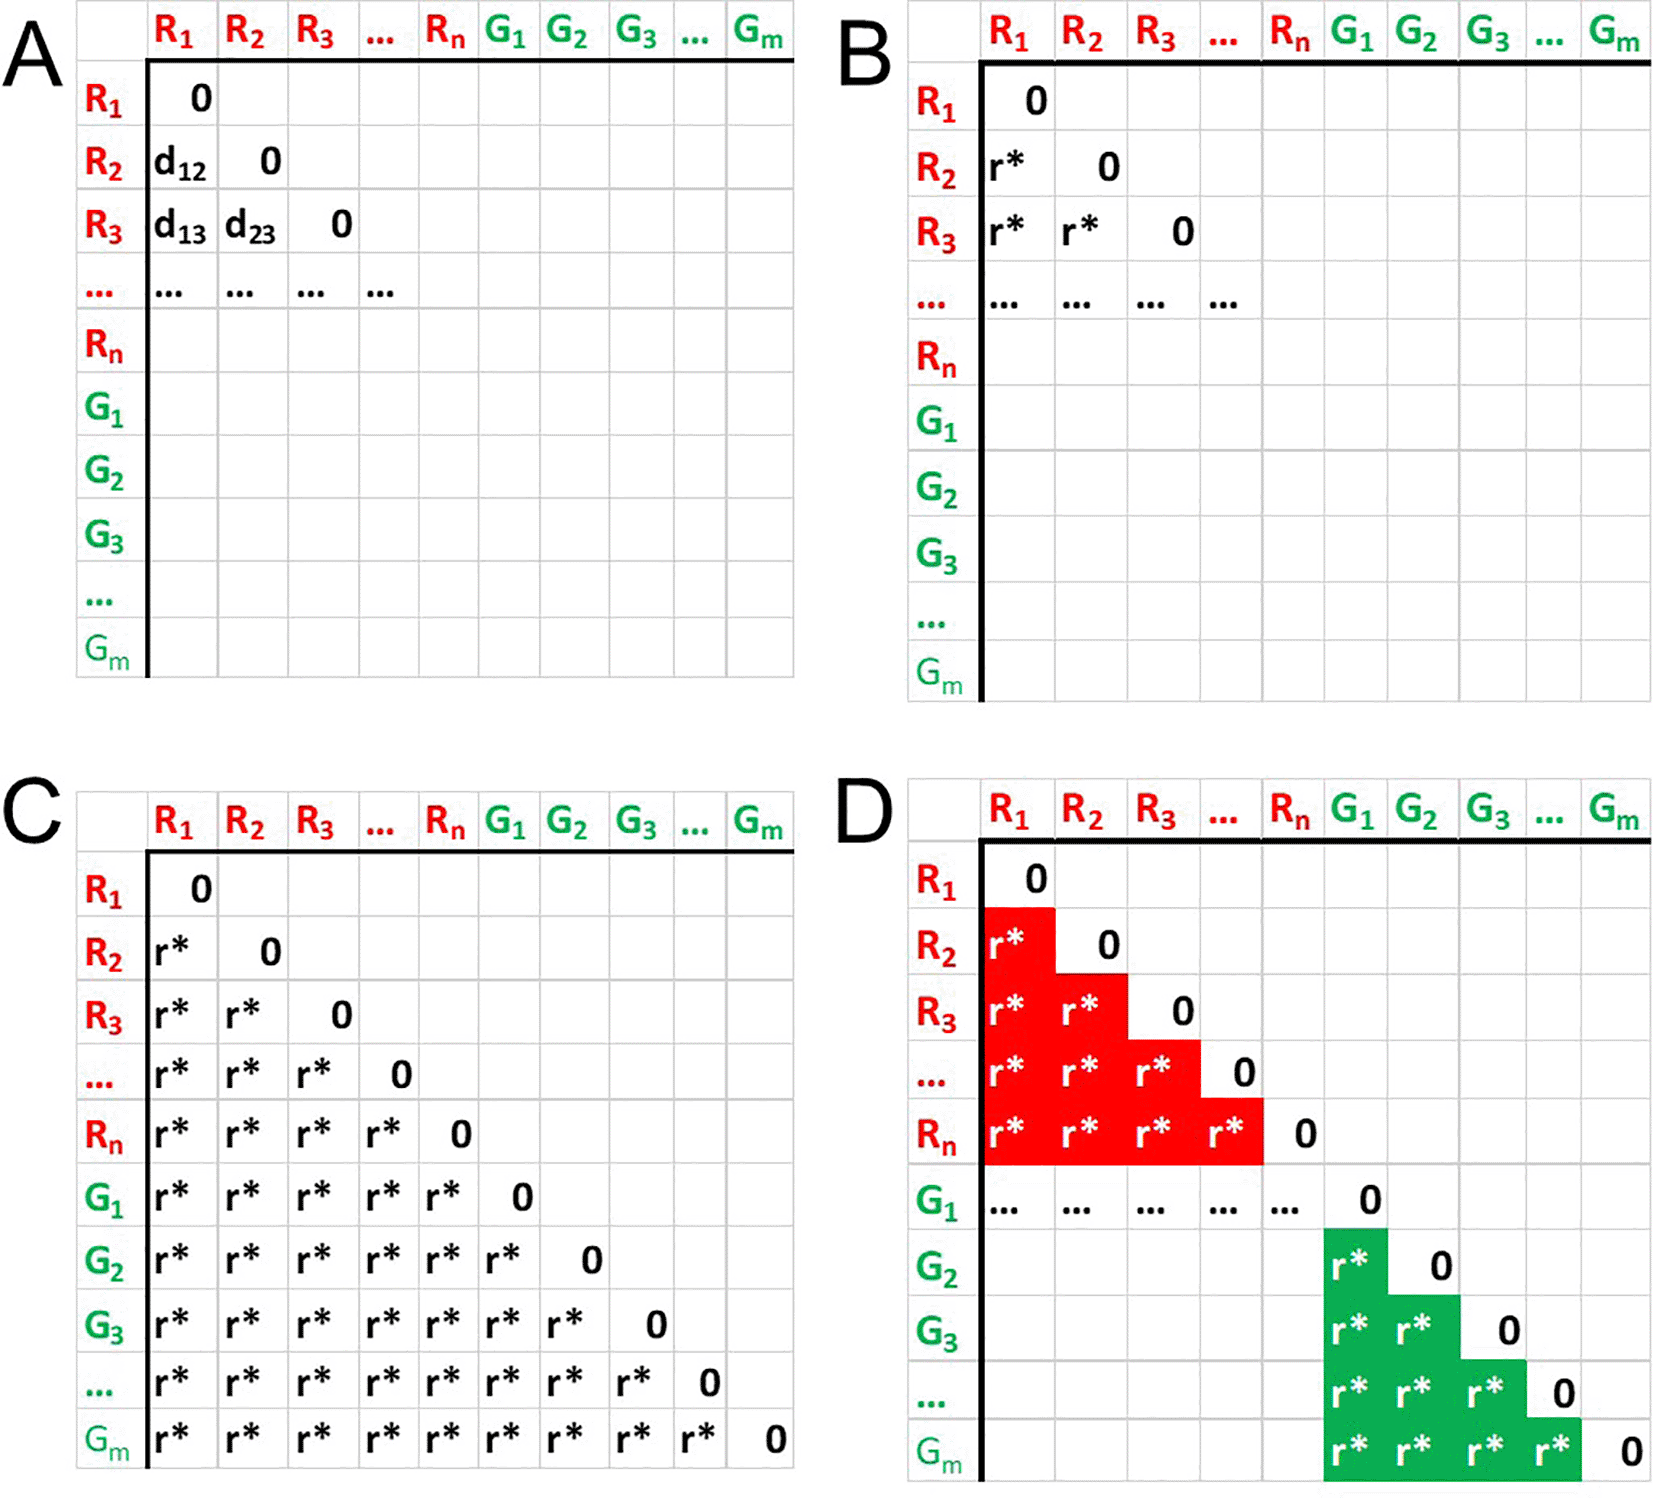
Subseting the matrix to values corresponding to in-class distances (Figure 1D), we can compute sum of these ranks Σ.
Given the numbers of samples is n in group 1 and in m group 2, total number of ranks (and therefore max value of a rank) in un-subsetted triangle matrix will be
Likewise, total number of ranks is subsetted to in-class values will be
Σ reaches its min value A if the subset procedure selects minimal values of ranks, or, in other words, ranks in the selected part of rank matrix are values from 1 to M:
The minimal value is reached when the lowest ranks reside in the diagonal squares of the distance matrix that correspond to in-group distances, and, therefore, best groups separation. Similarly, max value B is delivered when maximal values of Ranks Matrix are selected - from (N − M) to N:
Thus, Σ ∈ [A, B]. Now performing a scaling of compact [A, B] to [0, 1] finally allows us to retrieve value α with requested properties:
This procedure finally allows to introduce measure α with necessary listed properties. We refer to this measure as Hobotnica, or H-score.
Thus, for every Gene Signature GSi from set of hypotheses {H1 : GS1, H2 : GS2, ..., Hn : GSn} H-score αi may be computed, resulting in a set 〈α1, α2, ... αn〉. Comparing and ranking α values allows for corresponding Gene Signatures qualities ranking and comparison.
The proposed approach is different from existing metrics, such as often used Rand index5 and other clusteringbased measures, as it allows one to avoid clustering procedure, that itself may be carried out with various approaches and parameters.6–8 In contract to clustering-based methods, H-scores directly reflects the sample stratification quality.
To validate our approach, we conducted four case studies.
In the first case study we extracted RNA-seq expression dataset for prostate cancer from the Cancer Genome Atlas (TCGA) on counts level.9 As MFSs, we recruited the C2 collection of molecular signatures from MSigDB,3,10 that contains a number of prostate-related gene sets. This way, every candidate MFS (gene set from the collection) produced its specific H-score.
For the second case study, we recruited the PAM50 molecular signature,11 which was designed for classifying various breast cancer subtypes, as MFS. Then, we applied it to several datasets containing these breast cancer subtypes.9,12–15
In the third case study, we explored H-scores delivered by various DGE approaches. We performed DGE analysis for two groups of mice samples with different response to MYC factor treatment (Mycfl/fl vs MycIE, ERT2 genotypes)16 with DESeq217 and edgeR.18
The top 100 genes for each method were then retrieved. In addition, we extracted a list of genes genes with the highest variance in expression, as well as a number of random gene sets.
In each case, the counts were normalised to counts per million (cpm). For every geneset an H-score and its p-value with BH19 correction were computed.
In the last case the Hobotnica application for differential methylation signatures assessment was demonstrated. Hobotnica was applied to the signature from study20 that distinguish B-cell subpopulations with mutated and unmutated IGHV from patients with chronic lymphocytic leukemia (M-CLL and U-CLL). The signature was derived from the data obtained on 450k Human Methylation Array, the length of the signature is 3265 sites.
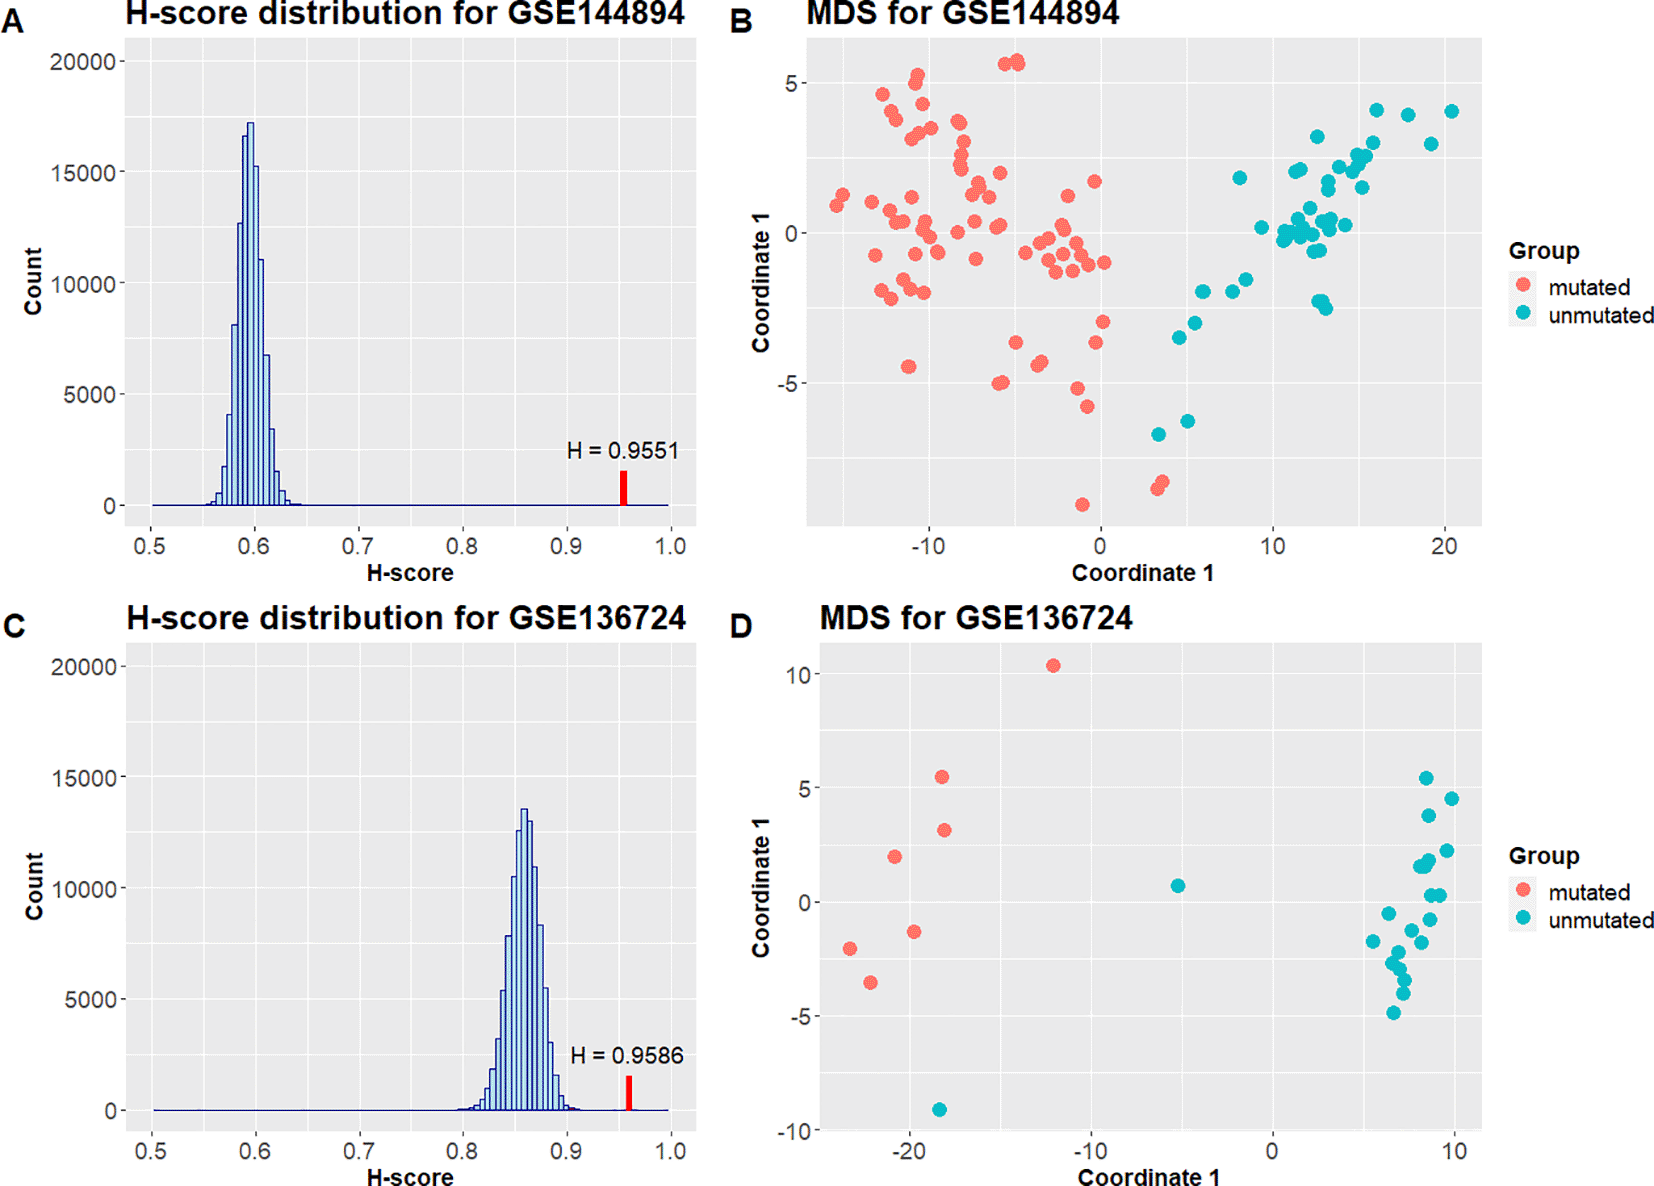
The signature was validated on datasets from other experiments containing the same comparison groups (M-CLL and U-CLL): GSE136724 from,21 GSE143411 from22 and GSE144894 from.23 Datasets GSE136724 and GSE143411 contain samples from patients after chemo(immune) therapy and untreated samples, only untreated groups were used for validation. H-score was calculated for each dataset using matrices of beta values with beta-mixture quantile normalization. The signature was reduced to 3089 sites for GSE136724, 3091 sites for GSE143411 and 3254 for GSE144894. The p-value was calculated based on 100000 random signatures of the same length using pseudocount.
Prostate-related C2 gene sets clearly demonstrated highest H-score values and sufficient statistical significance (Table 1, Figure 2A), as well as data stratification (Figure 2B), which is expected for prostate cancer as opposed to control contrast. Gene sets not attributed to prostate cancer-related processes did not achieve statistically significant p-values (Table 1).
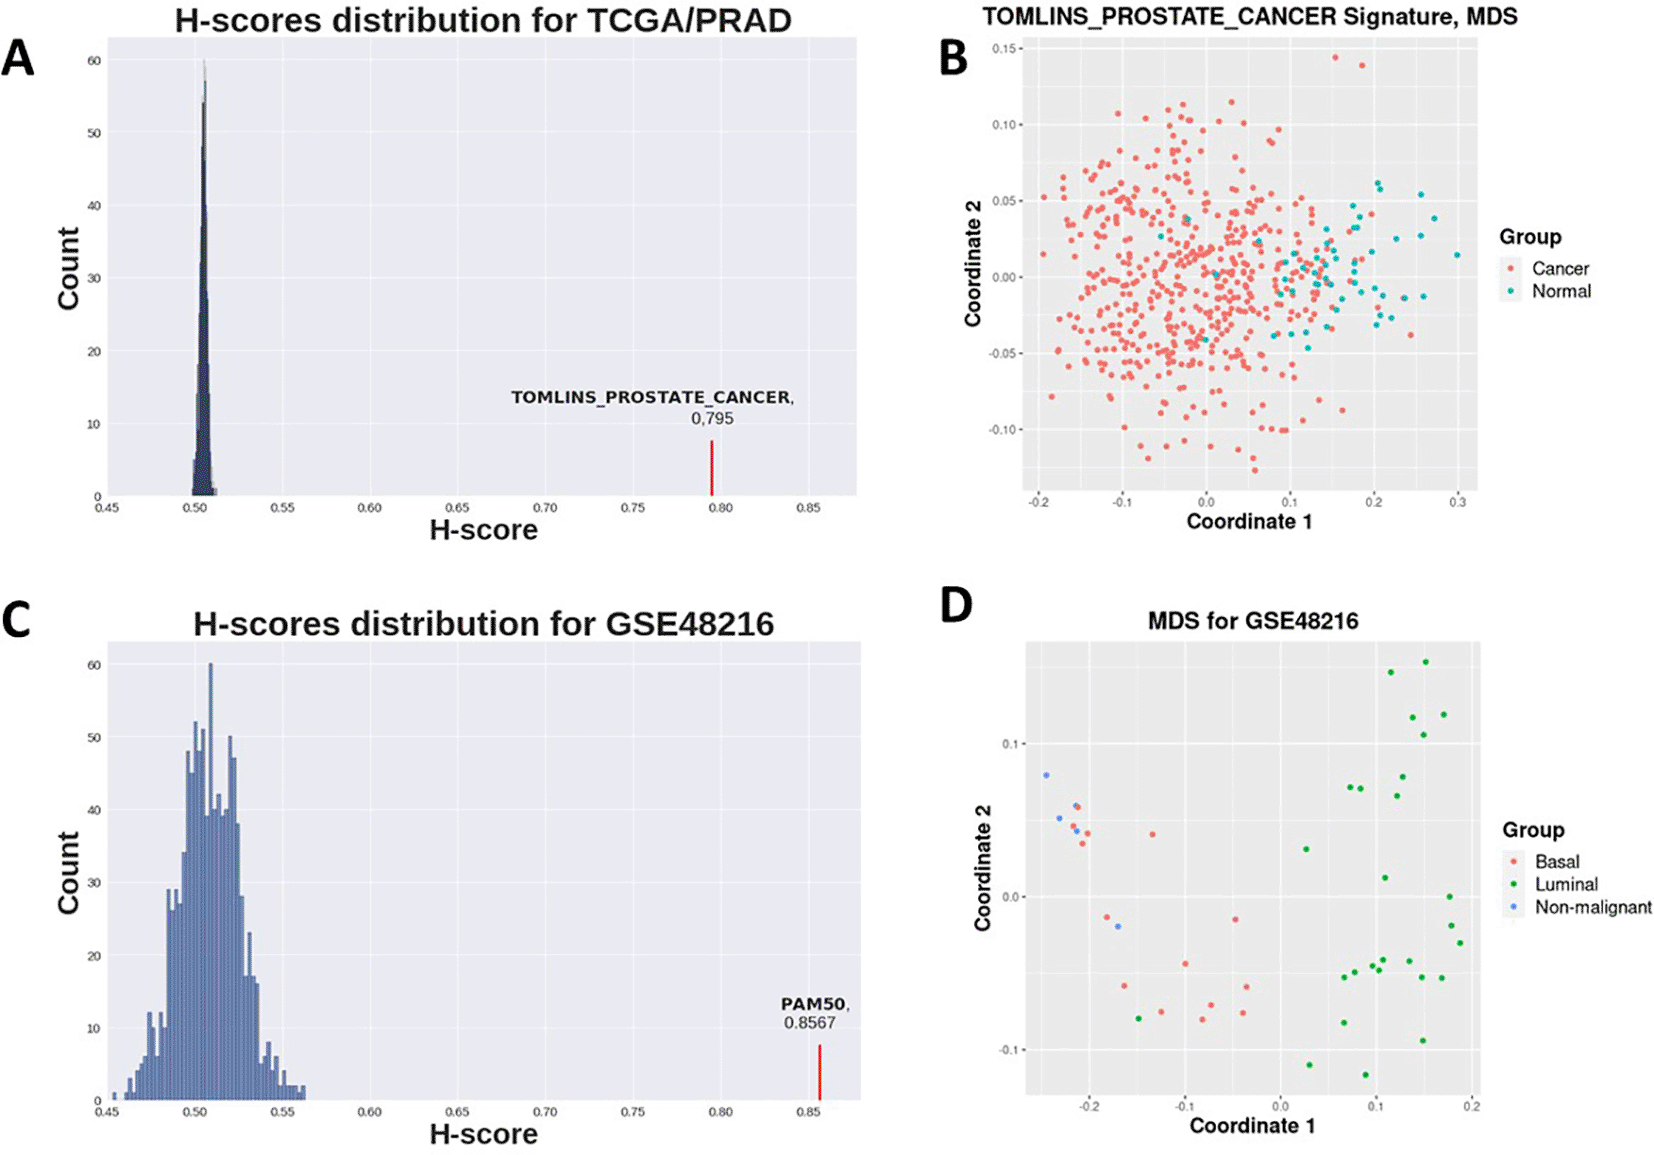
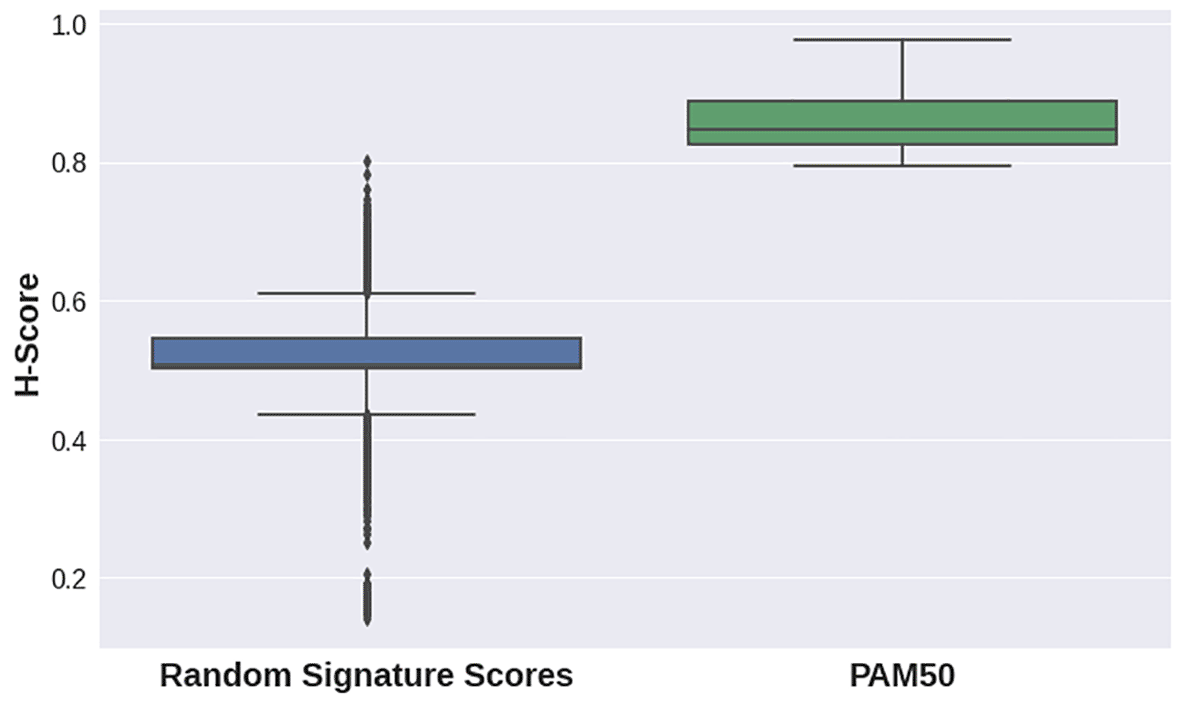
H-scores for the PAM50 signature were evidently higher for all datasets in the second case study than those for random gene sets for the same datasets (Figure 3, Figure 2C). This implies that the PAM50 signature exhibits a high stratification quality for various breast cancer subtypes samples. PAM50-delivered H-scores also demonstrated highly statistically significant p-values (Table 2).
| GEO Accession | Sample size | Groups in dataset | H-score | p-value |
|---|---|---|---|---|
| GSE58135 | 168 | 6 | 0.772 | 7e-4 |
| GSE62944 | 1067 | 5 | 0.8892 | 0.0003 |
| GSE48216 | 46 | 3 | 0.8567 | 0.0003 |
| GSE80333 | 10 | 3 | 0.9765 | 0.0003 |
In the third case study, various DGE approaches resulted in gene sets that delivered significantly different H-scores (Figure 4). For this dataset, edgeR provided a signature with the best quality score, while DESeq2 still demonstrated a higher separation quality than that of random signatures. Genes with the highest variance showed lower scores compared to random gene sets. This result stresses the importance of the Hobotnica procedure to evaluate the quality of a particular DGE analysis.
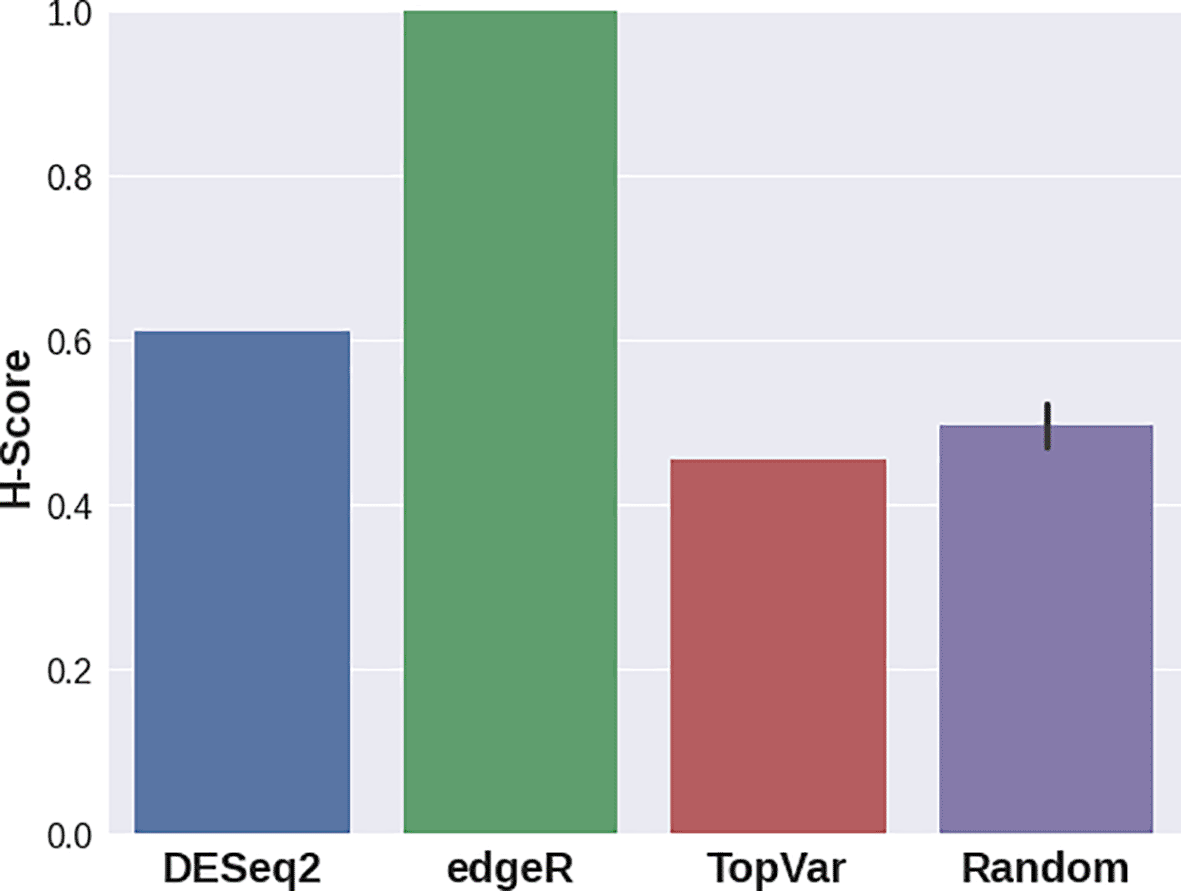
Table 3 contains the result H-scores and the corresponding p-values for differential methylation signature validation. H-score values are close to 1, and the p-values are less than 0.05 for all tested datasets. The distributions of Hscores obtained from 100000 random signatures of the same length that were used for p-value calculation are shown in Figure 5. Figure 5 displays MDS plots based on submatrices that include only differential methylation signature sites.
| GEO Accession | Unmutated sample size | Mutated sample size | H-score | p-value |
|---|---|---|---|---|
| GSE136724 | 22 | 7 | 0.9586 | 9.9999e-06 |
| GSE143411 | 8 | 2 | 1 | 9.9999e-06 |
| GSE144894 | 44 | 76 | 0.9551 | 9.9999e-06 |
Hobotnica was designed to quantitatively evaluate MFS quality through their ability for data stratification, based on their inter-sample distance matrices, and to assess the statistical significance of the results. We demonstrated that Hobotnica can efficiently estimate the quality of a molecular signature in the context of expression data.
The suggested method can be used to evaluate various sorts of MFSs: those retrieved from DGE or DM analyses, Mutation/single nucleotide variation calling or pathways analysis, as well as data modalities of other types, that are suitable as differential problems.
The non-parametric statistic used in the approach not only allows for MFS of various types (differential, predefined, etc.) and data modalities (expression, methylation, etc.), but also for different structure of contrasted samples groups (sample size, preprocessing methods, etc.).
A possible application of Hobotnica is evaluating a particular model’s performance (e.g., DGE model) for a particular dataset. This will allow researchers to choose a method that delivers a signature with the best data stratification from a number of proposed approaches.
Assessing H-score values for various lengths of the same set or signature can be explored with the proposed method, which will help to optimize MFS structure. Such procedures can be especially crucial in clinical applications.
NCBI Gene Expression Omnibus: Alternatively processed and compiled RNA-Sequencing and clinical data for thousands of samples from The Cancer Genome Atlas, https://identifiers.org/ncbiprotein:GSE62944
NCBI Gene Expression Omnibus: Modeling precision treatment of breast cancer, https://identifiers.org/ncbiprotein:GSE48216
NCBI Gene Expression Omnibus: Spatial proximity to fibroblasts impacts molecular features and therapeutic sensitivity of breast cancer cells influencing clinical outcomes, https://identifiers.org/ncbiprotein:GSE80333
NCBI Gene Expression Omnibus: Next Generation Sequencing Analysis of Mycfl/fl and MycIE, ERT2 intestinal transcriptomes, https://identifiers.org/ncbiprotein:GSE155460
NCBI Gene Expression Omnibus: DNA methylation of chronic lymphocytic leukemia with differential response to chemotherapy, https://identifiers.org/ncbiprotein:GSE136724
NCBI Gene Expression Omnibus: A dataset of sequential DNA methylation profiles (2 timepoints) of 10 patients with chronic lymphocytic leukemia, https://identifiers.org/ncbiprotein:GSE143411
NCBI Gene Expression Omnibus: CLL intraclonal fractions exhibit established and recently-acquired patterns of DNA methylation [ME], https://identifiers.org/ncbiprotein:GSE144894
Analysis code
Analysis code available from: https://github.com/lab-medvedeva/Hobotnica-main
Archived analysis code as at time of publication: https://doi.org/10.5281/zenodo.5656814
License: GNU General Public License v2.0
We thank Frank Emmert-Streib, Leslie Cope and Elana Fertig for fruitful discussions.
| Views | Downloads | |
|---|---|---|
| F1000Research | - | - |
|
PubMed Central
Data from PMC are received and updated monthly.
|
- | - |
Competing Interests: No competing interests were disclosed.
Reviewer Expertise: Epigenetics. R-developrer
Competing Interests: No competing interests were disclosed.
Reviewer Expertise: Data science, Machine learning, network analysis, computational biology, gene expression data analysis
Is the rationale for developing the new method (or application) clearly explained?
Partly
Is the description of the method technically sound?
Partly
Are sufficient details provided to allow replication of the method development and its use by others?
Yes
If any results are presented, are all the source data underlying the results available to ensure full reproducibility?
Yes
Are the conclusions about the method and its performance adequately supported by the findings presented in the article?
Partly
Competing Interests: No competing interests were disclosed.
Reviewer Expertise: Data science, Machine learning, network analysis, computational biology, gene expression data analysis
Is the rationale for developing the new method (or application) clearly explained?
Yes
Is the description of the method technically sound?
Partly
Are sufficient details provided to allow replication of the method development and its use by others?
Partly
If any results are presented, are all the source data underlying the results available to ensure full reproducibility?
Yes
Are the conclusions about the method and its performance adequately supported by the findings presented in the article?
Partly
Competing Interests: No competing interests were disclosed.
Reviewer Expertise: Epigenetics. R-developrer
Alongside their report, reviewers assign a status to the article:
| Invited Reviewers | ||
|---|---|---|
| 1 | 2 | |
|
Version 2 (revision) 16 Aug 22 |
read | read |
|
Version 1 08 Dec 21 |
read | read |
Provide sufficient details of any financial or non-financial competing interests to enable users to assess whether your comments might lead a reasonable person to question your impartiality. Consider the following examples, but note that this is not an exhaustive list:
Sign up for content alerts and receive a weekly or monthly email with all newly published articles
Already registered? Sign in
The email address should be the one you originally registered with F1000.
You registered with F1000 via Google, so we cannot reset your password.
To sign in, please click here.
If you still need help with your Google account password, please click here.
You registered with F1000 via Facebook, so we cannot reset your password.
To sign in, please click here.
If you still need help with your Facebook account password, please click here.
If your email address is registered with us, we will email you instructions to reset your password.
If you think you should have received this email but it has not arrived, please check your spam filters and/or contact for further assistance.
Comments on this article Comments (0)