Keywords
Alzheimer’s disease, cognitive decline, risk score, DNA methylation, epigenetics
This article is included in the Bioinformatics gateway.
This article is included in the Genomics and Genetics gateway.
Alzheimer’s disease, cognitive decline, risk score, DNA methylation, epigenetics
Alzheimer’s disease (AD) is a neurodegenerative and heterogeneous disorder with complex etiology and devastating impact on individuals and families. Although genome-wide association studies continue to provide insight into the genetic susceptibility to AD,1,2 epigenome-wide association studies (EWAS) and, in particular, studies of DNA methylation (DNAm) have the potential to capture signals related to environmental contributions.3 Mild cognitive impairment (MCI) may represent an intermediate stage of AD4 and the ability to identify MCI patients at greater risk of conversion to AD could guide personalized strategies for mitigation of decline, as the pathology of AD may be present years before onset of symptoms.5 Risk scores that provide predictive measures of AD susceptibility have been created using genetic6,7 and blood transcriptomic data.8 Epigenome-wide associations studies in peripheral blood have identified differentially methylated CpG sites associated with AD9–11 and AD progression.12–16 Associations between peripheral blood epigenetic age acceleration and cognitive function have also been examined.17,18
This study was focused on development of a methylation risk score (MRS) predictive of conversion from MCI to AD, using publicly available DNA methylation data9 and machine learning methods. This score was evaluated in cross-sectional data in AD subjects and controls in both the primary and a secondary datasets to help understand the relationship of the conversion risk score to overall disease severity. This study provides insight into the value epigenetics could provide in a multi-omic risk score of conversion.
To create the risk score, blood DNA methylation (DNAm) data from an EWAS of AD in 300 subjects9 were obtained from the Gene Expression Omnibus (GEO: GSE144858). The cross-European AddNeuroMed study dataset includes 93 subjects with Alzheimer’s, 111 with MCI and 96 control subjects. Of the 111 MCI subjects, 68 were stable after one year, 39 converted to AD within one year and four converted at an unknown time. Roubroeks and colleagues9 extracted DNA from the blood samples and assayed DNA methylation levels using the Illumina Infinium Human Methylation 450K BeadChip array. After quality control analyses, they quantile-normalized the data using the dasen method from the R package wateRmelon to create a matrix of beta values (CpG sites in rows and subjects in columns). The data from the four subjects with unknown conversion date were excluded. Two MCI subjects less than 65 years of age, excluded from the study by Roubroeks et al.,9 were included in this study. Prior to the analyses in this study, any CpG site with a detection p-value >0 for any subject was excluded. Using the annotation from Zhou et al.,19 CpG sites with probe mapping issues or having a SNP with minor allele frequencies >1% within five bases were also removed. To reduce the influence of genetics on the prediction models, CpG sites with significant genetic associations (methylation quantitative trait loci: mQTL) in peripheral blood20 were also removed. The beta values for the remaining CG-annotated sites were retained for analysis. To identify possible sex mismatches, multidimensional scaling (MDS) plots were created using the cmdscale function in R and the X and Y chromosome data. MDS plots were also created using high variance DNAm data to observe batch effects. No sex mismatches or batch effects were observed.
An independent set of blood DNA methylation data from an epigenome-wide meta-analysis of neurodegenerative disorders21 was obtained from the Gene Expression Omnibus. The Australian Imaging, Biomarker & Lifestyle Flagship Study of Aging (AIBL) dataset of 726 subjects included 161 subjects with Alzheimer’s, 94 with MCI and 471 control subjects. Longitudinal information regarding conversion to AD is not available in this study. Nabais and colleagues21 assayed DNAm using the Illumina HumanMethylationEPIC BeadChip Array. Although data processed using functional normalization were publicly available, the methylated and unmethylated intensities were used to create a dataset normalized using dasen in the R package wateRmelon22 to create a matrix of beta values. Prior to normalization, CpG sites with a detection p-value >0 for any subject were excluded. CpG sites with probe mapping issues, nearby SNPs with minor allele frequencies >1%19 or a significant mQTL in peripheral blood20 were also removed. Following dasen normalization, no sex mismatches were observed in the MDS plot created using the X and Y chromosome data. The beta values for the remaining CG-annotated sites were retained for analysis.
A methylation risk score of MCI conversion was created using an elastic-net binomial (classification) model via the R package glmnet.23 This regularized regression method combines the L1 and L2 penalties of the lasso and ridge methods and provides the ability to retain correlated features. To adjust model and feature selection performance, the contribution of each penalty is selected using the hyperparameter alpha. Using DNAm beta values, age and sex as predictors and the MCI outcome (stable or conversion to AD) as the response, a model was trained using a 10-fold cross-validation approach. Given the limited number of MCI subjects, all data were used in the training process. The alpha hyperparameter was chosen to minimize the cross-validation misclassification error. To compare the performance with a score based on demographics only, a binomial risk score model was created using the glm function in R with age and sex as predictors.
Receiver operating characteristic (ROC) curves were created for each fold using the function roc.glmnet and for the final model with all training data using the function roc in the R package pROC.24 Risk scores were calculated using the final conversion risk score model via the predict function in the glmnet package.
After quality control procedures, peripheral blood DNAm data were available for 251,491 CpG sites and 296 samples, including 93 AD subjects, 107 MCI subjects (68 stable, 39 converter) and 96 controls in the Roubroeks et al. (GSE144858) dataset (Table 1). Approximately 60% of the European subjects were female (52% female among MCI subjects).
| GSE1448589 | GSE15371221 | |
|---|---|---|
| Age in years (mean ± sd) | 75 ± 6.5 | N/A |
| Sex (Female/Male) | 177/119 | 400/326 |
| Disease status | ||
| Control | 96 | 471 |
| Mild cognitive impairment | 107 (68 stable, 39 converted*) | 94 |
| Alzheimer’s disease | 93 | 161 |
An elastic net model was trained using the DNAm beta values (range: 0 to 1) for the MCI subjects. The beta values, age, and sex were included as possible predictors and the MCI outcome (stable or conversion to AD) was the response. Blood cell distribution values were not included in the model, seeking an epigenetic prediction model that may capture biology including shifts in cell abundance with conversion to AD. With a focus on more robust signatures, only CpG sites with variance in the top quartile (62,873 CpG sites) were included in the training set. After executing cross-validation for values of alpha from 0 to 1, an alpha value of 0.8 was observed to minimize cross-validation classification error (error = 0.34).
The final model from this process included four features, all CpG sites (Table 2). Three of the sites are annotated to the genes PNCK (cg01231576), SLC6A3 (cg09892121), and TRIM62 (cg25342005), with a fourth (cg17292662) near the genes ATP6V1H and RGS20. The distribution of the beta values for these sites are centered between 0.6 and 0.8 (Figures S1 to S4, Extended data). ROC curves were produced for each of the 10 folds (Figure S5, Extended data) with alpha=0.8 and the highest observed area under the ROC curve (AUC) was 0.635. A ROC curve was also created using the training data with the final model (Figure S6, Extended data) and the AUC was 0.877.
| CpG site | Chromosome | Gene annotation* | Relationship to gene | CpG island location |
|---|---|---|---|---|
| cg01231576 | Chr X | PNCK | TSS1500 | S_Shore |
| cg09892121 | Chr 5 | SLC6A3 | Body | OpenSea |
| cg17292662 | Chr 8 | ATP6V1H #, RGS20 # | N/A | S_Shelf |
| cg25342005 | Chr 1 | TRIM62 | TSS1500 | S_Shore |
* Illumina Infinium 450K BeadChip annotation from Zhou et al.19
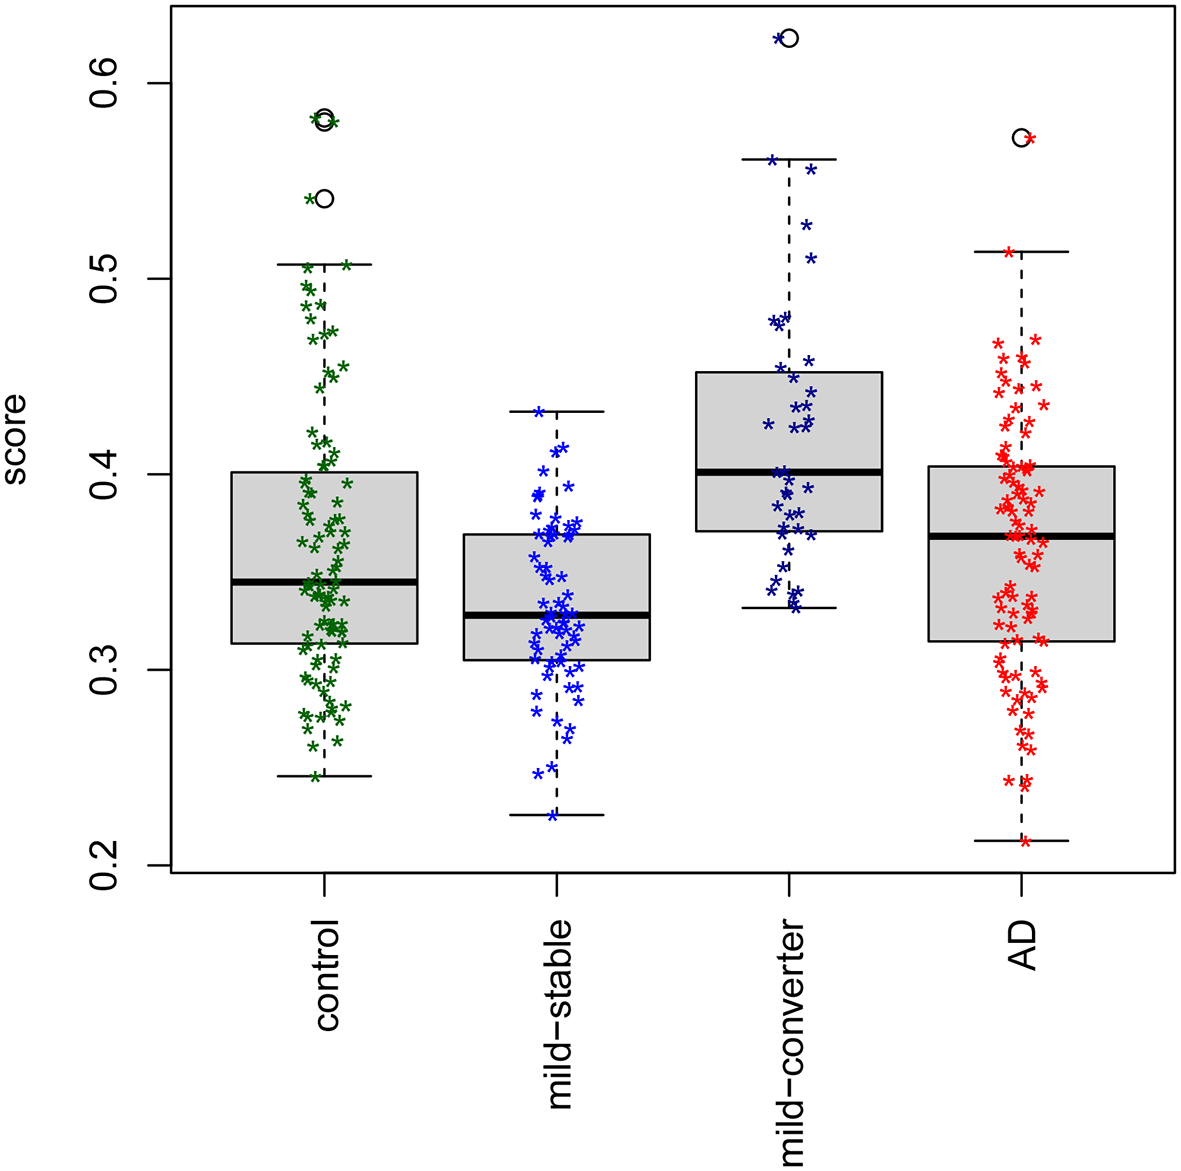
The methylation risk score (predicted probability of conversion) was calculated using the final model and the DNAm beta values. A significant difference (p < 0.0001, t-test) in the score for MCI stable subjects compared with MCI converters may be observed in the box plots of the risk score (Figure 1). For MCI subjects, being above the mean MRS compared with below the mean equates to an odds ratio of 9.8 for conversion. Also included in Figure 1 are the scores for the AD subjects and controls. The seven controls and seven AD cases less than 65 years of age, excluded in the analyses by Roubroeks et al., were included in the MRS calculations in Figure 1. A nominal increase in MRS values may be observed with increased severity at baseline (Figure S7, Extended data), with no statistically significant difference between AD and controls (p = 0.83, t-test), perhaps suggesting specificity of the risk score for susceptibility to conversion. Box plots were created using the beta values for each of the four predictive sites across disease severity, stratified by sex (Figures S8 to S11, Extended data). The direction of effect for DNAm with respect to conversion in the MCI subjects is consistent across males and females.
After processing, peripheral blood DNAm data were available for 601,732 CpG sites and 296 samples, including 161 AD subjects, 94 MCI subjects and 471 controls in the Nabais et al. (GSE153712) dataset (Table 1). Approximately 55% of the subjects were female. The MRS was calculated using the final conversion risk score model and the DNAm beta values in this secondary dataset. In the box plots across disease severity (Figure S12, Extended data), the MRS values increase with severity consistent with the discovery dataset. The MRS values are higher overall for the Nabais et al. data compared with Roubroeks et al. The secondary DNAm data were created using the Illumina HumanMethylationEPIC platform in contrast to the use of the Illumina 450K platform by Roubroeks et al.9
For the risk score created using only age and sex as predictors in the Roubroeks et al. dataset (Figure S13, Extended data), a significant difference was not observed between MCI stable and MCI converter (p = 0.2, t-test) and the AUC was 0.579 with the training data (Figure S14, Extended data).
In this study, a methylation risk score was created to quantify susceptibility to conversion from MCI to AD. Highly variable CpG sites were selected for development of the score, seeking information to inform identification of robust biomarkers. In addition, the effects of genetics were suppressed by excluding sites previously associated with an mQTL or located near a common SNP. Using a modest set of 107 subjects with MCI, the model demonstrated predictive capabilities. The limited set of selected features, an AUC in the training data of 0.877, and a maximum AUC during cross-validation of 0.635 suggests both higher variance and bias. An MRS may find better utility as a component in a comprehensive conversion susceptibility prediction strategy.
Two of the four predictive CpG sites (cg17292662, cg25342005) were identified in the previous study by Roubroeks and colleagues.9 These two sites were their top two findings in the EWAS of MCI conversion, though neither site was statistically significant. The CpG site cg17292662 is within 6,000 bases of the transcription start sites for two genes: ATP6V1H and RGS20. A prior GWAS has identified a variant in ATP6V1H (ATPase H+ transporting V1 subunit H) influencing human cerebrospinal fluid (CSF) β-site APP cleaving enzyme (BACE) activity.25 Previous studies have suggested that elevated beta-site amyloid precursor protein-cleaving enzyme 1 (BACE1) levels in CSF may be an indicator of MCI and early-stage AD (Zong Arch Gen Psychiatry), with BACE1 a possible therapeutic target.26 The gene RGS20 (regulator of G protein signaling 20) has biased expression in the brain and has been found to be downregulated in AD astrocytes.27 The CpG site cg25342005 is within 1500 bases of TSS of the gene TRIM62 (tripartite motif containing 62), a gene expressed in the brain. The CpG site cg09892121 is located within the gene SLC6A3 (solute carrier family 6 member 3) and was among the top 500 findings in the study by Roubroeks et al.9 The gene SLC6A3 encodes a dopamine transporter and a genetic variant in the gene was previously identified that may confer greater risk of dementia and cognitive decline.28 The fourth predictive site (cg01231576) is within 1500 bases of the PNCK (pregnancy up-regulated nonubiquitous CaM kinase) transcription start site. This site was not among the findings of Roubroeks, as the authors of that study did not include the sex chromosome DNAm data. The gene PNCK has biased expression in the brain and in a recent brain RNA-sequencing study, expression was associated with cognitive trajectories in a sex-specific manner.29 The MRS model leverages DNAm differences in the TSS of PNCK that are concordant across females and males.
Limitations of this study include the small population of MCI subjects with longitudinal outcomes for development of an MRS. Identifying a signature predictive of cognitive decline in peripheral blood presents many challenges with respect to signal and noise and a larger study population with longitudinal data would enhance future MRS creation efforts. The ability to effectively train an MRS model with 80% of the data, while holding out 20% of the data for validation, would provide an effective internal validation. Future efforts may also explore other machine learning frameworks, including deep learning, random forests and support vector machines. The secondary population for MRS evaluation lacked longitudinal outcome data. The disparity between MRS values for the training and secondary datasets may be due to the difference in assay platforms, as low correlations have been previously observed between Illumina 450K and EPIC DNA methylation data in blood for many CpG sites.30
The ability to identify MCI patients at greater risk of progression could inform early interventions and is a critical component in mitigation strategies for AD. This study is the first to develop a blood-based methylation risk score of conversion from mild cognitive impairment to Alzheimer’s disease. Although the predictive ability of the score is limited, this study demonstrates the potential value epigenetics would add to a risk score based on multi-omic and phenotypic data collected from the same patients.
| Views | Downloads | |
|---|---|---|
| F1000Research | - | - |
|
PubMed Central
Data from PMC are received and updated monthly.
|
- | - |
Provide sufficient details of any financial or non-financial competing interests to enable users to assess whether your comments might lead a reasonable person to question your impartiality. Consider the following examples, but note that this is not an exhaustive list:
Sign up for content alerts and receive a weekly or monthly email with all newly published articles
Already registered? Sign in
The email address should be the one you originally registered with F1000.
You registered with F1000 via Google, so we cannot reset your password.
To sign in, please click here.
If you still need help with your Google account password, please click here.
You registered with F1000 via Facebook, so we cannot reset your password.
To sign in, please click here.
If you still need help with your Facebook account password, please click here.
If your email address is registered with us, we will email you instructions to reset your password.
If you think you should have received this email but it has not arrived, please check your spam filters and/or contact for further assistance.
Comments on this article Comments (0)